

Key Talking Points:
- XAU/USD consolidates push higher as bond yields take a breather
- President Biden to address the nation on Covid-19 anniversary as stimulus package is approved

Recommended by Daniela Sabin Hathorn
Get Your Free Gold Forecast
Gold prices have been hard to comprehend in recent days, especially when inflation data in the US was in line with expectations, easing back fears of investors who were expecting a larger jump in prices and softening the recent spike in yields. One would expect gold to be slightly weaker on the back of this, playing down its appeal as an inflation hedge, but the commodity looks like it is solely focusing on the moves in the bond market given it is a non-yielding asset.
But XAU/USD has been trending higher in the last few days, which is likely a reaction to the recent weakness in the US Dollar and the relative calmness in bond markets, making short-term forecasts for the price of gold more challenging than usual. The US 10-year bond auction was also weaker than expected yesterday, bringing yields down further and propping up demand for gold.
Focus today will be on the ECB monetary policy meeting and the US jobless claims data ahead of President Biden’s speech where he will address the nation on the anniversary of the Covid-19 pandemic shutdown in the US, where he is expected to deliver optimism on the recovery of the economy and his approved 1.9 trillion stimulus bill, playing into the risk-on mood and weakening the US Dollar further, which would be supportive for gold in the short-term.
XAU/USD Daily chart
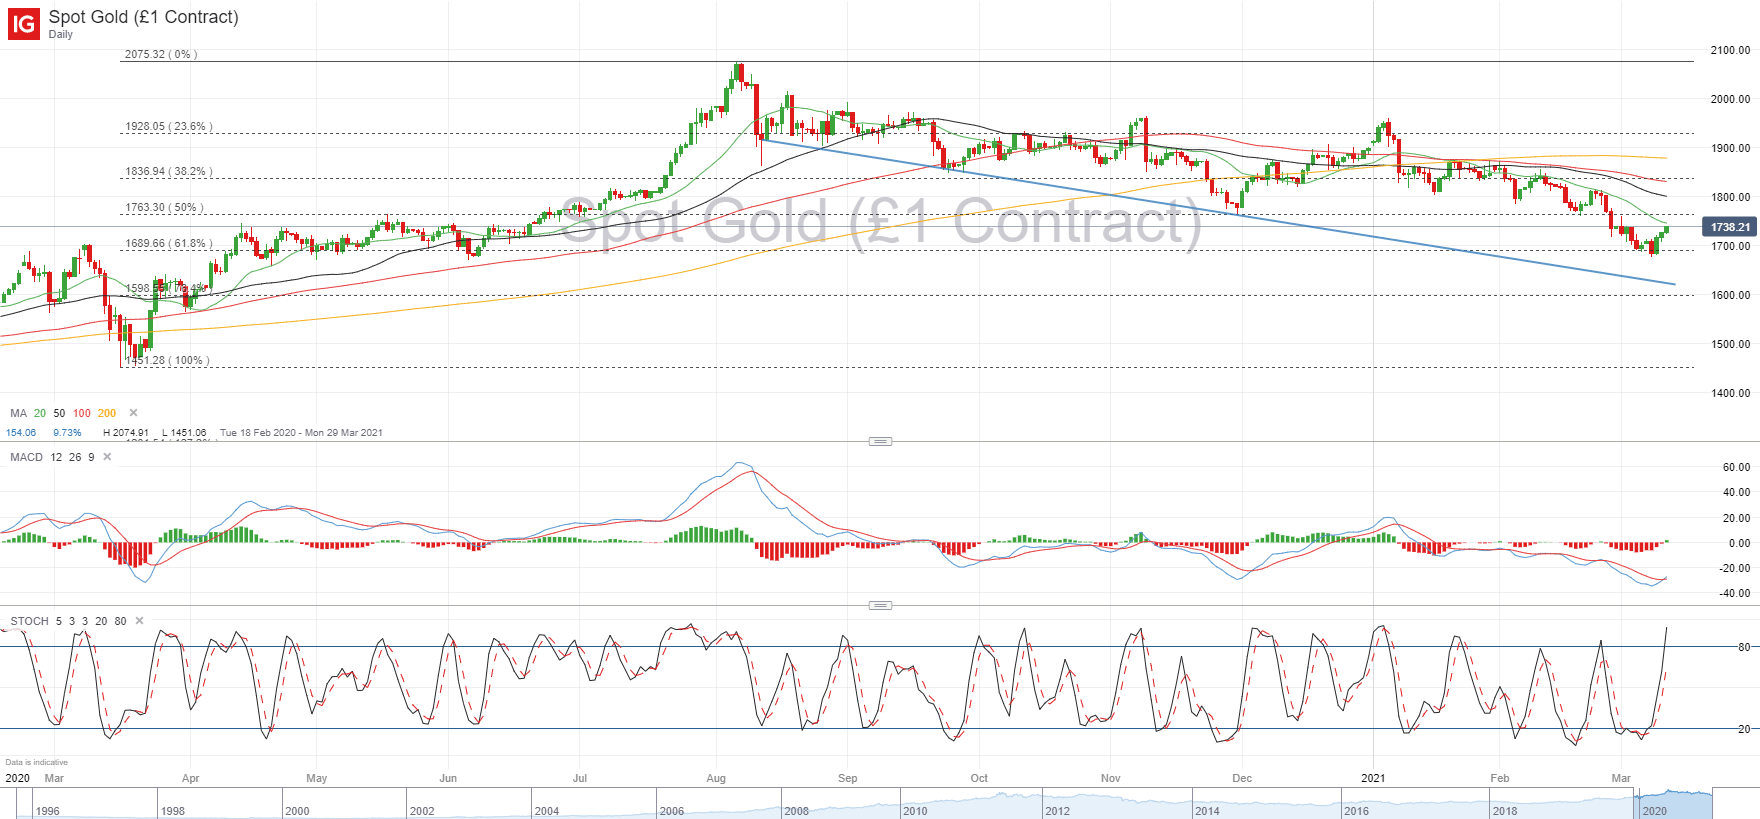
If I’m honest, the push higher in XAU/USD in the last three sessions seems a bit overstretched given how gold has performed in recent weeks. Current price is hovering around the resistance area seen last week at 1,738 and the 20-day moving average is looming close by at 1,745, where I can see further resistance to appearing in the short-term.
If bullish momentum is sustained, we could see an attempt to push above the 50% Fibonacci at 1,763 but I don’t expect this move higher to be a change in direction as it is likely to just remain as an attempted correction given how the US is entering a period of improved economic data and continued loose monetary policy. On this note, momentum indicators are giving mixed signals, with the MACD and RSI showing improved upside conditions whilst the stochastic is showing the most overbought conditions since the start of January.
Fibonacci for a Multi-Market Trader’s Approach
Focusing on the downside, the 61.8% Fibonacci at 1,689 remains a good area of support but an increase in bearish momentum could see XAU/USD retest the descending trendline from the highs since August 2020, which now rests around the 1,618 area.
| Change in | Longs | Shorts | OI |
| Daily | 2% | -19% | -1% |
| Weekly | 5% | -7% | 3% |
Learn more about the stock market basics here or download our free trading guides.
— Written by Daniela Sabin Hathorn, Market Analyst
Follow Daniela on Twitter @HathornSabin
Be the first to comment