

Gold Talking Points:
Gold prices have went from feast to famine in a week. Just last Monday buyers were in-charge in a big way, pushing up for another test of the $2,000/oz psychological level that’s become somewhat of a stumbling block for Gold bulls of recent.
Just after that hit, the flow changed on Gold as sellers started to take a stand. Prices then cut through all nearby supports on the way to brewing a bearish engulfing candlestick on the weekly chart. This put the focus back on the bearish side of Gold and given the massive spot of support that remained, there was a fairly clear objective for sellers to clear on the chart.
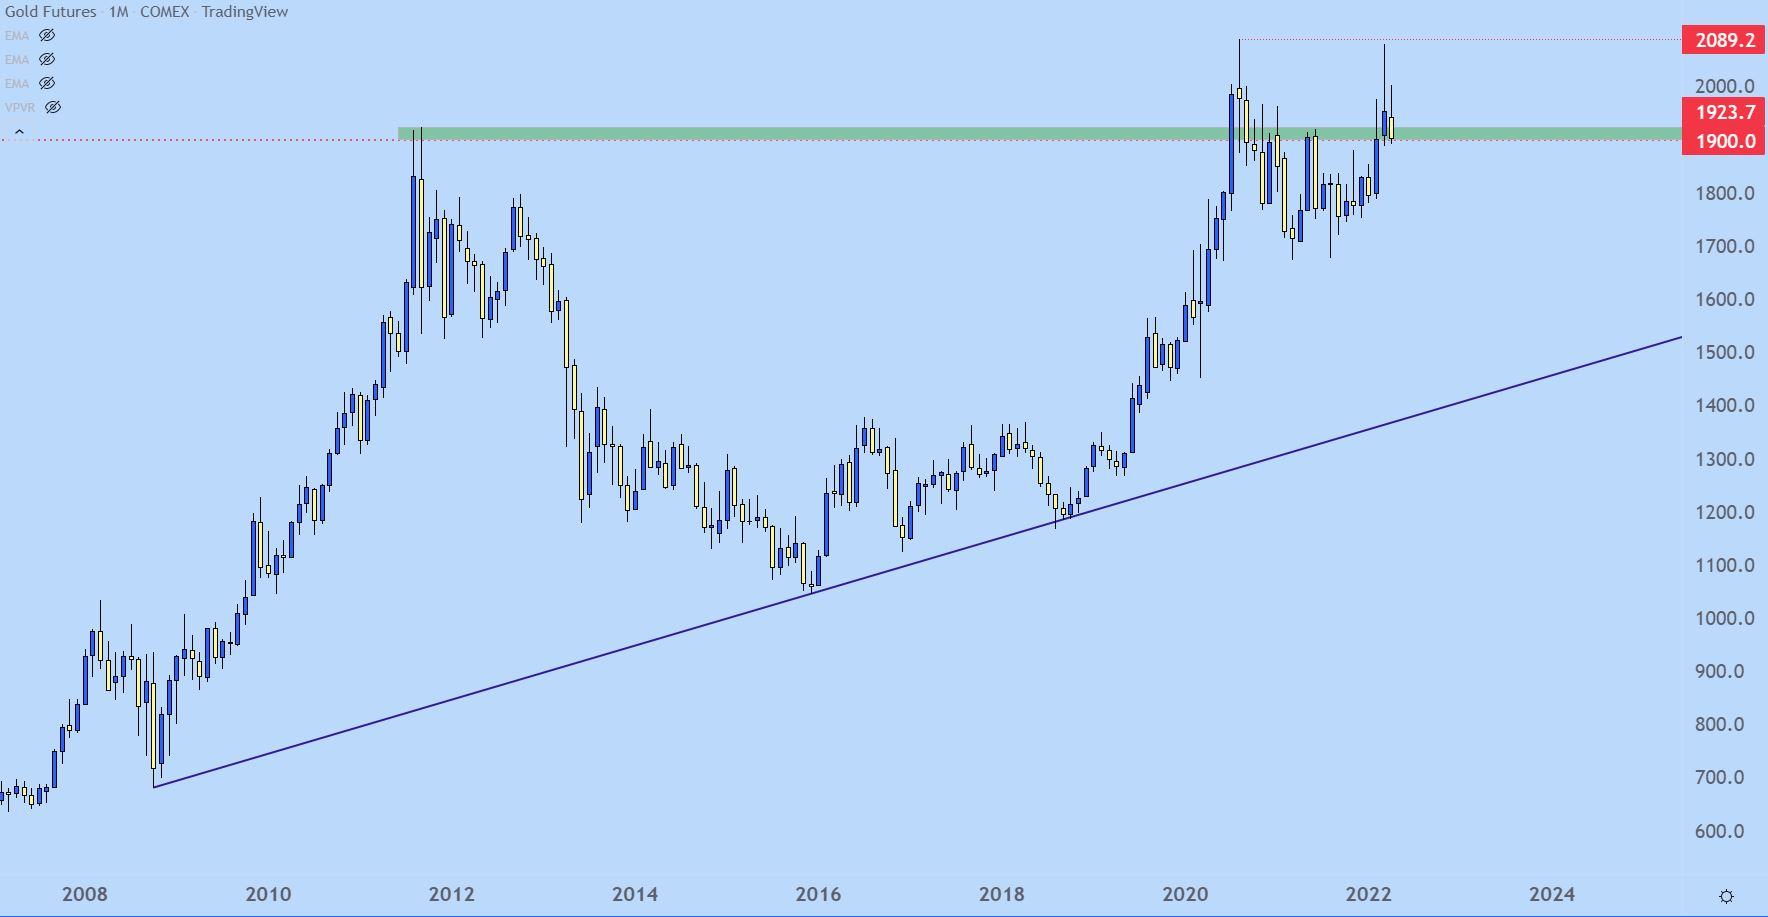
This zone runs from the psychological level of 1900 up to the prior all-time-high at 1923.7, and for the past two months this area has been functioning as support in Gold.
Gold Monthly Price Chart
Chart prepared by James Stanley; Gold on Tradingview
From the weekly chart below, we can see that recently completed bearish engulf, going along with this morning’s quick test below the 1900 level. If bears can continue to push, deeper support potential exists around prior price action swings of 1879 and 1842. If sellers can push for a longer-term reversal deeper into Q2, and a major level sits at 1784 which was a batch of support in Gold around the New Year open.
Gold Weekly Price Chart
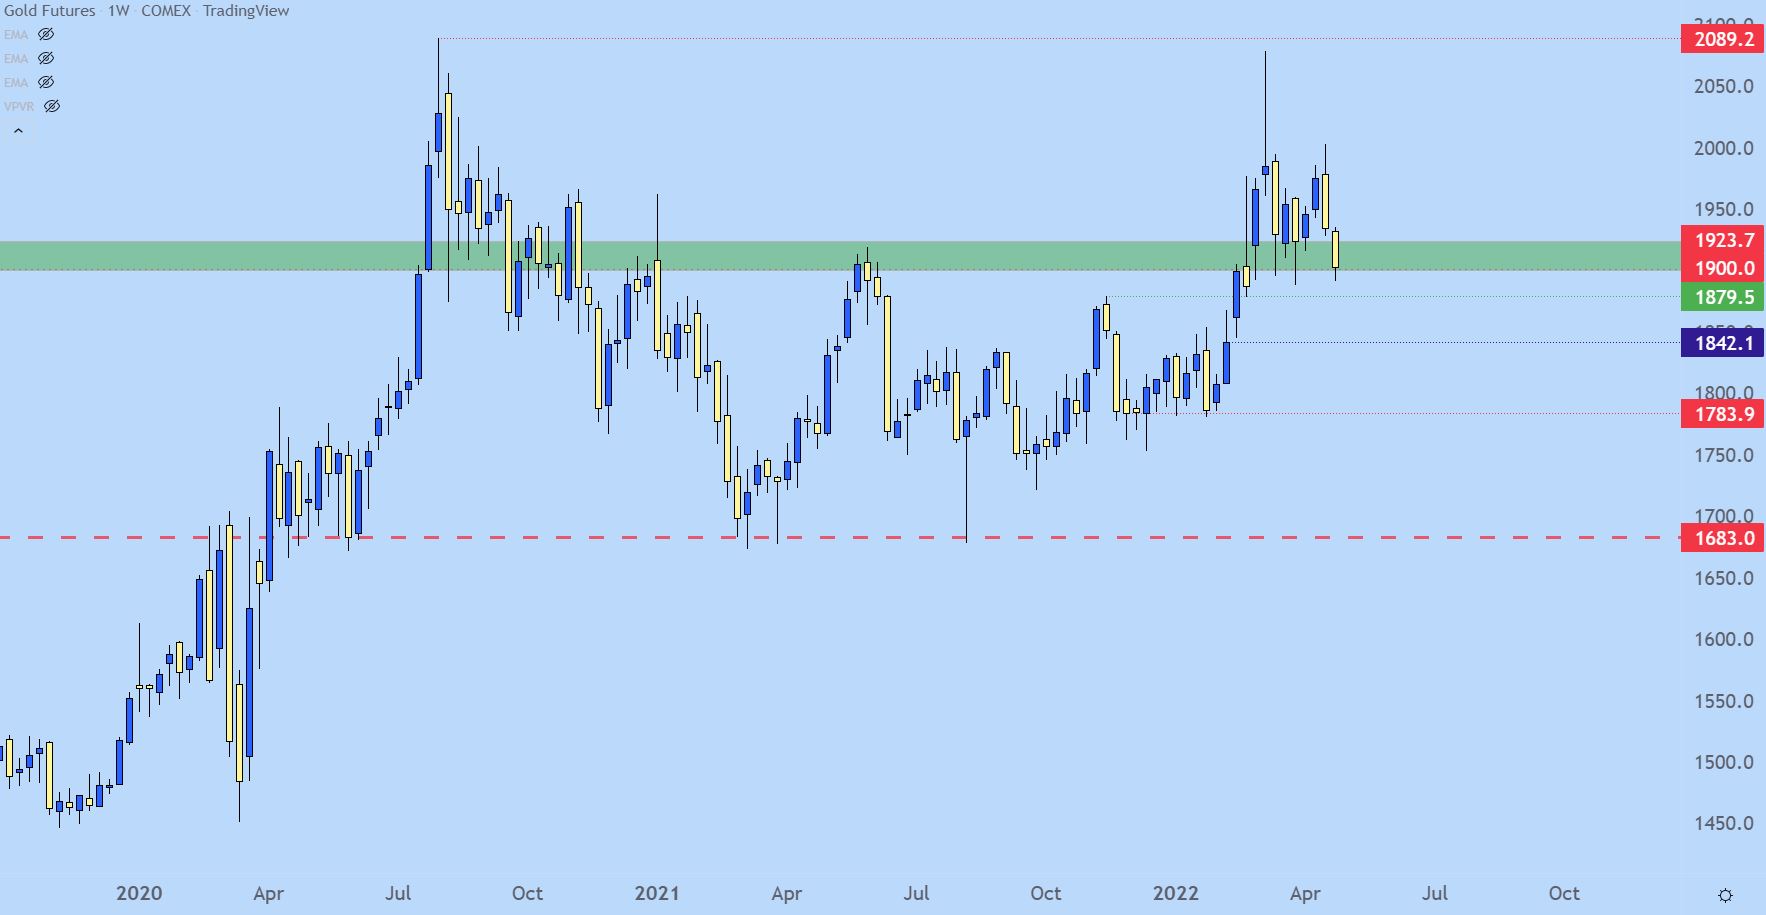
Chart prepared by James Stanley; Gold on Tradingview
Gold Shorter-Term
The week has started fast as Gold prices have fallen by as much 2% already after last week’s candle closed as a bearish engulf; and as of this writing the US equity market hasn’t even opened for business yet. So this could be a difficult move to chase lower, but there is scope for bearish continuation as taken from the four-hour chart.
As taken from prior support structure, there’s a swing at 1918 that remains attractive for lower-high resistance potential. For those that are very aggressive, there’s another spot that’s close around 1908, which hasn’t been as consistent as support in the past although this did remain an important pivot around candles that had previously tested below the 1900 level. That can be looked at as an ‘r1’ for bearish scenarios.
And for traders that don’t want to look for a pullback, breakout logic also exists, targeting deeper support around 1879. To learn more about approaching and working with breakouts, the guide below will offer additional information on that market condition.
Gold Four-Hour Price Chart
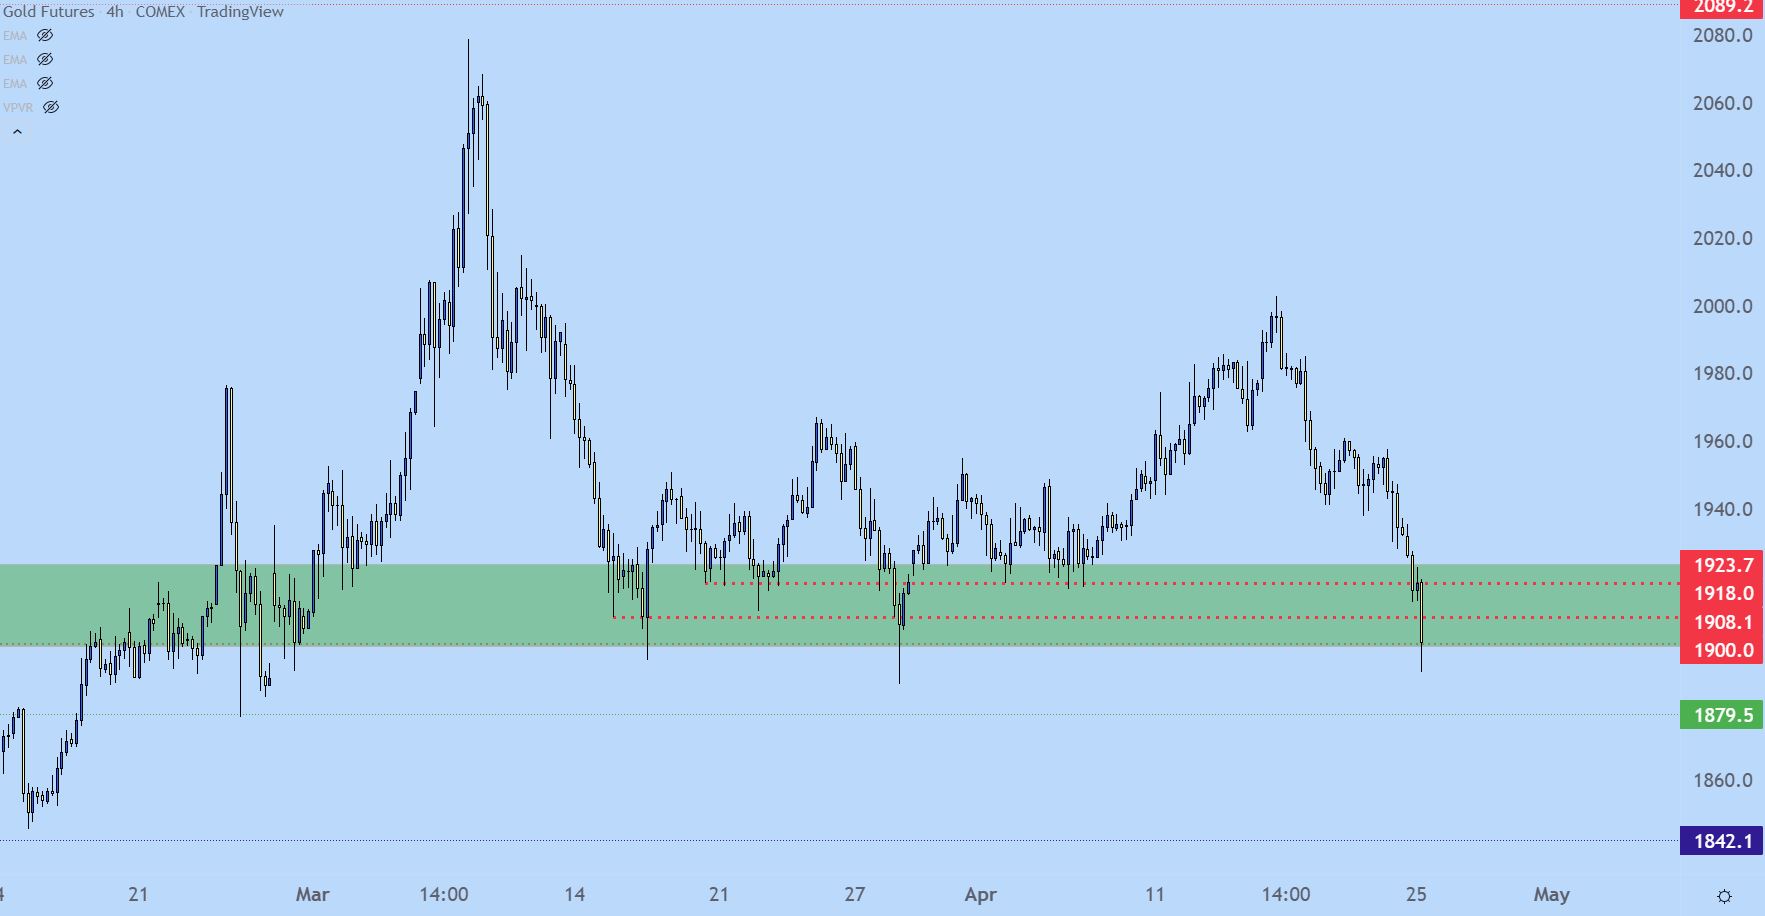
Chart prepared by James Stanley; Gold on Tradingview
— Written by James Stanley, Senior Strategist for DailyFX.com
Contact and follow James on Twitter: @JStanleyFX
Be the first to comment