

Gold, Silver, XAG/USD, XAU/USD, US 30-Year Treasuries – Talking Points:
- Stagnating long-term Treasury yields could open the door for anti-fiat precious metals to gain ground in the coming weeks.
- Long-term technicals continue to remain constructive for both gold and silver.
Discover what kind of forex trader you are
Anti-fiat gold and silver prices have clawed back lost ground in the month of April, after a tumultuous sell-off in longer-term US Treasuries drastically undermined the precious metals market earlier in the year. There was an expectation that inflation data would drive yields even higher in the near term and in turn intensify the downward pressure on gold and silver, as base effects come into play.
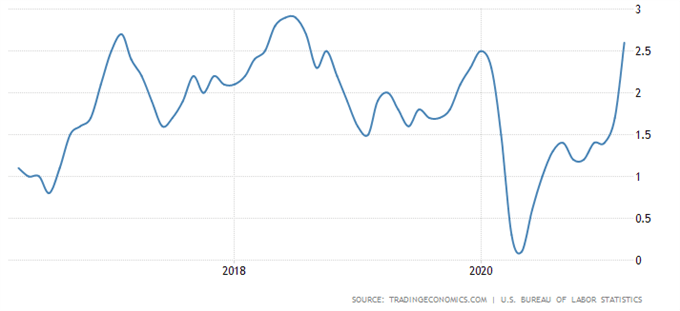
However, this didn’t eventuate, despite a larger-than-expected rise in consumer price inflation in March. Clearly market participants had priced in a more aggressive print, with Treasuries catching a bid immediately after the release. Strong demand for longer-term maturities at the 30-year auction also drove yields lower, with the bid-to-cover ratio – a measure of demand – coming in well above the historical average.
US Inflation Rate (2016 – Present)
A continuation of this dynamic could open the door for precious metals to gain ground in the coming weeks. Indeed, the prospect of a smaller-than-expected fiscal stimulus package could put the duration trade back in vogue. President Biden hinted that he could favour a smaller package in a recent sit-down with a bipartisan group of policymakers.
Looking ahead, retail sales figures will be intently scrutinized by market participants, to determine if stimulus cheques are indeed being spent or saved. A marked rise in spending could trigger further losses for precious metals on a short-term basis, however, it is likely that this could prove to be a buy the rumour, sell the news event. In that case, gold and silver could be poised to extend recent gains.
US 30-Year Treasury Yields Daily Chart – Descending Triangle in Play
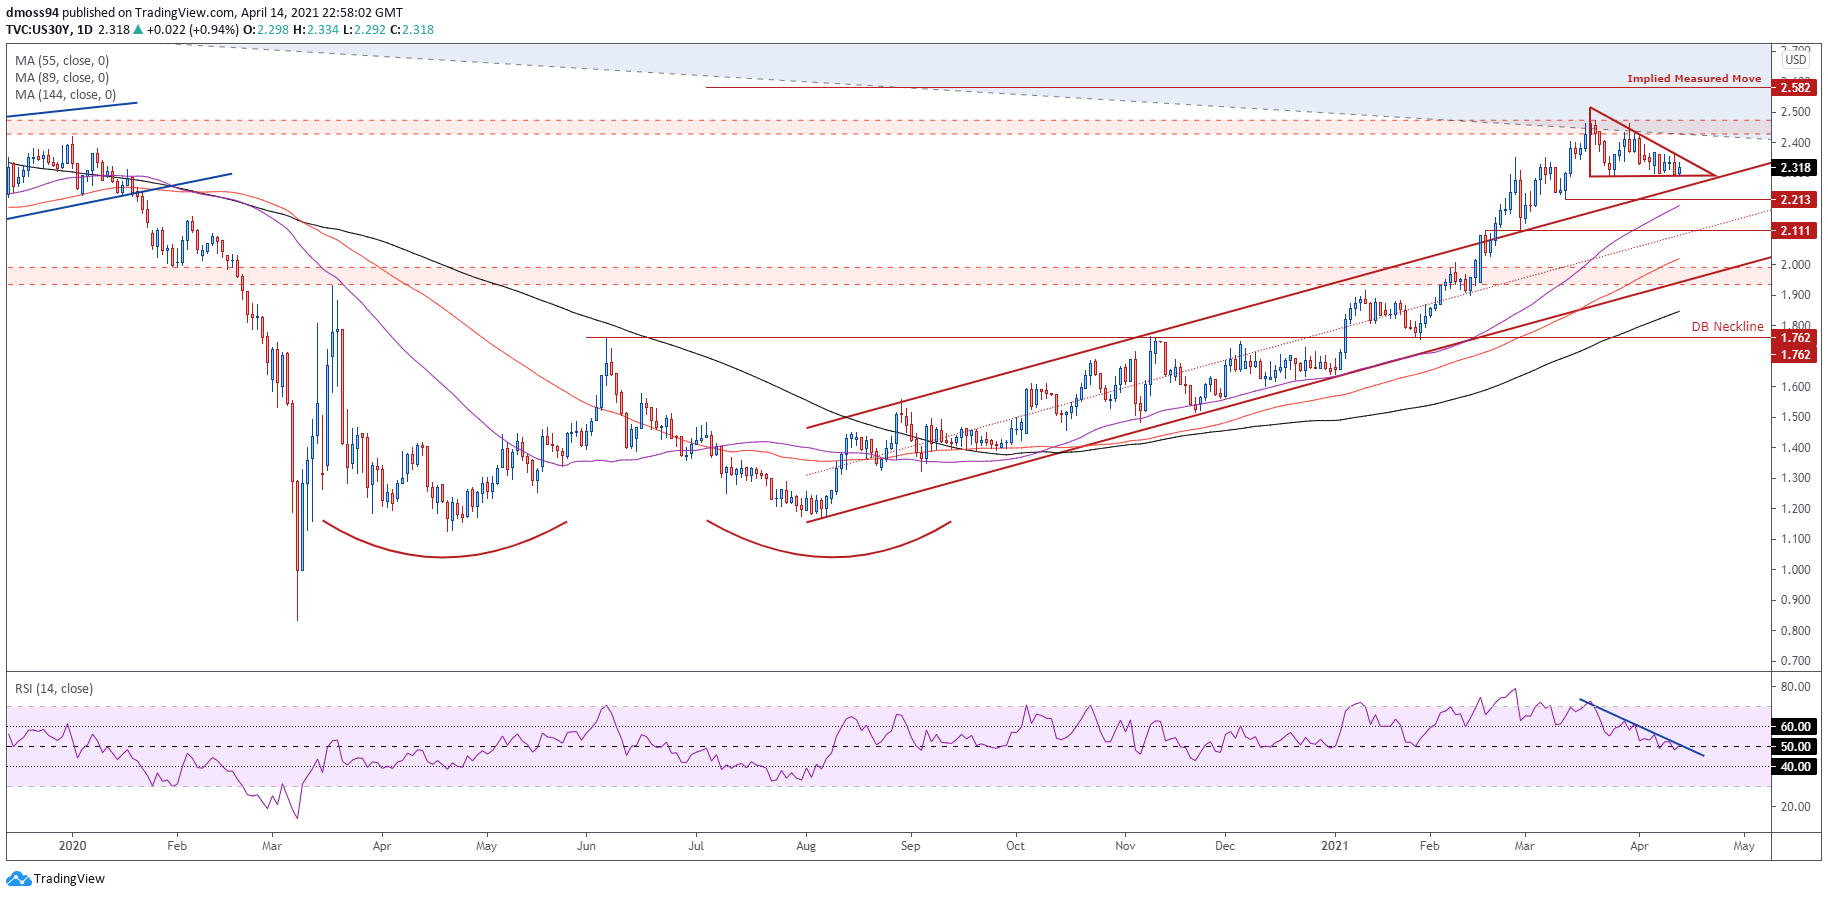
Chart prepared by Daniel Moss, created with Tradingview
From a technical perspective, US 30-year Treasury yields seem poised to continue moving lower, after failing to fulfil the Double Bottom’s – carved out in August last year – implied measured move (2.58).
With rates carving out a Descending Triangle, and the RSI sliding to its lowest levels in 2021, that path of least resistance appears skewed to the downside.
Breaching triangle support probably precipitates a downside move to challenge confluent support at the March 11 low (2.21) and trend-defining 55-EMA, with the neutral pattern’s implied measured move suggesting a pullback to 2.06% could be on the cards.
This scenario would be inherently bullish for anti-fiat assets. However, a convincing break above the triangle hypotenuse likely paves the way for a move to retest the yearly high (2.52) and ultimately leads to further downside for gold and silver.
Gold Price Weekly Chart – MACD Development Hints at Bullish Upturn
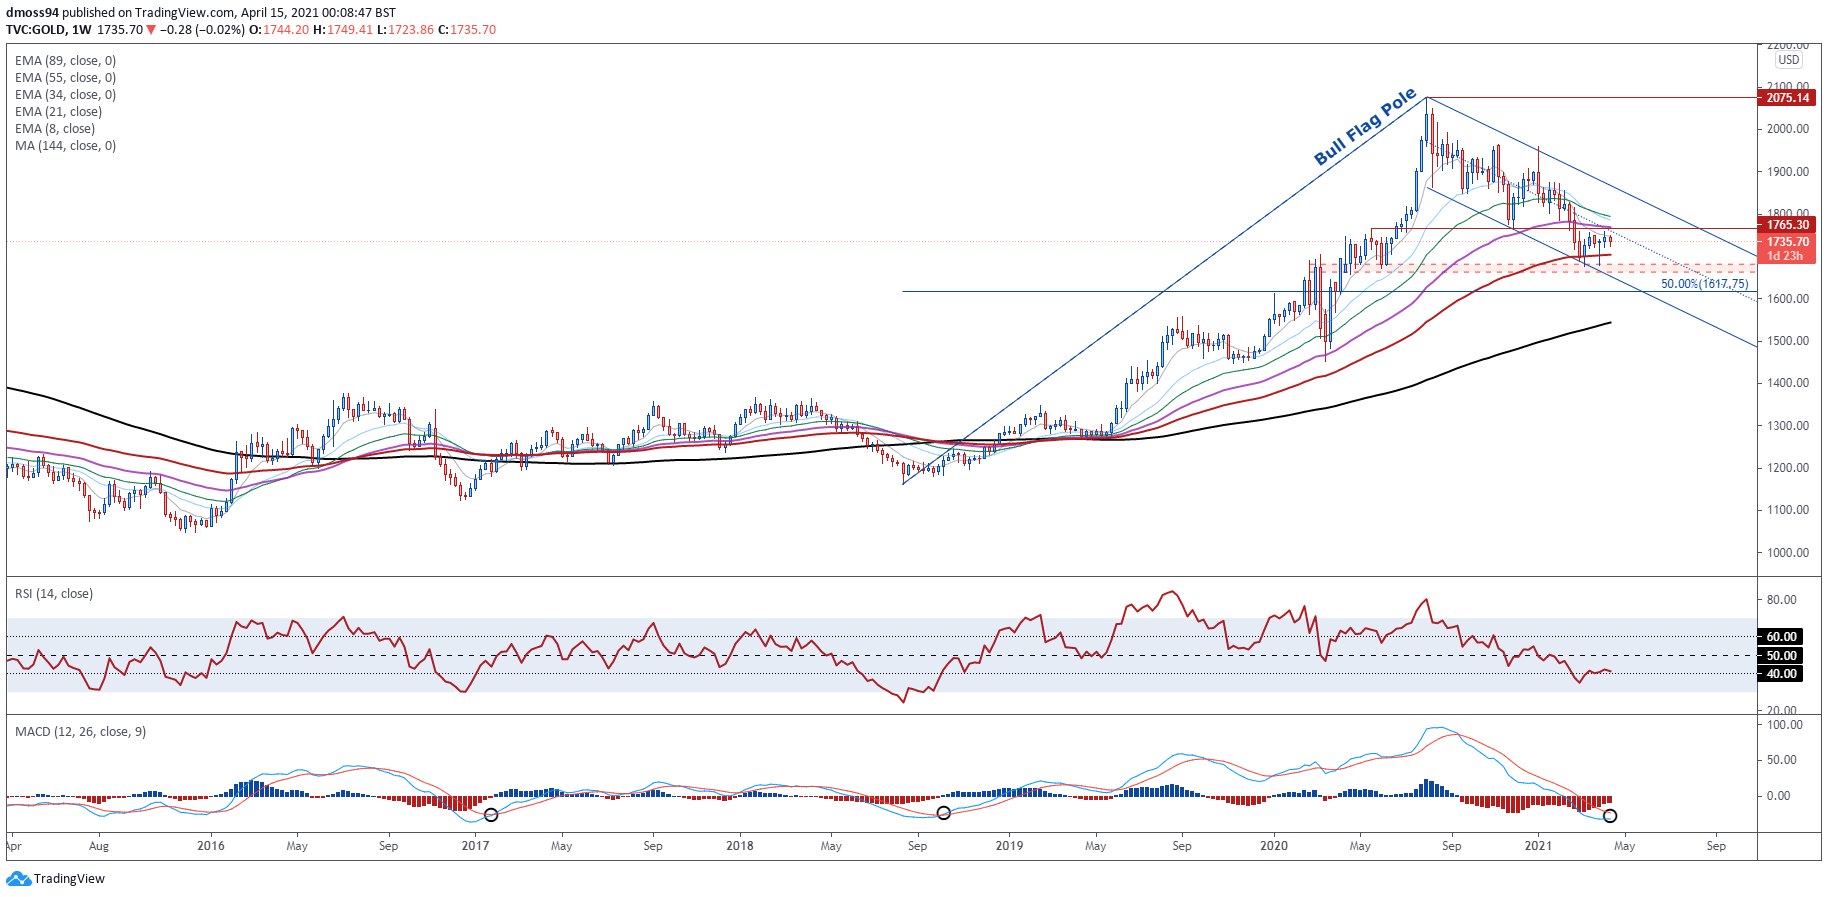
Chart prepared by Daniel Moss, created with Tradingview
The long-term technical outlook for gold remains bullish, as prices continue to carve out a Bull Flag continuation pattern and remain constructively positioned above key psychological support at 1700.
An impending bullish crossover on the MACD indicator also hints that a bullish upturn is afoot, given the two previous crossovers in January 2017 and October 2018 led to significant surges higher.
Ultimately, a weekly close above the 55-EMA (1769) is needed to validate bullish potential and bring Descending Channel resistance and the 1850 handle into focus. Clearing that probably signals the resumption of the primary uptrend and propels price back towards the 2020 high (2075).
However, should price fail to clear the 55-EMA, a retest of the yearly low (1678) certainly can’t be ruled out.
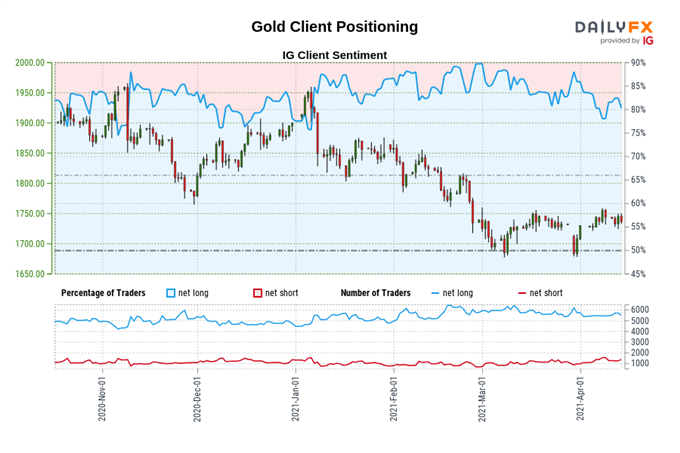
The IG Client Sentiment Report shows 82.35% of traders are net-long with the ratio of traders long to short at 4.67 to 1. The number of traders net-long is 3.00% higher than yesterday and 3.68% higher from last week, while the number of traders net-short is 8.37% lower than yesterday and 12.40% lower from last week.
We typically take a contrarian view to crowd sentiment, and the fact traders are net-long suggests Gold prices may continue to fall.
Traders are further net-long than yesterday and last week, and the combination of current sentiment and recent changes gives us a stronger Gold-bearish contrarian trading bias.
Silver Weekly Chart – Range Bound with Bullish Bias
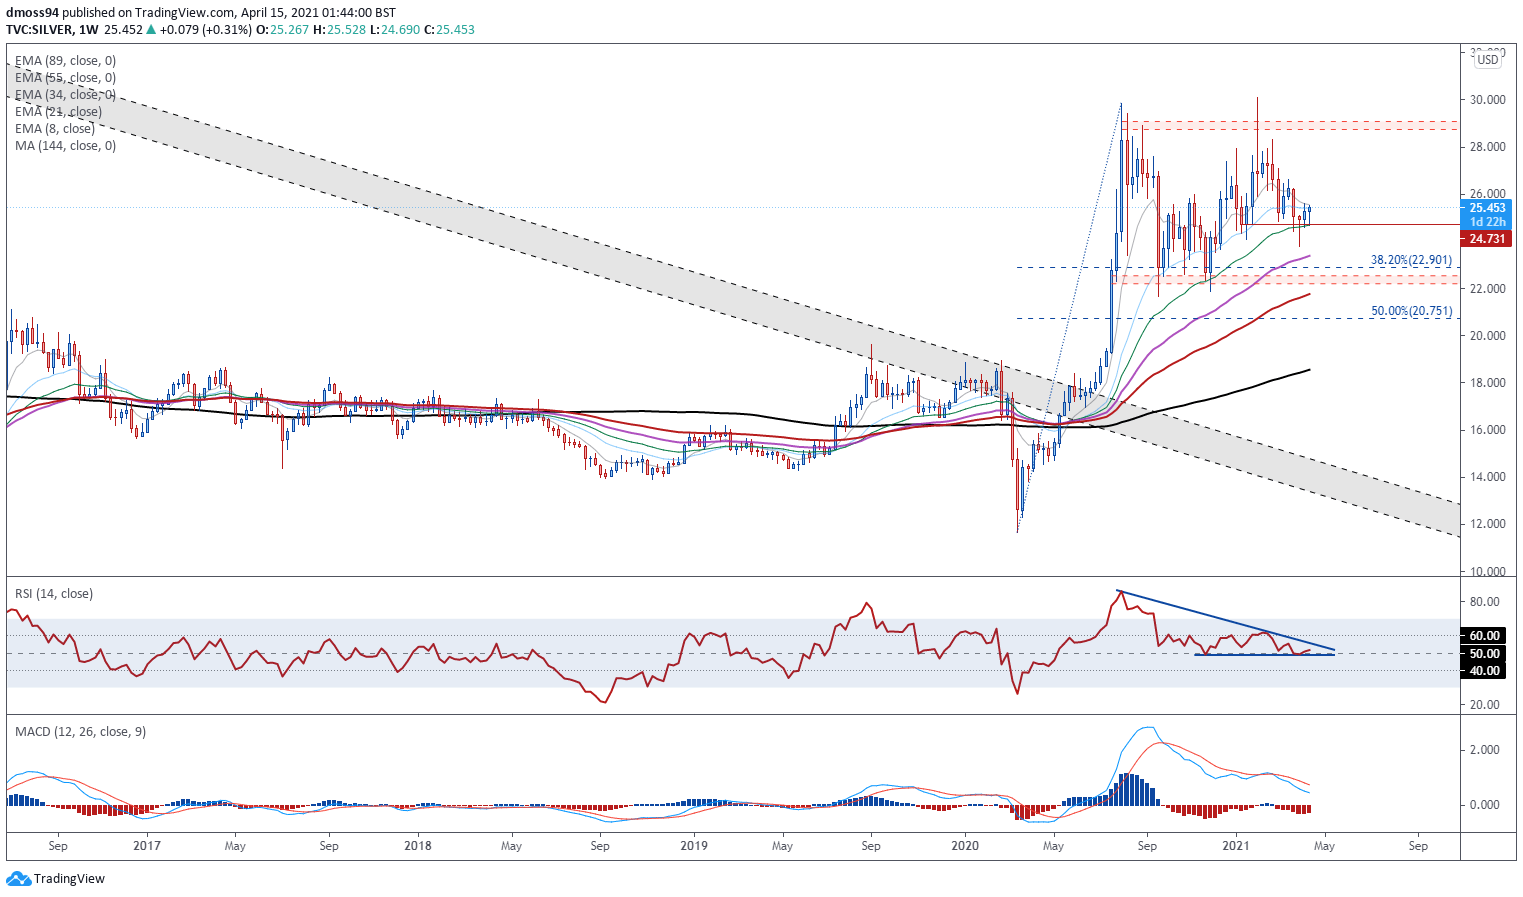
Chart prepared by Daniel Moss, created with Tradingview
Silver’s longer-term price action also appears fairly constructive, as prices continue to hold constructively above both the 38.2% and 50% Fibonacci retracements of the surge from the March nadir to the August 2020 high (29.86).
The development of the RSI and MACD is also in favour of bulls, as both oscillators track firmly above their respective neutral midpoints.
A weekly close above the 8-EMA (22.55) probably ignites an impulsive push to challenge range resistance at 28.75 – 29.10. Clearing that brings the psychologically imposing 30 mark into the crosshairs.
On the other hand, slicing through the 34-EMA (24.69) could trigger a more extended pullback to the 38.2% Fibonacci (22.90).
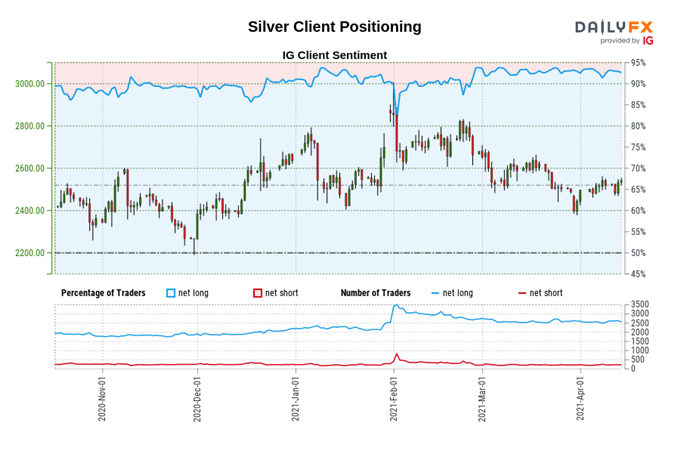
The IG Client Sentiment Report shows 92.11% of traders are net-long with the ratio of traders long to short at 11.68 to 1. The number of traders net-long is 0.99% higher than yesterday and 2.90% higher from last week, while the number of traders net-short is 4.29% higher than yesterday and 7.59% lower from last week.
We typically take a contrarian view to crowd sentiment, and the fact traders are net-long suggests Silver prices may continue to fall.
Positioning is less net-long than yesterday but more net-long from last week. The combination of current sentiment and recent changes gives us a further mixed Silver trading bias.
— Written by Daniel Moss, Analyst for DailyFX
Follow me on Twitter @DanielGMoss

Recommended by Daniel Moss
Top Trading Lessons
Be the first to comment