

stockage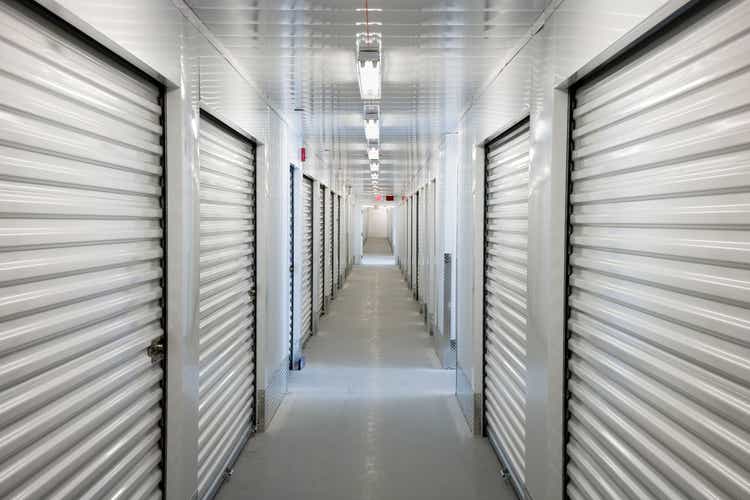
Global Self Storage (NASDAQ:SELF) is a small publicly traded self-storage real estate investment trust (“REIT”) with a market cap of just +$57M. Similar peers, such as National Storage Affiliates (NSA) and Life Storage, Inc (LSI), in contrast, have caps many multiples higher than SELF.
Seeking Alpha – Market Cap Of SELF Compared To Competitors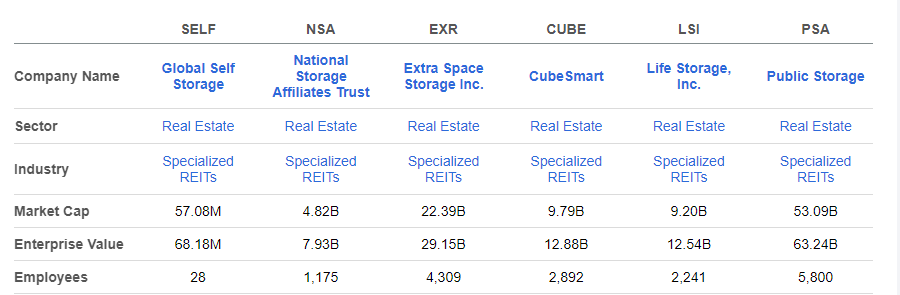
The company’s total portfolio also includes just 13 properties located in secondary or tertiary cities. These properties primarily consist of traditional drive-up storage facilities, as well as those that are climate controlled. In addition, the company has a few outdoor storage facilities for boats/cars/RVs.
November 2022 Investor Presentation – Map Of Geographic Operating Locations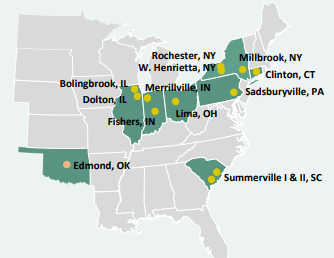
Despite its small scale, SELF performs competitively to their peers. In addition, their business strategy consists of targeting markets outside of the top 25 metropolitan statistical areas (“MSAs”), or, in other words, the markets that have experienced the most investor interest in recent years.
Their focus outside of these markets, then, limits competition from larger competitors and provides greater upside opportunity due to the lower supply growth in these regions.
While shares do have embedded upside, it’s unlikely investors will realize the gains in the near-medium term. Given its size, the company would make for a viable acquisition target, considering current industry fragmentation. But overall market conditions in the present environment would pose significant price discovery challenges on any M&A prospects.
While best viewed from the sidelines for prospective investors, the company does make for a low-risk hold with a solid dividend payout and attractive upside for all existing shareholders.
Recent Performance
In Q3, SELF reported another quarter of record growth in both funds from operations (“FFO”) and adjusted FFO, with the two increasing 45.7% and 42% YOY, respectively. YTD, the two operating metrics are now up 46.4% and 44.9%, respectively.
The YTD strength builds atop their 2021 growth rates, which were near 60%, handily outperforming their peer set.
November 2022 Investor Presentation – Full Year 2021 FFO/AFFO Growth Reported By SELF Compared To Peers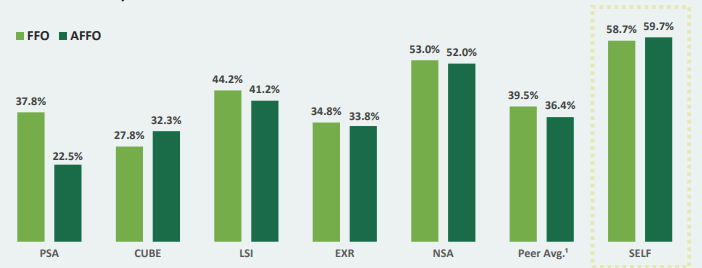
At the end of the third quarter, the company’s total portfolio consisted of just 13 self-storage properties, 12 of which were company-owned and included within the same-store population, while one property was third-party owned but managed by SELF.
In the same-store subset, the company reported net operating income (“NOI”) growth of 16% during the quarter. Though lower than some of their larger peers, it is still competitive, especially considering the size of their operations.
November 2022 Investor Presentation – Operating Performance Of SELF Compared To Peers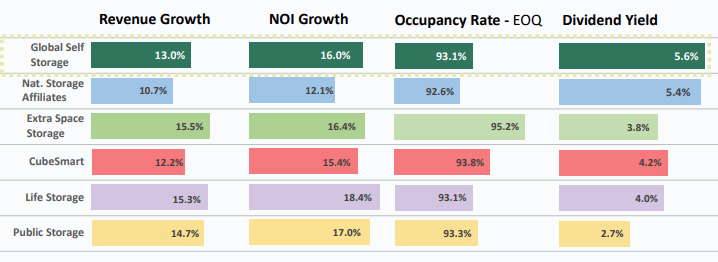
Same-store occupancy levels did dip below 90% at the end of the quarter due to the company’s push on rental rates. And though it rebounded in November, it is still lower than their peers, who are mostly between 93-95%.
Nevertheless, the emphasis on rate growth did ultimately translate to a 13% increase in quarterly same-store revenues, which is generally in range with the sector. And in fact, better, when compared against NSA and CubeSmart (CUBE), who reported growth rates of 10.7% and 12.2%, respectively.
Margins, however, are weaker than their peers, though this is due to their lack of meaningful scale.
Seeking Alpha – Profitability Metrics Of SELF Compared To Peers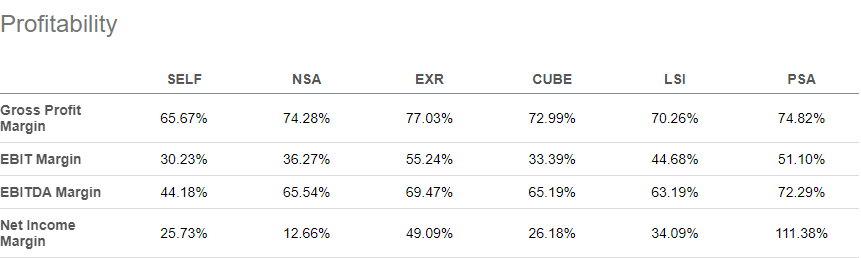
Looking ahead, opportunities for improvement exist via further occupancy gains. This will offset the probable decline in rate growth through 2023. Furthermore, the company can expand their portfolio through external acquisitions. With current resources in hand, SELF should be well-positioned to capitalize on any attractive targets that may arise in the marketplace.
Liquidity And Debt Profile
Given the size of the company’s operations, their balance sheet is expectedly quite simple.
SELF reported total liquidity of +$24.1M at the end of Q3FY22, comprised of cash and restricted cash of +$6.5M, +$2.6M in marketable securities, and +$15M available under their revolving credit facilities.
In addition, the company has an “at market” agreement to sell up to +$15M in common stock at their discretion. To date, SELF has raised +$2.2M through the program.
SELF also generates ample cash flows to fund their operating needs. Through nine months of the year, the company generated +$3.8M in operating cash flows. And after accounting for dividend payments and their investing activities, retained cash amounted to +$1.5M.
All considered, the company has sufficient liquidity and cash generation potential to cover their existing debt servicing obligations on their note payable, which had a total principal balance at quarter end of +$17.9M, 85% of which is due in 2027 or later. And on a net debt basis, that is just over 2x trailing twelve months (“TTM”) EBITDA.
Q3FY22 Form 10-Q – Summary Of Upcoming Principal Payments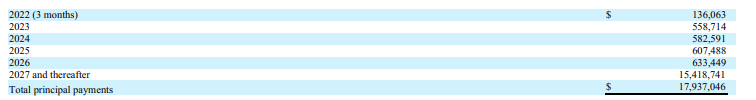
A limited debt load paired with their sizeable liquidity position, thus, provides a high degree of confidence of their long-term solvency.
Dividend Safety
SELF recently increased their quarterly dividend by 11.5% from $.065 to $.0725. This represents an annualized yield of about 5.6% at current pricing, in-line with the current yield offered by NSA but higher than their other peers.
Seeking Alpha – Current Dividend Yield Of SELF Compared To Peers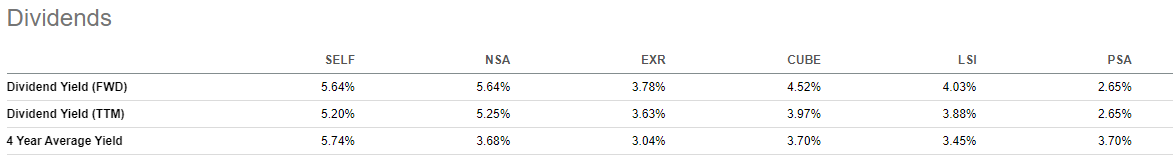
The company is generating +$1.5M of retained cash flow after dividends and investing activity. In addition, the payout represents about 56% of AFFO, which outperforms the sector median of 72%.
Looking ahead, SELF does have the capacity for further increases. Supposing the quarterly dividend were to be hypothetically increased 29% to $.0935/share, the payout ratio would increase to 72%, assuming no further growth in AFFO.
That would be in-line with the current sector average. In addition, based on annualized operating cash flow of +$5.1M, the company would still have approximately +$1.0M of retained operating cash after paying out annual dividends of +$4.1M.
While there have been no indications of any future hikes in the payout, the company certainly has the capacity to do so if they so desire.
Takeaway
SELF is a small self-storage REIT with a portfolio of just 13 properties. While its small scale is a disadvantage against its significantly larger peer set, the company has performed competitively.
For the full 2021 fiscal year, the company reported nearly 60% growth in both FFO and AFFO. This surpassed the growth rate reported by all their peers. And through nine months of the year, SELF is still reporting record growth in these two metrics.
Occupancy ticked lower in the current period due to a push on rental rates, but total same-store revenue growth still came in higher than two of their publicly traded competitors.
In addition, SELF is generating healthy operating cash flows that are more than sufficient to cover their current dividend payment, even after the recently enacted 11.5% hike in the quarterly payout.
The strong cash flows are, in turn, adding to their already sizeable liquidity position of +$24.1M, which may seem low at first glance, but in actuality is significant, considering its about 40% of their total market cap.
Stacked against their debt load, which consists simply of a note payable with an extended maturity, the company has ample funds to deploy to opportunistic acquisitions or to other internal growth opportunities.
At present, the company trades at 12.2x forward FFO. Given its scale, this is fair. The use of a dividend discount model, however, using a CAPM-derived cost of equity of about 6% based on a risk premium of 5.5% and an assumed 4.5% risk-free rate, in addition to a long-term dividend growth rate of 2%, yields an expected target price of $7.25.
While this would represent 40% upside, it’s unlikely the company would realize this in the near-medium term. Though revenues are up, it’s due primarily to rate growth, which is likely to slow in the periods ahead. In addition, occupancy levels are currently lower than peers.
Nevertheless, management is bullish, as evidenced by recent insider activity.
Benzinga – SELF Recent Insider Activity
Given the fragmentation in the industry, the company would also make for a viable acquisition target. For existing shareholders, SELF is one to keep on hold for the long-term. New investors, too, may also benefit from new positioning, though the gains may not materialize as readily as some would expect.
Be the first to comment