

Key Talking Points:
- UK PM is expected to announce a delay to the country’s reopening plans
- UK CPI data to grab investor attention later this week
- GBP/USD keeps within its range despite testing its lower boundary
The UK is a week away from its scheduled reopening but it is expected that the Prime Minister will announce today that the date will be delayed by up to 4 weeks, with focus on easing the pressure on hospitals after another surge of cases related to the Indian (Delta) variant. The UK is expecting to have vaccinated all adults by the end of July and allowing for more immunization is thought to be one of the main reasons for delaying the reopening date.
The Pound has been holding up pretty well despite the increased likelihood of a delay, given it was likely already discounted leading up to this week. GBP/USD remains confined to its one-month range as bulls hold on to support just below the 1.41 mark.
Traders are likely to focus on the large amount of economic data coming out of the UK this week, with special attention to the inflation data released on Wednesday. After strong readings in the US and China, expectations are for a 1.8% increase in consumer prices over the last year, which would bring inflation close to the Bank of England’s 2% target.
A stronger reading will likely be supportive of the Pound as investors become more convinced that the central bank will start to act sooner rather than later as economic recovery gets underway. The BoE’s Chief Economist Haldane was top news last week when he made hawkish comments about the UK’s economic recovery and inflation expectations, leading to believe that the MPC could start announcing policy changes as soon as their next meeting on August 4th.
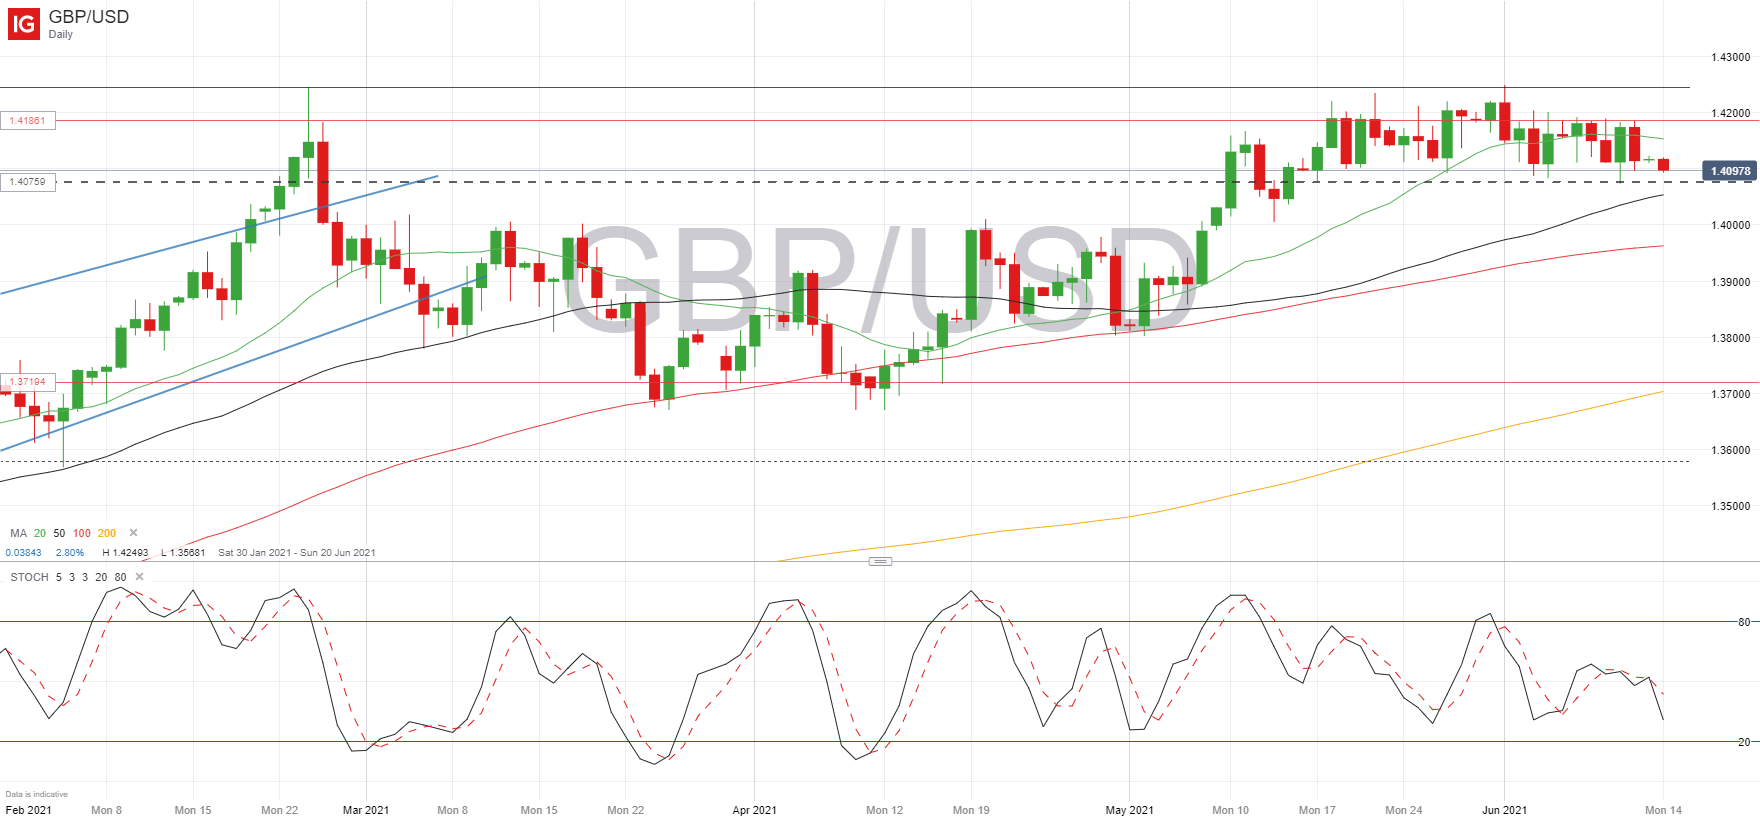
GBP/USD Daily chart
Despite an attempted break lower on Friday, downward momentum in GBP/USD has not improved much, but there is scope for the pair to attempt a new break below the lower bound of its current range at 1.4075. If we break below this level then there is pretty much a clear path towards 1.40. Alternatively, if bullish momentum increases then immediate resistance may be found at 1.4186, followed by the horizontal 1.42 line before testing the upper bound of the range at 1.4245.
Learn more about the stock market basics here or download our free trading guides.
— Written by Daniela Sabin Hathorn, Market Analyst
Follow Daniela on Twitter @HathornSabin
Be the first to comment