

GBP/USD started a downside correction below 1.2250. USD/CAD is rising and might gain pace above the 1.3700 resistance zone.
Important Takeaways for GBP/USD and USD/CAD
· The British Pound was able to move above the 1.2200 and 1.2250 resistance levels.
· There is a key bullish trend line forming with support near 1.2220 on the hourly chart of GBP/USD.
· USD/CAD climbed higher above the 1.3600 and 1.3620 resistance levels.
· It cleared a major bearish trend line with resistance near 1.3660 on the hourly chart.
GBP/USD Technical Analysis
After forming a base above the 1.2100, the British Pound started a steady increase against the US Dollar. GBP/USD gained pace for a move above the 1.2150 and 1.2200 resistance levels.
There was a move above the 1.2250 resistance and the 50 hourly simple moving average. The pair even moved above the 1.2300 level and traded as high as 1.2322 on FXOpen. It is now correcting gains and trading below the 1.2300 level.
Recently, there was a move below the 1.2280 and 1.2250 support levels. The pair declined below the 38.2% Fib retracement level of the upward move from the 1.2105 swing low to 1.2322 high.
It is now trading below the 1.2240 level and the 50 hourly simple moving average. On the downside, an initial support is near the 1.2220 area. It is near the 50% Fib retracement level of the upward move from the 1.2105 swing low to 1.2322 high.
There is also a key bullish trend line forming with support near 1.2220 on the hourly chart of GBP/USD. The next major support is near the 1.2190 level. If there is a break below 1.2190, the pair could extend its decline. The next key support is near the 1.2120 level. Any more losses might call for a test of the 1.2100 support.
An immediate resistance is near the 1.2250 level. The next resistance is near the 1.2280 level. The main resistance is near the 1.2325 level. If there is an upside break above the 1.2325 zone, the pair could rise towards 1.2400. The next key resistance could be 1.2500.
USD/CAD Technical Analysis
The US Dollar started a fresh decline from well above the 1.3700 zone against the Canadian Dollar. USD/CAD declined below the 1.3650 and 1.3620 levels.
It even spiked below the 1.3600 level and traded as low as 1.3560. Recently, it started a fresh increase above the 1.3600 level. The pair climbed above the 1.3620 level and the 50 hourly simple moving average.
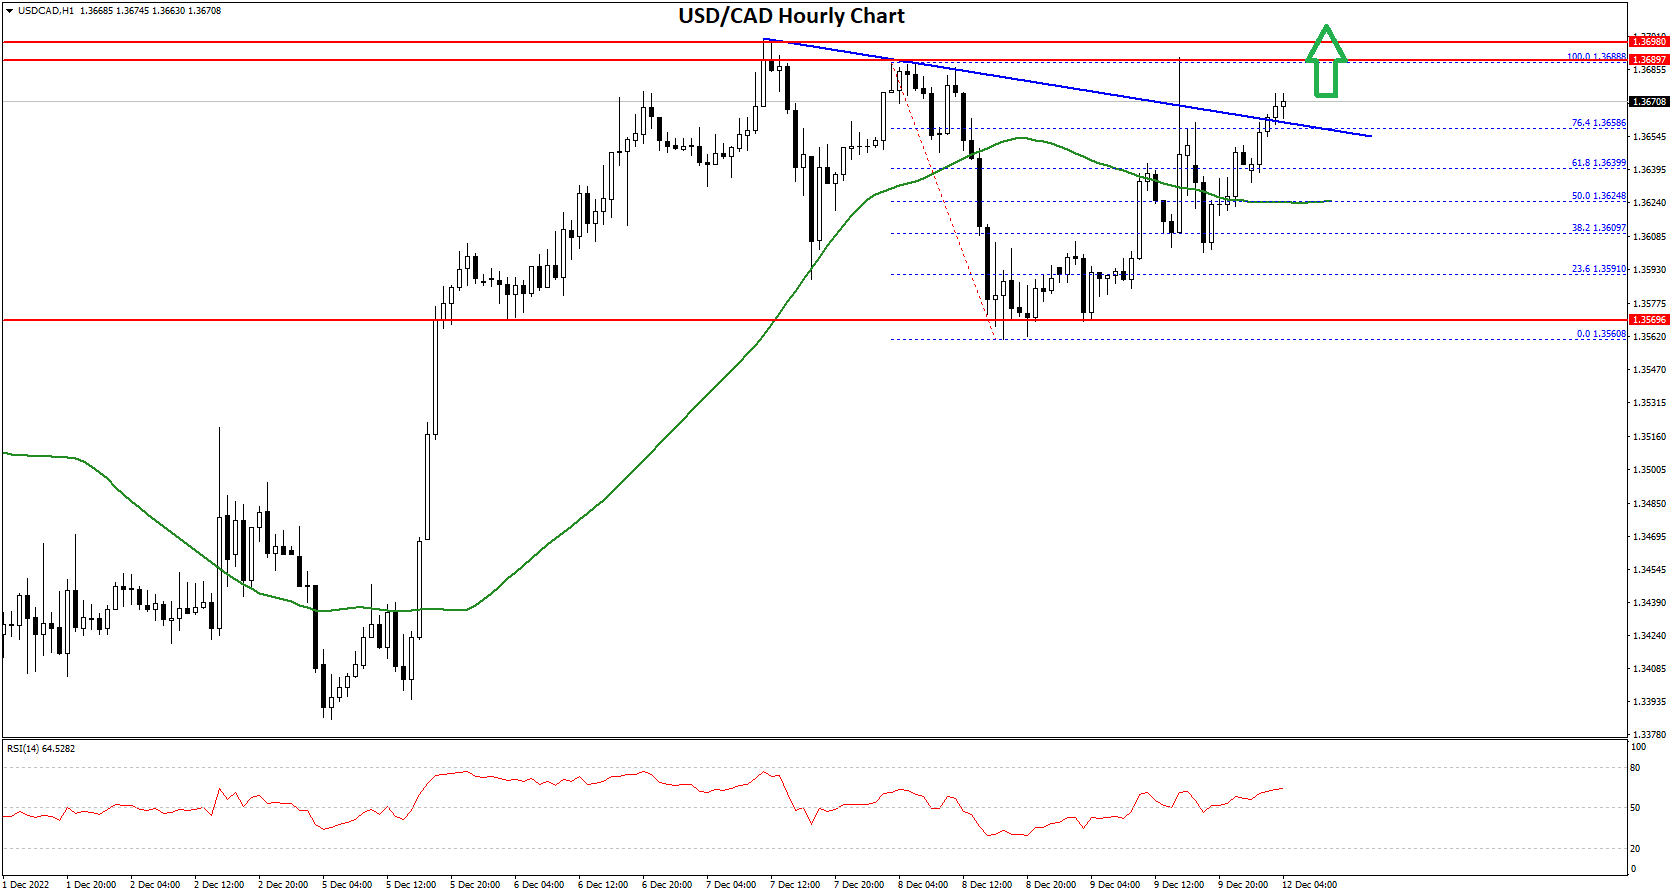
There was a move above the 50% Fib retracement level of the downward move from the 1.3688 swing high to 1.3560 low. Besides, it cleared a major bearish trend line with resistance near 1.3660 on the hourly chart.
The pair is trading above the 76.4% Fib retracement level of the downward move from the 1.3688 swing high to 1.3560 low. It is now facing resistance near the 1.3680 zone.
The next major resistance is near the 1.3700 level. A clear break above the 1.3700 level could open the doors for more gains. The next major resistance is near the 1.3750 level, above which USD/CAD could rise steadily towards the main 1.3800 resistance zone.
An immediate support is near the 1.3640 level. The first major support is near the 1.3625 level. Any more losses may possibly open the doors for a drop towards the 1.3560 support zone in the near term.
This forecast represents FXOpen Companies opinion only, it should not be construed as an offer, invitation or recommendation in respect to FXOpen Companies products and services or as financial advice.
Trade global forex with the best ECN broker of 2021*.
Choose from 50+ forex markets 24/5.
Open your FXOpen account now or learn more about making your money go further with FXOpen.
* FXOpen International, best ECN broker of 2021, according to the IAFT

Be the first to comment