

GBP/USD started a major increase and traded above 1.2400. USD/CAD is declining and might even trade below the 1.3350 support.
Important Takeaways for GBP/USD and USD/CAD
· The British Pound was able to move above the 1.2300 and 1.2350 resistance levels.
· There was a break above a key contracting triangle with resistance near 1.2380 on the hourly chart of GBP/USD.
· USD/CAD declined below the 1.3450 and 1.3400 support levels.
· It traded below a major bullish trend line with support near 1.3382 on the hourly chart.
GBP/USD Technical Analysis
After forming a base above the 1.2100, the British Pound started a steady increase against the US Dollar. GBP/USD gained pace for a move above the 1.2250 and 1.2300 resistance levels.
There was a move above the 1.2350 resistance and the 50 hourly simple moving average. The pair even moved above the 1.2400 level and traded as high as 1.2447 on FXOpen. During the increase, there was a break above a key contracting triangle with resistance near 1.2380 on the hourly chart of GBP/USD.
It is now correcting gains and trading near the 1.2440 level. However, it is trading well above 1.2350 and the 50 hourly simple moving average.
On the downside, an initial support is near the 1.2240 area. It is near the 23.6% Fib retracement level of the upward move from the 1.2335 swing low to 1.2447 high.
The next major support is near the 1.2400 level or the 50% Fib retracement level of the upward move from the 1.2335 swing low to 1.2447 high. If there is a break below 1.2390, the pair could extend its decline.
The next key support is near the 1.2320 level. Any more losses might call for a test of the 1.2250 support. An immediate resistance is near the 1.2450 level.
The next resistance is near the 1.2500 level. If there is an upside break above the 1.2500 zone, the pair could rise towards 1.2620. The next key resistance could be 1.2750.
USD/CAD Technical Analysis
The US Dollar started a fresh decline from well above the 1.3500 zone against the Canadian Dollar. USD/CAD declined below the 1.3450 and 1.3420 levels.
There was a break below a major bullish trend line with support near 1.3382 on the hourly chart. The pair settled well below the 1.3400 level and the 50 hourly simple moving average. It traded as low as 1.3355 and is currently consolidating losses.
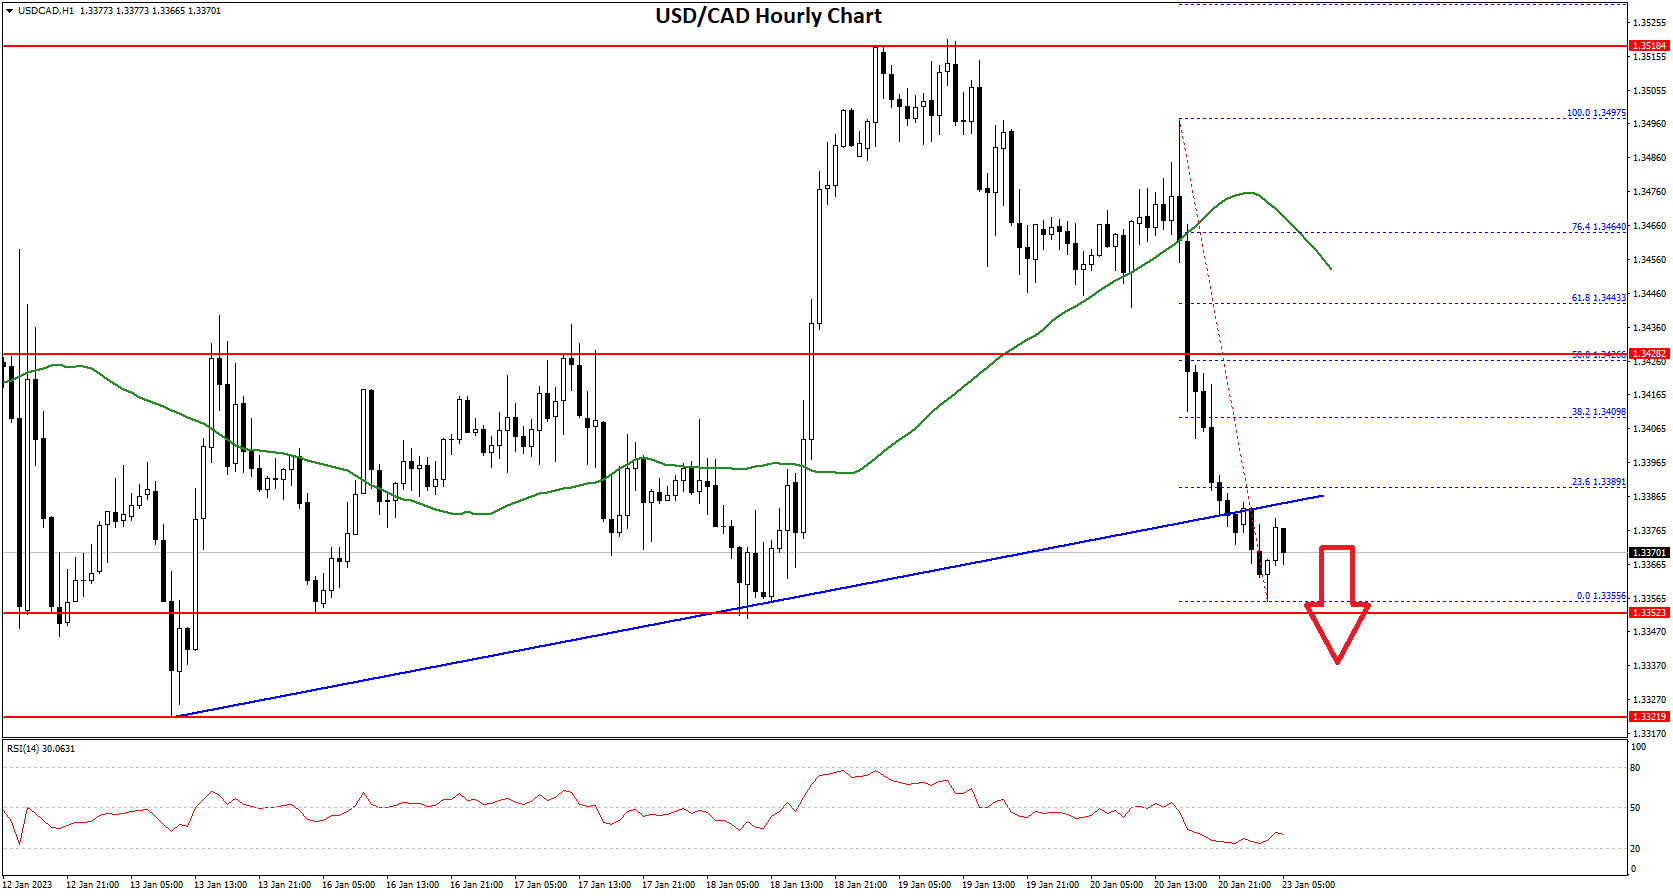
It is trading near the 1.3375 and is well below the 50 hourly simple moving average. An immediate resistance is near the 1.3390 level. It is near the 23.6% Fib retracement level of the downward move from the 1.3497 swing high to 1.3355 low.
The next major resistance is near the 1.3425 level. It coincides the 50% Fib retracement level of the downward move from the 1.3497 swing high to 1.3355 low.
A clear break above the 1.3425 level could open the doors for more gains. The next major resistance is near the 1.3450 level, above which USD/CAD could rise steadily towards the main 1.3500 resistance zone.
An immediate support is near the 1.3350 level. The first major support is near the 1.3320 level. Any more losses may possibly open the doors for a drop towards the 1.3250 support zone in the near term.
This forecast represents FXOpen Companies opinion only, it should not be construed as an offer, invitation or recommendation in respect to FXOpen Companies products and services or as financial advice.
Trade global forex with the best ECN broker of 2021*.
Choose from 50+ forex markets 24/5.
Open your FXOpen account now or learn more about making your money go further with FXOpen.
* FXOpen International, best ECN broker of 2021, according to the IAFT

Be the first to comment