

GBP/USD could gain pace if it clears the 1.2320 resistance zone. USD/CAD is sliding and could extend losses below the 1.2870 level.
Important Takeaways for GBP/USD and USD/CAD
· The British Pound is attempting an upside correction from the 1.2150 support zone.
· There is a key bullish trend line forming with support near 1.2230 on the hourly chart of GBP/USD.
· USD/CAD started a fresh decline from the 1.3020 resistance zone.
· There was a break below a connecting bullish trend line with support near 1.2960 on the hourly chart.
GBP/USD Technical Analysis
After a downside break, the British Pound found support near the 1.2150 zone against the US Dollar. GBP/USD remained well bid above 1.2150 and recently corrected higher.
A low was formed near 1.2169 on FXOpen and the pair climbed above the 1.2200 resistance zone. There was a clear move above the 1.2250 resistance zone and the 50 hourly simple moving average. The pair even spiked above the 1.2300, but faced sellers near 1.2320.
A high is formed near 1.2320 and the pair is now consolidating in a range. There was a test of the 38.2% Fib retracement level of the upward move from the 1.2169 swing low to 1.2320 high.
On the downside, an initial support is near the 1.2260 area. The first major support is near the 1.2240 level. It is near the 50% Fib retracement level of the upward move from the 1.2169 swing low to 1.2320 high.
There is also a key bullish trend line forming with support near 1.2230 on the hourly chart of GBP/USD. If there is a break below 1.2230, the pair could extend its decline. The next key support is near the 1.2180 level. Any more losses might call for a test of the 1.2120 support.
An immediate resistance is near the 1.2300 level. The next key resistance is near the 1.2320 level. If there is an upside break above the 1.2320 zone, the pair could rise towards 1.2400. The next key resistance could be 1.2450, above which the pair could gain strength.
USD/CAD Technical Analysis
The US Dollar started a fresh decline from the 1.3020 zone against the Canadian Dollar. USD/CAD gained pace for a move below the 1.2950 support zone.
There was a break below a connecting bullish trend line with support near 1.2960 on the hourly chart. The pair settled below the 1.2920 level and the 50 hourly simple moving average. A low is formed near 1.2870 and the pair is now consolidating losses.
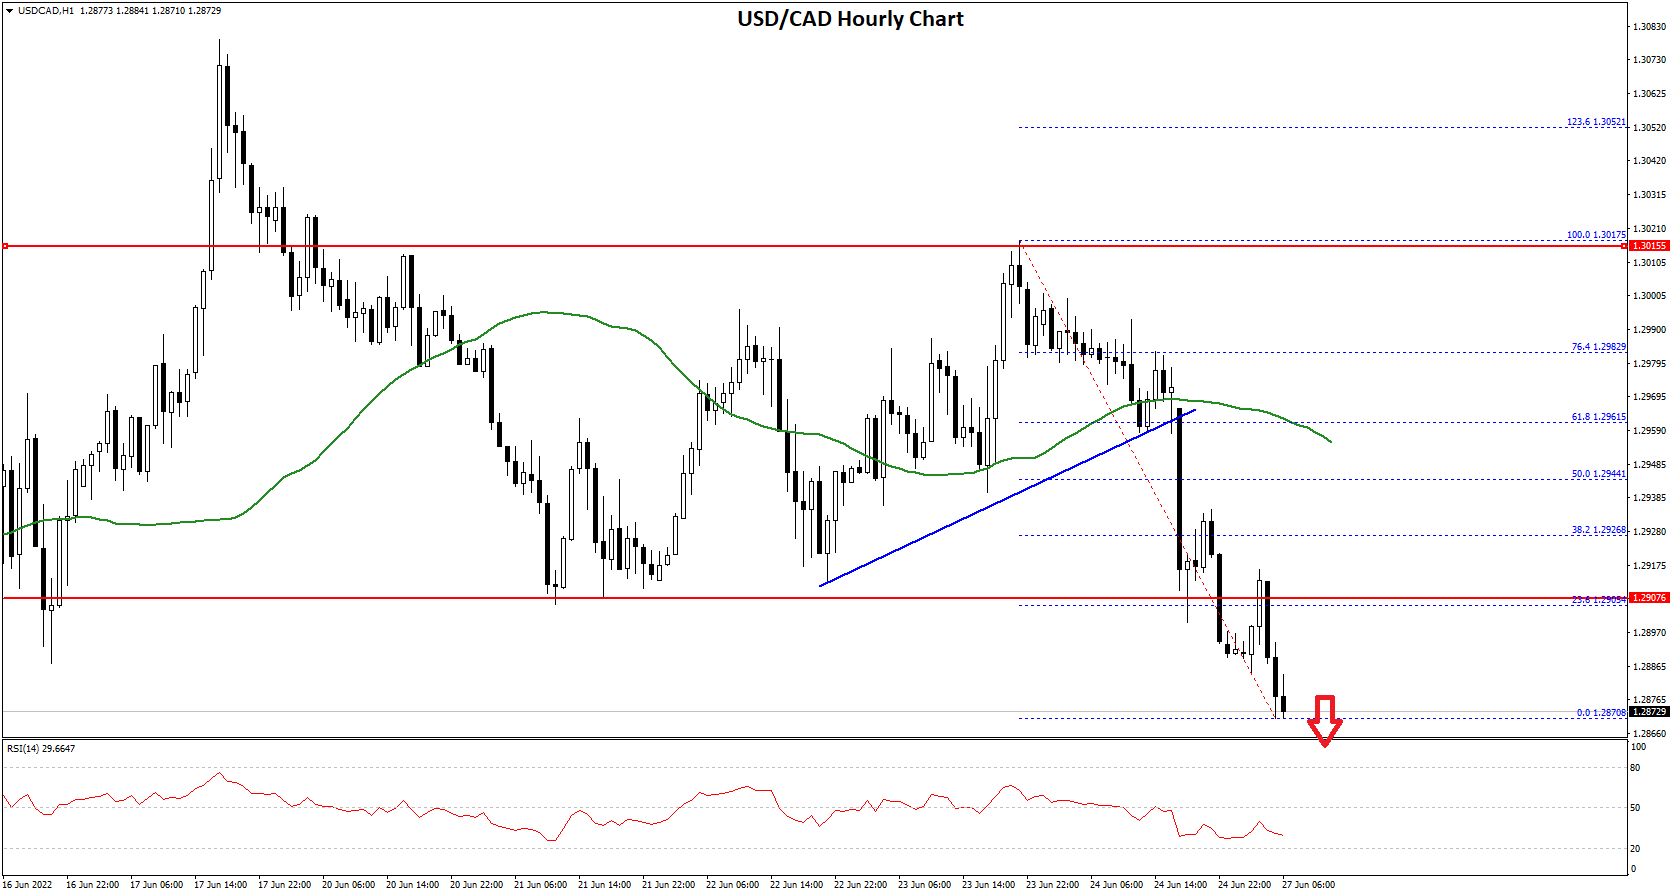
On the upside, the pair is facing resistance near 1.2900 or the 23.6% Fib retracement level of the downward move from the 1.3017 swing high to 1.2870 low.
The next major resistance is near the 1.2940 level or the 50 hourly simple moving average. It is near the 50% Fib retracement level of the downward move from the 1.3017 swing high to 1.2870 low. A clear break above the 1.2940 level could open the doors for more gains. The next major resistance is near the 1.3000 level.
An immediate support is near the 1.2780 level. The first major support is near the 1.2750 level. Any more losses may possibly open the doors for a drop towards the 1.2650 support.
This forecast represents FXOpen Markets Limited opinion only, it should not be construed as an offer, invitation or recommendation in respect to FXOpen Markets Limited products and services or as financial advice.

Be the first to comment