

ImagePixel/iStock via Getty Images
Introduction
The last few years have been painful for the unitholders of GasLog Partners (NYSE:GLOP), who have endured multiple distribution reductions that ultimately saw their quarterly rate falling to a mere $0.01 per unit, thereby only providing a very low sub 1% yield. Even though the Russian-Ukraine war earlier in 2022 created a terrible humanitarian disaster, objectively speaking, it also saw a stronger outlook as Europe scrambles to source their gas outside of Russia, as my previous article discussed. Whilst the impacts are still to be felt, thankfully their continued steady progress now means that higher distributions may only be less than a month away, which creates a very exciting outlook for their long-suffering unitholders.
Executive Summary & Ratings
Since many readers are likely short on time, the table below provides a very brief executive summary and ratings for the primary criteria that were assessed. This Google Document provides a list of all my equivalent ratings as well as more information regarding my rating system. The following section provides a detailed analysis for those readers who are wishing to dig deeper into their situation.
Author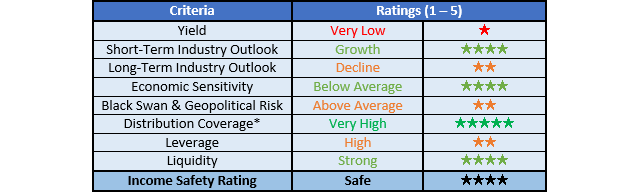
*Instead of simply assessing distribution coverage through distributable cash flow, I prefer to utilize free cash flow since it provides the toughest criteria and also best captures the true impact upon their financial position.
Detailed Analysis
Author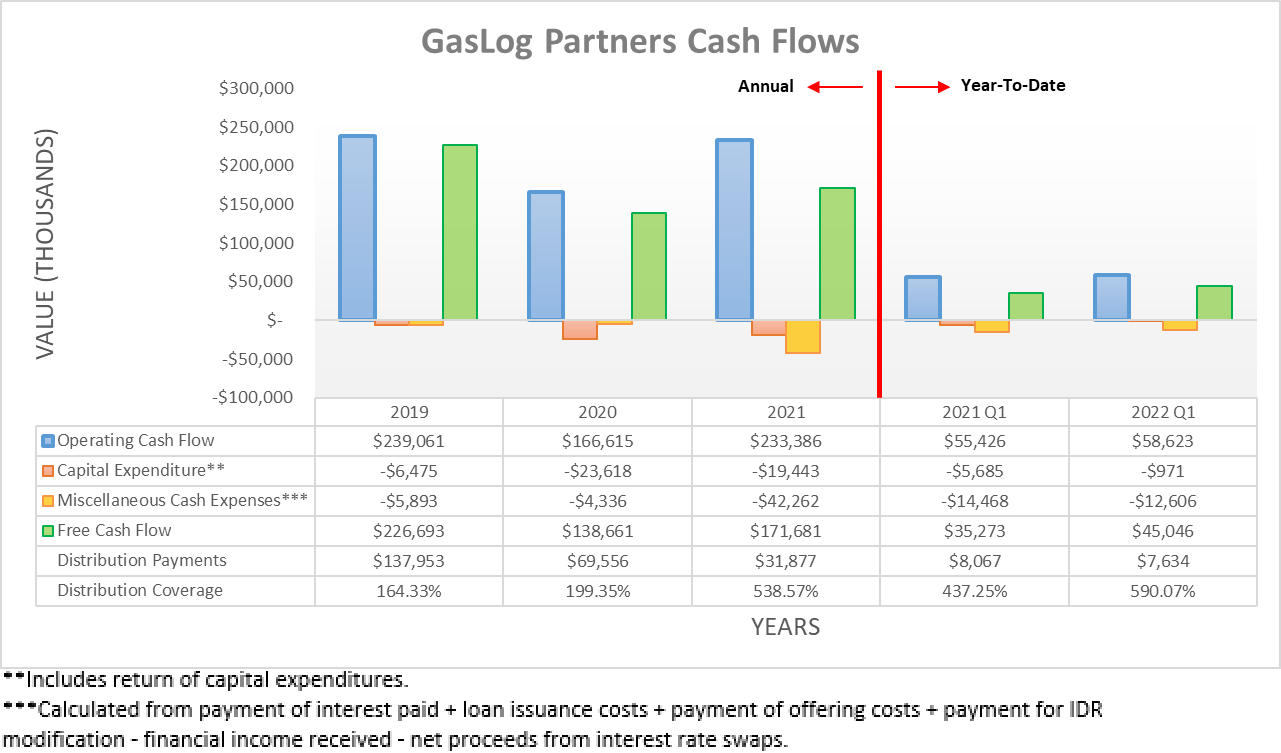
After seeing decent cash flow performance during 2021, once adjusting for the accounting changes discussed within my previously linked article, they have once again seen fairly business-as-usual results thus far into 2022. Their operating cash flow for the first quarter of 2022 landed at $58.6m and thus a decent 5.77% higher year-on-year versus their previous result of $55.4m during the first quarter of 2021. Admittedly, if their temporary working capital movements are removed, their underlying operating cash flow during the first quarter of 2022 of $61m was actually down 5.00% year-on-year versus their previous equivalent result of $64.2m during the first quarter of 2021. Whilst not necessarily ideal, these relatively small fluctuations are normal and were mirrored by their accrual-based adjusted EBITDA, as per the commentary from management included below.
“Adjusted EBITDA was $61 million, a decrease of $3 million or 5% from the first quarter of 2021 due to higher operating expenses and general and administrative expenses…”
-GasLog Partners Q1 2022 Conference Call.
When looking further ahead, the Russia-Ukraine war has seen a surge in demand for LNG from Europe and as a result, demand for LNG vessels has followed in tandem, as was expected within my previously linked article that provides more details for any new readers. Whilst the extent this translates into stronger financial performance remains to be seen, thankfully they were still left with a solid $45m of free cash flow once subtracting their very minor capital expenditure of only $1m and a further $12.6m of miscellaneous cash expenses, which almost completely related to their interest expense, as noted beneath the graph included above. After funding their $7.6m of combined common and preferred distributions, they were left with $37.4m of retained free cash flow for deleveraging, which remains central to their story that sees solid progress, as the graphs included below display.
GasLog Partners First Quarter Of 2022 Results Presentation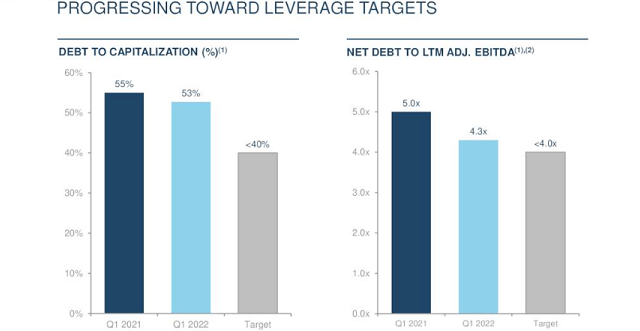
It can be seen that their leverage ratio ended the first quarter of 2022 at 4.30 and apart from being a large improvement versus its previous result of 5.00 one year prior, it also now sits very close to their target of sub-4.00. Whilst further debt repayments will continue helping, realistically, their leverage ratio is poised to drop lower once their weak adjusted EBITDA from the second quarter of 2021 is finally lapped. They normally see adjusted EBITDA north of $60m per quarter, although their result from the second quarter of 2021 was only a mere $45m due to dry-dockings, as per the commentary from management included below.
“Adjusted EBITDA was 45 million while adjusted earnings was $0.10 per unit. Declines in adjusted EBITDA and adjusted earnings per unit were due to lower revenues and higher operating costs related to the three dry-dockings completed in the second quarter.”
-GasLog Partners Q2 2021 Conference Call.
This has been suppressing their last twelve-month adjusted EBITDA and by extension, it has also been boosting their leverage ratio. Thankfully, this will soon end once their new results for the second quarter of 2022 are released later in July, which as subsequently discussed, stands to potentially see higher distributions less than a month away.
Author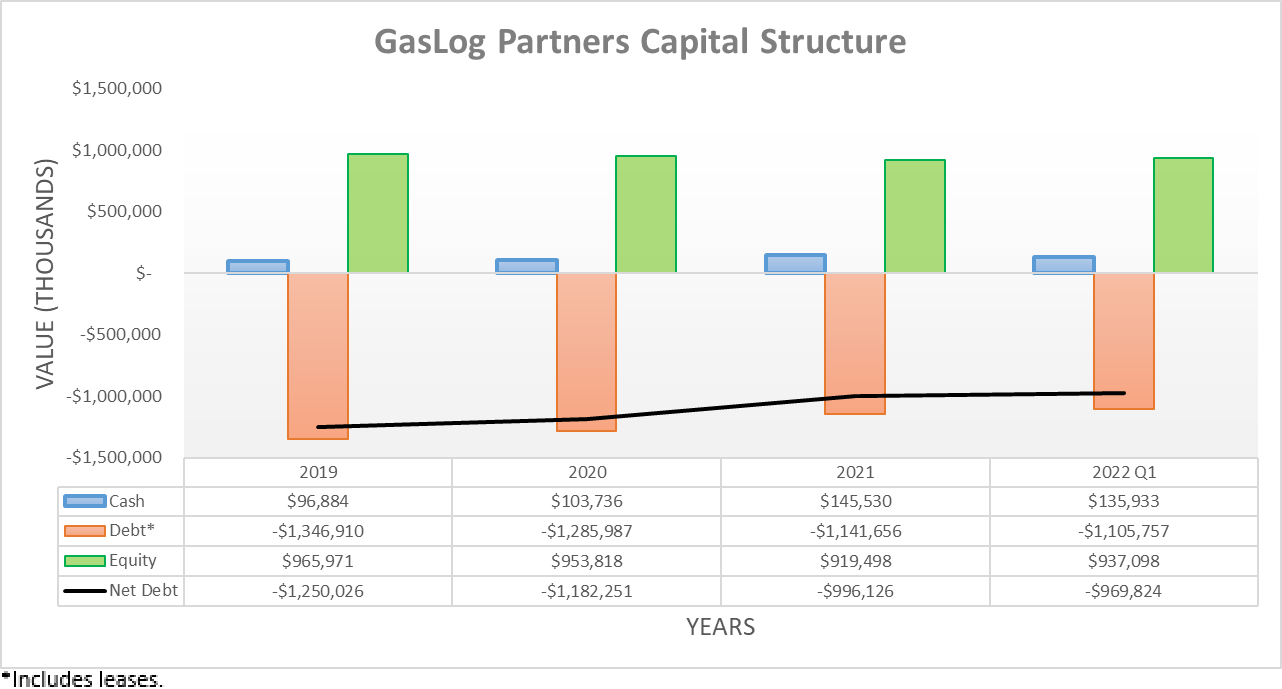
When turning to their capital structure, their continued solid cash flow performance helped push their net debt a bit lower once again, following its usual path and thus now sits at $969.8m following the first quarter of 2022 versus the $996.1m where it ended 2021. As a sidenote, this article now includes their leases within their debt to align with the practice management takes and also better reflect the same approach my comparable analyses take with other companies within the broader shipping industry.
Author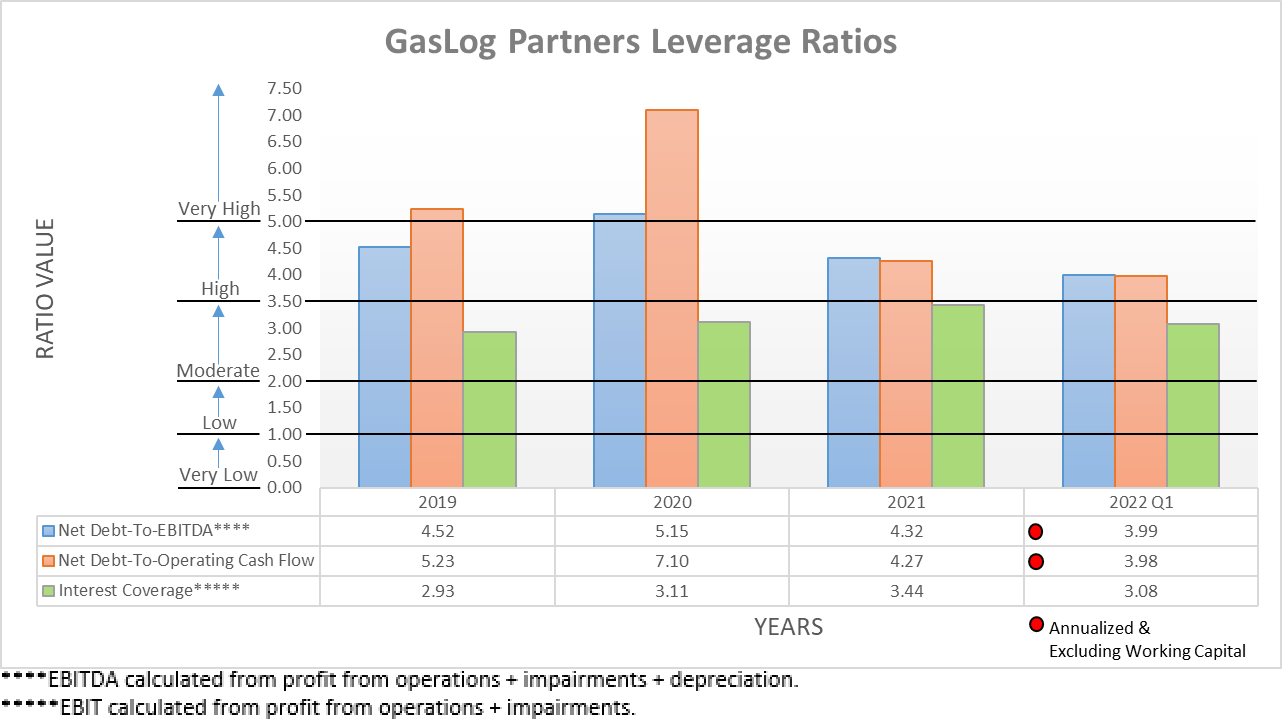
Thanks to their net debt trending lower, their leverage is following in tandem with their respective net debt-to-EBITDA and net debt-to-operating cash flow now at 3.99 and 3.98 versus their respective previous results of 4.32 and 4.27 at the end of 2021. Despite still being within the high territory, they are now approaching the lower end of this range of between 3.51 and 5.00 and excitingly, they are now sitting around the same level as their leverage ratio target of sub-4.00.
The primary way that their leverage ratio differs from my net debt-to-EBITDA stems from their use of adjusted EBITDA from the last twelve months whereas my result annualizes their first quarter of 2022 results. Since my results have already reached their target, it highlights that as they lap their weak adjusted EBITDA seen during the second quarter of 2021, their leverage ratio should promptly drop down to their target. This could possibly come as soon as the end of the second quarter of 2022 and thus higher distributions may only be less than a month away when they release their second quarter results at the end of July or if not, soon after as their net debt continues trending lower.
Whilst very exciting, there remains a possible hindrance, their other leverage target is linked to their debt-to-capitalization that ended the first quarter of 2022 at 53% and thus materially higher than their target of sub-40%, which is a gap that is virtually impossible to bridge in only one quarter. Based upon my calculations, they would have to trim approximately $250m from their debt to reach their target of sub-40%. The length of time this would take depends upon whether they utilized a portion of their cash balance because unlike their leverage ratio that is based upon their net debt, their debt-to-capitalization is based upon their total debt.
Without drawing from their cash balance, which is most likely as subsequently discussed, it would take their circa $37m per quarter of retained free cash flow around seven quarters to repay another $250m of debt, assuming zero distribution increases. Given the very strong outlook for LNG vessel demand from Europe, this could possibly be several quarters faster but personally, I suspect their distributions will increase in multiple stages, which is common, thereby seeing one increase in the short-term once reaching their leverage ratio target with another increase to follow reaching their debt-to-capitalization target. Since their current market capitalization is only approximately $283m, thereby seeing an insanely high free cash flow yield of circa 60% based upon their first quarter of 2022 results of $45m being annualized, even a relatively small increase as a portion of their free cash flow could see their unitholders in swimming cash, metaphorically speaking.
Author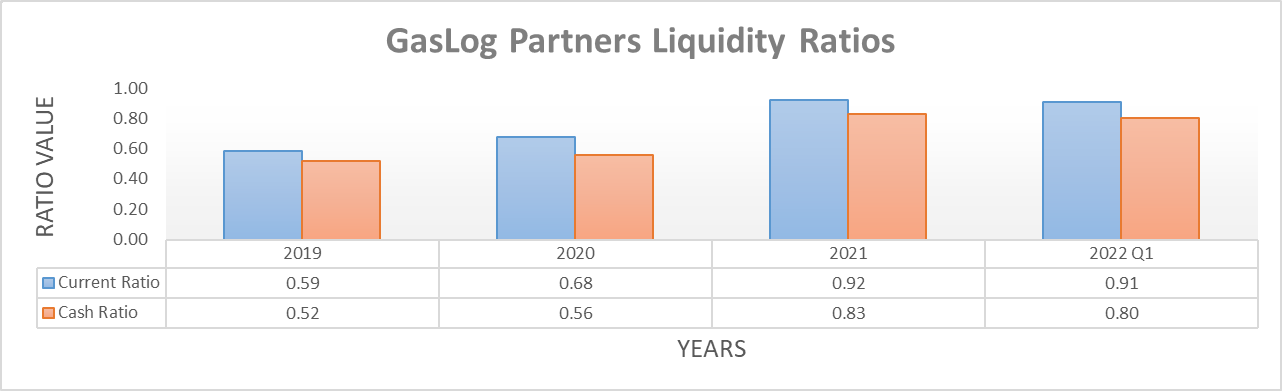
Following another quarter of solid cash flow performance, it was not surprising that their liquidity remained strong with their respective current and cash ratios of 0.91 and 0.80 almost unchanged since the end of 2021. Going forwards, it will be especially important to retain a sizeable cash balance because they elected not to renew their credit facility that expired in April 2022 and held $30m of availability, which makes it unlikely that management will push their previously discussed debt-to-capitalization lower by drawing from their cash. Despite likely extending the timeline before investors can expect to enjoy their full distribution potential, they are still generating ample free cash flow to remain fiscally stable, especially with most of their debt maturities sitting three or more years into the future, as the table included below displays.
GasLog Partners 2021 20-F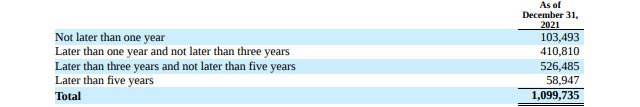
Conclusion
It has been almost two years since their distributions were reduced to the barebones and whilst the future remains inherently uncertain by nature, the outlook for a return to meaningful distributions has never been stronger. Not only is their industry enjoying a very strong outlook for LNG vessel demand well into the future as Europe decouples its energy needs from Russia but even more importantly, their leverage is posed to reach the first of their targets. Following the stability this brings to their partnership and the income-focused nature of their Master Limited Partnership structure, it seems that higher distributions may only be less than a month away and thus unsurprisingly, I believe that maintaining my buy rating is appropriate once again.
Notes: Unless specified otherwise, all figures in this article were taken from GasLog Partners’ SEC Filings, all calculated figures were performed by the author.
Be the first to comment