

Marc Dufresne/iStock Unreleased via Getty Images
First Trust Dorsey Wright Focus 5 ETF (NASDAQ:FV) is a fund of funds offering exposure to a five-strong basket of First Trust ETFs exhibiting the strongest momentum in the selection universe measured using a proprietary relative strength score. Incepted on 5 March 2014, the fund has attracted a rather strong investor interest and amassed total net assets in excess of $2.9 billion.
I have come across FV just recently, noticing that its investment strategy somewhat reminds me of the Cambria Global Momentum ETF (GMOM). The essential difference is that GMOM bears some FX risk and invests across a few asset classes including bonds and currencies, while FV is enamored of the U.S. equity sector & industry ETFs. In that sense, it is more of a sector rotation play.
There is no denying that the concept of an ETF that leverages a momentum-centered strategy steering clear of laggards and picking only winners, with frequent adjustments made to the portfolio, looks alluring. When momentum in certain funds (hence, sectors they are supposed to represent) wanes, it can easily get rid of them rotating to leaders, while rarely rebalanced conservative vehicles have to maintain their exposures to underperformers and suffer drawdowns.
Nevertheless, the issue is that there is a gap between expectations and reality. In practice, these strategies come with high volatility and subpar risk-adjusted returns, unable to beat the market consistently, while also suffering either steeper or on-par drawdowns. Unfortunately, this is the case with FV also. And in this regard, this ETF earns only a Hold rating from me, despite a few advantages it does sport.
The fund mimics the performance of the Dorsey Wright Focus Five Index, which has a proprietary methodology revolving around the concept of relative strength. Its selection process is fairly simple. As explained in the investor guide, the index provider screens the universe encompassing the First Trust sector and industry ETFs for those five vehicles that boast the highest relative strength score. The portfolio is reviewed bimonthly, so I would call this strategy quasi-passive as frequent rebalancing makes it more akin to an active approach.
And here already comes the first vulnerability of the FV ETF. The index whittles down its holdings from a limited list of the First Trust ETFs. Another way of saying, the strategy is constrained as the universe is probably too small. Inadequate diversification of the selection pool might partly explain its underperformance over certain timeframes (discussed below). A similar issue might be weighing on GMOM’s returns too, which I flagged in the August article.
Looking under the hood, we see exactly five ETFs in the current iteration. FV is overweight the First Trust Energy AlphaDEX Fund (FXN) and First Trust Nasdaq Oil & Gas ETF (FTXN), with 22.8% and 20.8% allocated, respectively, which might mean the fund is implicitly bullish on the crude oil price, also expecting inflation to remain elevated for longer as petroleum producers are deemed beneficiaries of the phenomenon of rising prices across the economy.
This year, the macro backdrop has been conducive for a strong bull market in energy equities owing to supply/demand imbalances partly stemming from the toll the two oil price crises of the 2010s took on the oil & gas capex, and partly engendered by geopolitics. Recently, we have seen a return of the inflation narrative, with the August CPI data surprising to the upside.
However, as the index is based on the equal-weight principle, it should be anticipated that FXN and FTXN will see their weights trimmed upon the next rebalancing.
The First Trust Industrials/Producer Durables AlphaDEX Fund (FXR) comes second, with 19.56% weight. Being in third place with a 19.52% weight, the First Trust Nasdaq Food & Beverage ETF (FTXG) adds a layer of defensiveness as a consumer staples play. The First Trust Materials AlphaDEX Fund is the smallest holding, with 17.17% allocated.
As a brief digression, looking at the Seeking Alpha ETF grades, it is fairly obvious why FV is long FTXN, FXN, and FTXG, yet the inclusion of the industrials ETF looks counterintuitive a bit owing to its soft momentum.
Seeking Alpha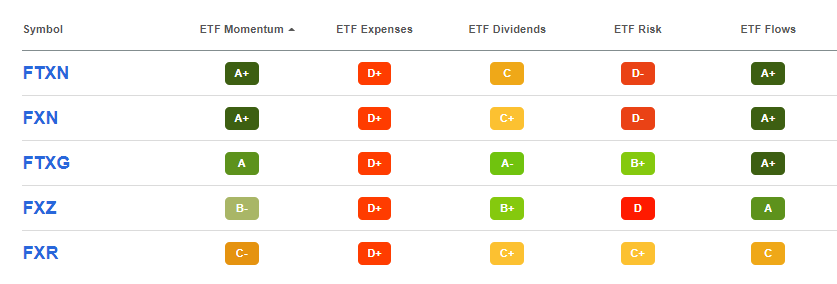
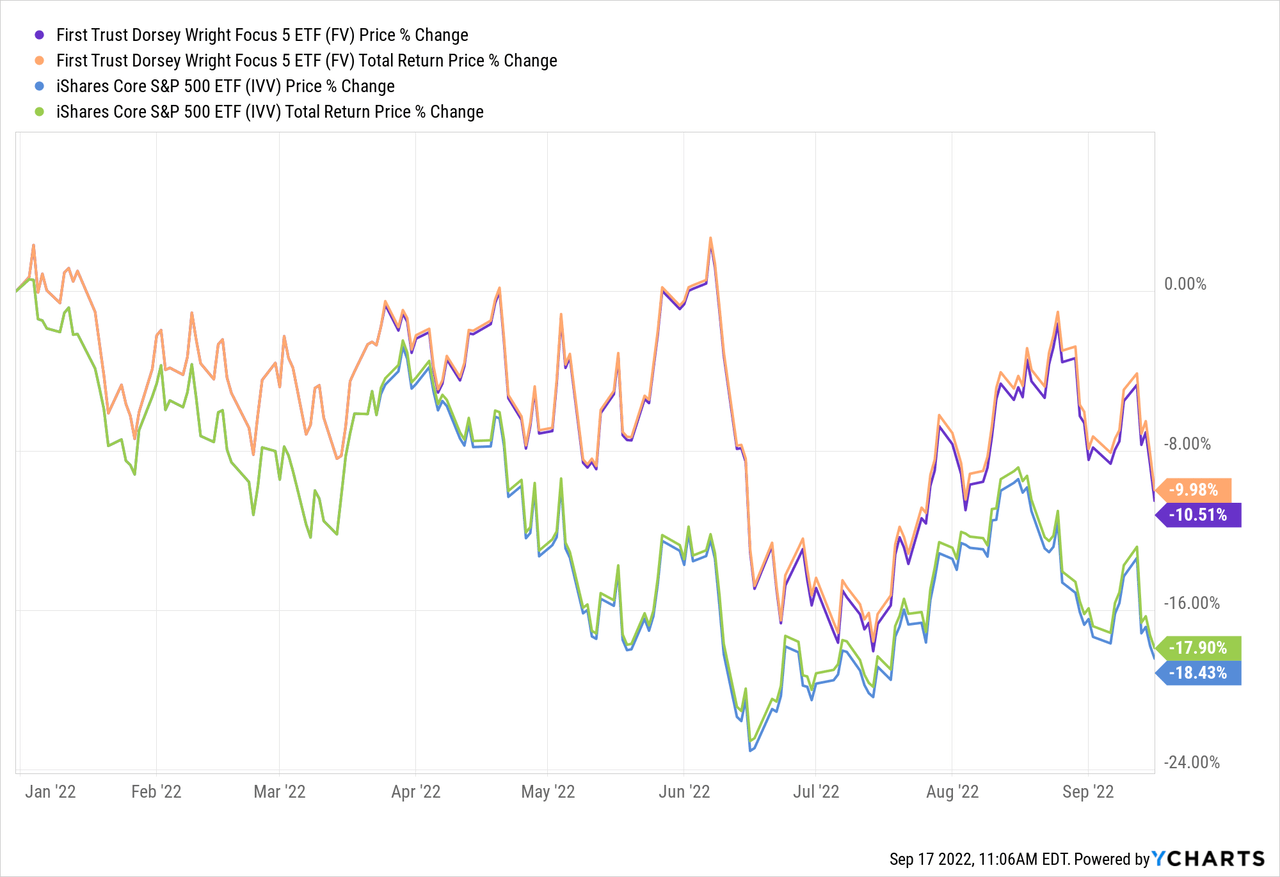
Large exposure to oil & gas equities likely did its job. FV is down by only ~8.8% this year, while the iShares Core S&P 500 ETF (IVV) has been more afflicted, with a loss approaching 18% exacerbated by the recent sell-off.
Is it worth buying into the ETF then? Especially considering that the inflation narrative has returned. To avoid a sophomoric conclusion, let us look at the bigger picture.
First, the following table summarizes CAGRs, standard deviations, and risk-adjusted returns for FV, IVV, and the iShares MSCI USA Momentum Factor ETF (MTUM) over the April 2014 – August 2022 period.
Created by the author using data from Portfolio Visualizer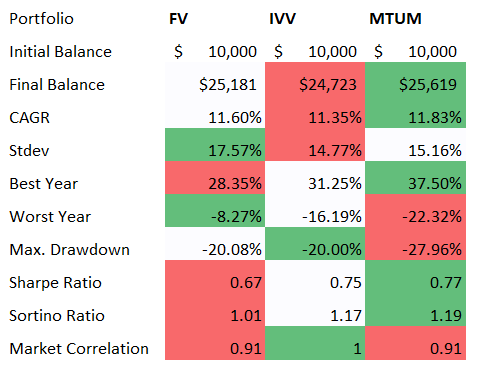
And the results are mixed. FV marginally outperformed IVV (despite a meaningful difference in fees), yet delivered higher volatility and weaker risk-adjusted returns (the Sharpe, Sortino ratios). Its worst year (2018) is a positive surprise, as it declined by just 8.3%; for IVV and MTUM, 2022 has appeared to be the worst in this period, with much steeper losses.
But despite robust 2022, longer-term data look well bleaker; as the table below shows, FV underperformed IVV during five full trading years out of seven; interestingly, it seems it correctly identified the pandemic winners in 2020, which secured an almost 10% higher total return compared to the S&P 500 ETF, yet it failed to benefit from the capital rotation of 2021.
Created by the author using data from Portfolio Visualizer
Second, it is certainly worth comparing it with peers. The issue here is that most of the selected ETFs with akin sector-rotation strategies have much shorter trading histories, so we have to adapt our analysis to that.
In my view, the following funds fit into its peer group,
- Fairlead Tactical Sector ETF (TACK),
- SSGA US Sector Rotation ETF (XLSR), incepted in April 2019,
- Main Sector Rotation ETF (SECT), incepted in September 2017.
TACK was launched in March 2022, and has already declined by ~6.6% since then.
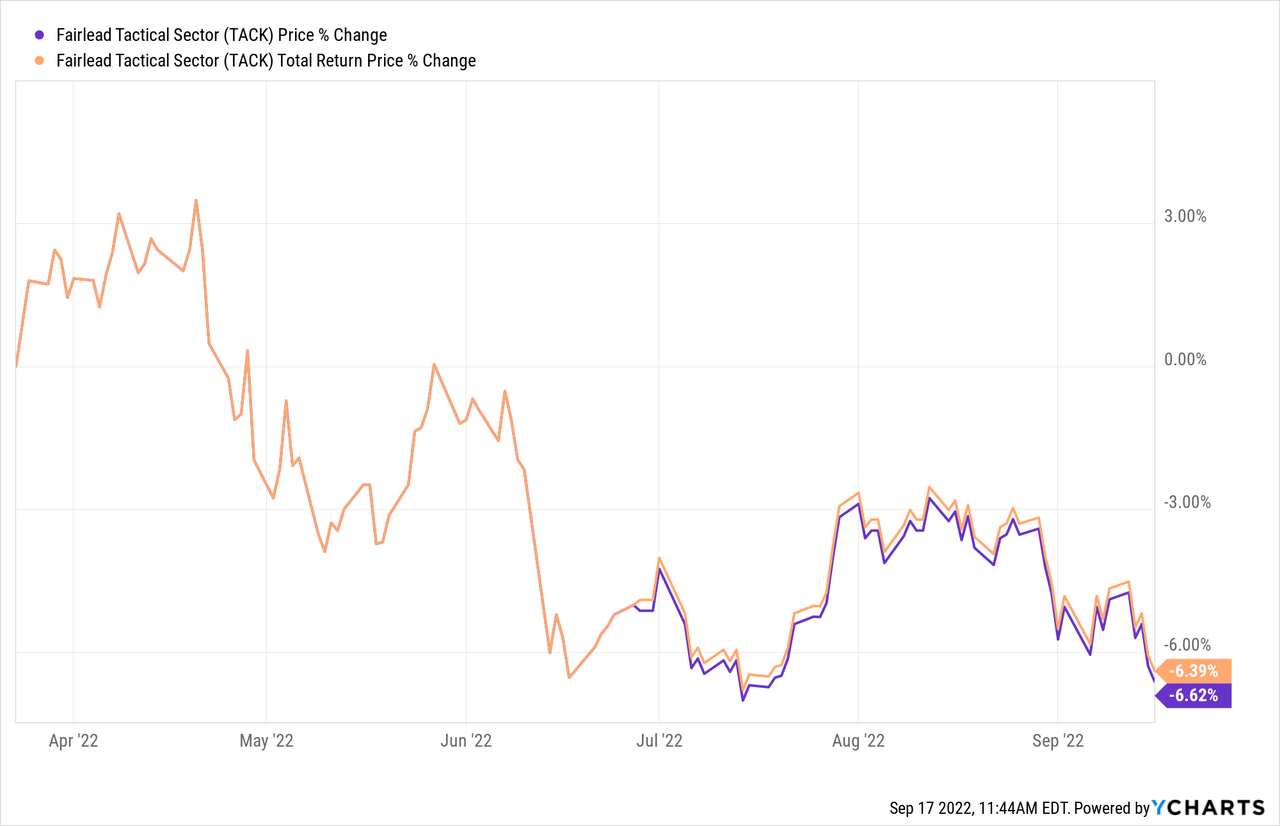
The following table excludes this fund; the period in focus is May 2019 – Aug 2022.
Created by the author using data from Portfolio Visualizer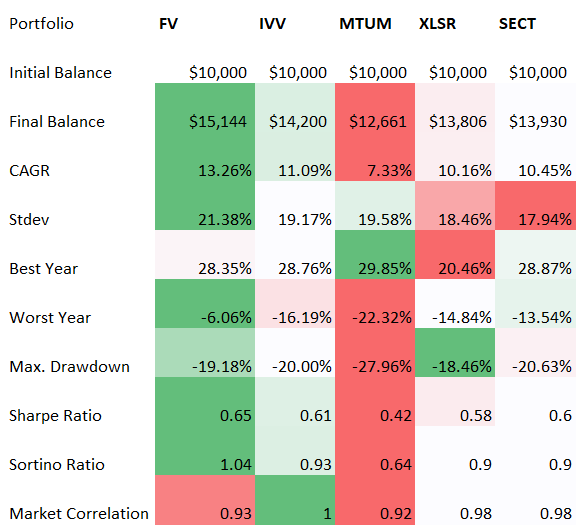
Here FV looks much better, primarily because its relative strength-focused strategy delivered decent results in 2020, correctly identifying the pandemic-related trends; it has also fared better compared to the market and peers during hawkish 2022. The downside is the highest standard deviation in the group.
Burdensome fees eat into returns
Another issue worthy of concern, primarily for long-term investors, is its fees. Even though the ETF’s expense ratio looks comparatively comfortable at 30 bps, with acquired fund fees & expenses taken into account, the figure comes at 89 bps, which is rather burdensome.
Final thoughts
Relative strength-focused FV implicitly believes equity prices contain all the necessary information, from company-specific issues to the macro. It invests in the sector & industry ETFs that are on a tear, betting on price momentum to persist.
And this strategy delivered meaningful returns in the past over a few relevant timeframes, yet there is something to dislike. The principal issues with the fund that come to light upon deeper inspection are higher volatility compared to IVV and subsequently weaker risk-adjusted returns since inception. It should also not go unnoticed that FV is anything but cheap. Thus, a Hold rating looks adequate.
Be the first to comment