

MF3d
Dear Fellow Investor,
This is the thirteenth annual letter to owners of the Fundsmith Equity Fund (‘Fund’).
Our Fund’s performance in 2022 will give credence to those who suffer from triskaidekaphobia.
The table below shows performance figures for the last calendar year and the cumulative and annualised performance since inception on 1st November 2010 and various comparators.
|
% Total Return |
1st Jan to 31st Dec 2022 |
Inception to 31st Dec 2022 |
Sortino Ratio |
|
|
Cumulative |
Annualised |
|||
|
Fundsmith Equity Fund1 |
-13.8 |
+478.2 |
+15.5 |
0.84 |
|
Equities2 |
-7.8 |
+256.8 |
+11.0 |
0.36 |
|
UK Bonds3 |
-15.0 |
+19.8 |
+1.5 |
n/a |
|
Cash4 |
+1.4 |
+7.8 |
+0.6 |
n/a |
|
The Fund is not managed with reference to any benchmark, the above comparators are provided for information purposes only.
|
The table shows the performance of the T Class Accumulation shares, the most commonly held share class and one in which I am invested, which fell by 13.8% in 2022 and compares with a fall of 7.8% for the MSCI World Index in sterling with dividends reinvested.
The Fund therefore underperformed this comparator in 2022 but is still the best performer since its inception in November 2010 in the Investment Association Global sector with a return 299 percentage points above the sector average which has delivered just 179.1% over the same timeframe.
Whilst a period of underperformance against the index is never welcome it is nonetheless inevitable. We have consistently warned that no investment strategy will outperform in every reporting period and every type of market condition. So, as much as we may not like it, we can expect some periods of underperformance.
Underperforming the MSCI World Index is one issue, registering a fall in value is another. In 2022 unless you restricted your equity investments to the energy sector you were almost certain to have experienced a drop in value:
|
Performance of S&P 500 Sectors in 2022 |
|
|
Energy |
+59% |
|
Utilities |
-1% |
|
Consumer Staples |
-3% |
|
Health Care |
-4% |
|
Industrials |
-7% |
|
Materials |
-14% |
|
Banks |
-22% |
|
Software & Services |
-27% |
|
Real Estate |
-28% |
|
Consumer Discretionary |
-38% |
|
Communication Services |
-40% |
|
Source: Bloomberg |
|
Why has this happened? We have exited a long period of ‘easy money’: a period of large fiscal deficits, where government spending significantly exceeds revenues, and low interest rates.
We can probably trace the era of low interest rates back to the so-called Greenspan Put which became evident in the 1990s as low interest rates were utilised as the palliative in periods of market volatility such as the Asian Crisis of 1997 and the Russian default and LTCM collapse in 1998.
As the new millennium arrived so did new crises which seemed to warrant even easier money.
It started with the Dotcom meltdown in 2000 and was followed by the Credit Crunch of 2008–09 which started in the US housing market and quickly became a full-blown international banking crisis. These increasingly severe events seemed to call for even more extreme measures in terms of both fiscal policy and interest rates:
Quantitative Easing (‘QE’), so-called ‘printing money’ in which central banks created money to purchase assets, starting with government debt but eventually ranging into corporate debt and equities. As an aside, quite how it aided the economy of either Japan or Switzerland for their central banks to buy international equities is beyond my grasp. This was combined with low, no (Zero Interest Rate Policy — ZIRP) or even negative interest rates (NIRP). These measures I have collectively christened with the generic term ‘easy money’.
Attempts to suppress volatility will only exacerbate it in the long term. If you count the current events, we have now had three economic and financial crises this century and it is still in its first quarter. This would seem to illustrate that attempts to expunge volatility from the financial system are actually producing the opposite of the desired effect. They breach the rule for what you should do if you find yourself in a hole.
This is hardly surprising given that the central banks were aiming at the wrong targets. Central banks were attempting to maintain a benign level of consumer price inflation but ignored asset price inflation caused by their actions. Some also adopted employment targets that were not or should not be part of their remit.
One of the problems of easy money is that it leads to bad capital allocation or investment decisions which are exposed as the tide goes out.
We saw this in Japan in the late 1980s in a bull market when the Emperor’s garden was valued more than the state of California and the Tokyo Stock Exchange was on a P/E of about 100. The aftermath has been prolonged and worsened by a penchant for not admitting failure.
So-called zombie companies that should have been allowed to fail have been propped up with continued funding and allowed to survive. Sending good money after bad is never a recipe for success. However, before we leap to the conclusion that this is in any way a uniquely Japanese trait let us bear in mind that other than Lehman no other major company was allowed to go bust in 2008, despite it being the largest financial crisis for 75 years.
Japan’s bubble was followed by the Dotcom era in which money could be raised for an idea. The resulting meltdown was painful and especially for investors who had bought a business plan rather than a business. It is worth bearing in mind that real businesses survived and prospered. Amazon’s stock declined by about 95% during the Dotcom bust. It has since risen about 600 fold to its peak.
Then we had the credit boom and bust when the easy money sucked people into ‘investing’ in homes, rather than simply living in them, and ‘investing’ in credit products which had been structured to look like triple A credits when they were really triple Z. You can’t improve the quality or liquidity of an asset by putting it into a structure.
The other problem with the policy of easy money was that it had to end eventually, but not before it had one last hurrah.
There were half-hearted attempts to reverse QE in particular by lowering central banks’ bond purchases but when the stock market unsurprisingly reacted badly in the so-called ‘taper tantrum’ in 2013, these were abandoned.
Then in 2020 came the pandemic and central banks reacted to this by enacting that good old saying ‘To a man with a hammer, everything looks like a nail’. They decided that they should double down with their new toy, QE, which seemed to work so well in the Credit Crisis without any nasty side effects, well none that had yet become apparent, and apply an almighty stimulus.
This was applied when there was no problem with demand or the banking system. It was just that people were locked up in their homes and unable to spend on bricks & mortar shopping, travel and entertainment and the global supply chain was malfunctioning, leaving consumers with pent-up savings waiting to be spent.
What happened next may be an example of Sod’s Corollary to Murphy’s Law:
- Murphy’s Law: What can go wrong will go wrong.
- Sod’s Corollary: Murphy was an optimist.
Sod’s Corollary gave us the February 2022 Russian invasion of Ukraine which affected the prices of oil, gas and other minerals, such as nickel, and cereals following the central banks’ stimulus.
The net result of the further stimulus and this invasion has been an upsurge in inflation and as a consequence a rapid and painful end to easy money.
This final round of easy money post the pandemic led to all the usual poor investments which people make when they are led to assume that money is endlessly available and costs zero to borrow or raise. We can see the unwinding of these unwise investments, for example, in the collapse of FTX, the cryptocurrency ‘exchange’ ((sic)) and the meltdown in the share prices of those tech companies with no profits, cash flows or even revenues.
It is inevitable that when interest rates rise, as they have now to combat inflation, longer-dated bonds fall more than short-dated ones, and so it is with equities with more highly rated shares — which are discounting earnings or cash flow further into the future — suffering more in the downturn than lowly rated or so-called value stocks. This effect can be seen in the bottom five detractors from the Fund’s performance in 2022:
|
Stock |
Attribution |
|
Meta Platforms |
-3.3% |
|
PayPal |
-2.5% |
|
Microsoft |
-1.8% |
|
IDEXX |
-1.7% |
|
Amazon |
-1.5% |
|
Source: State Street |
Four of the five stocks are in what might loosely be termed the Technology sector (although META is actually in the MSCI Communication Services sector and MSCI has Amazon (AMZN) as a Consumer Discretionary stock) and at least two — PayPal (PYPL) and IDEXX (IDXX) — started the period with valuations which were particularly vulnerable to the effect of rising rates.
In some cases these share price falls have become more pronounced because of events surrounding the business. Meta has its well-publicised problems with the regulatory and competition authorities and has announced a large spend on developing the so-called metaverse which it changed its name from Facebook to reflect. PayPal seems intent on snatching defeat from the jaws of victory. It has taken a leading position in online payments and parlayed that into a lamentable share price performance.
The elements in this would appear to be a disregard for engagement with the customers newly acquired during the pandemic and no obvious attention to or control of costs. This is hardly surprising given the attention devoted to pursuing some clearly over-priced acquisitions. That is what happens when management start to conclude that investments do not need to earn an adequate return.
We are not aware of any major fundamental problems with either IDEXX or Microsoft.
Our highly valued and technology holdings did not fare as poorly as some of the companies which had significant market values but no profits, cash flows or in some cases even revenues. Here is a table which shows those companies in November 2021, roughly the peak of the market:
|
As at 19th Nov 2021 |
Zero Revenues |
<$100m Revenues |
Negative Net Income |
Negative Free Cash Flow |
|
Market Cap >$1bn |
92 |
576 |
1,561 |
2,606 |
|
Market Cap >$5bn |
9 |
42 |
412 |
662 |
|
Market Cap >$10bn |
2 |
7 |
204 |
331 |
|
Source: Fundsmith Research/Bloomberg |
This may seem cold comfort and to quote an old adage, ‘When the police raid the bawdy house even the nice girls get arrested’. But looking back to the example of Amazon over the Dotcom meltdown and its aftermath, it is a lot more comforting to own businesses which are performing well fundamentally when the share price goes down than to be found playing Greater Fool Theory in the shares of a company with no cash flows, profits or even revenues.
For the year the top five contributors to the Fund’s performance were:
|
Stock |
Attribution |
|
Novo Nordisk (NVO) |
+2.1% |
|
Philip Morris (PM) |
+1.1% |
|
PepsiCo |
+0.7% |
|
ADP |
+0.5% |
|
Mettler-Toledo |
+0.4% |
|
Source: State Street |
If one word had to be used to describe last year’s winners it would be ‘defensive’. Two of them are fast-moving consumer goods companies and one is a drug company. However, it is worth pointing out that ADP is actually in the MSCI Technology sector.
Which brings me to another point. You may have read that the Fundsmith Equity Fund is becoming a ‘Tech fund’ based upon recent purchases: ‘Terry Smith tech-buying spree continues with Apple purchase’, Interactive Investor, November 2022.
Here is the MSCI sector breakdown of the portfolio:
|
As at 31st December 2022 |
% |
|
Consumer Staples |
33.8 |
|
Health Care |
26.0 |
|
Technology |
20.7 |
|
Consumer Discretionary |
9.4 |
|
Communication Services |
4.5 |
|
Industrials |
1.7 |
|
Cash |
3.9 |
|
Source: Fundsmith Research/MSCI GICS® Categories |
20.7% of the portfolio is defined as Technology by MSCI. This compares with 23.2% on 31.12.14. I can’t see a ‘spree’. I am not that keen on relying upon sector classifications to define a business and you may note that 4.5% is in the Communication Services sector. As these are Alphabet (GOOG, GOOGL, the former Google) and Meta, I regard them as technology stocks and Amazon is classified as a Consumer Discretionary stock, although how this fits Amazon Web Services is difficult to see.
But similarly it is worth noting that a number of stocks which are in the MSCI Technology sector and are, or were until recently, in our portfolio are not in my view primarily technology companies but rather they use technology to deliver differing services, namely:
- ADP — payroll, employee insurance and HR.
- Amadeus (OTCPK:AMADF) — airline and hotel reservations and operations.
- Intuit (INTU) — tax and accounting services.
- PayPal — payment processing.
- Visa (V) — payment processing.
Moreover, commentators tend to take an all or nothing approach to reporting our holdings — as in the reference to Apple (AAPL) already noted — without any mention of the size of the holding, which is hardly surprising as this is only disclosed semi-annually. But to put this in context, our combined holdings of Alphabet, Amazon, Apple, Adobe (ADBE) and Meta amount to just 9.0% of the portfolio, compared to our holding in Microsoft of 7.6%.
I would therefore suggest that the Fund’s exposure to technology is a lot more subtle and nuanced, as well as smaller and more widely spread than the headlines sometimes suggest.
However, as well as the lower valuations caused by higher rates, technology stocks are facing some fundamental headwinds. A slowdown in the growth of tech spending is hardly surprising after the massive growth caused by digitalisation during the pandemic.
Moreover, the cyclicality of tech spending and online advertising is probably about to become evident as the economy slows and maybe falls into recession. It may be greater than in the past simply because tech spending has become a much larger proportion of overall corporate and personal spending. However, there may be a silver lining in this cloud (no pun intended) as this pressure on revenue growth may cause some of the tech companies we invest in to stop behaving as though money is free and halt some of the less promising projects outside their core business, such as:
- Alphabet — Its hugely loss-making ‘Other Bets’. Lightning does not strike twice. It has a good core online search and advertising business.
- Amazon — It has already withdrawn from food delivery and technical education in India (who knew?). It has a highly successful ecommerce and cloud computing business on which to focus.
- Meta — Stopping or cutting spending on the metaverse? Without that spend we would own a leading communications and digital advertising business on a single-figure Price/Earnings ratio (P/E).
We continue to apply a simple three step investment strategy:
- Buy good companies
- Don’t overpay
- Do nothing
I will review how we are doing against each of those in turn.
As usual we seek to give some insight into the first and most important of these — whether we own good companies — by giving you the following table which shows what Fundsmith Equity Fund would be like if instead of being a fund it was a company and accounted for the stakes which it owns in the portfolio on a ‘lookthrough’ basis, and compares this with the market, in this case the FTSE 100 and the S&P 500. This shows you how the portfolio compares with the major indices and how it has evolved over time.
|
Year ended |
Fundsmith Equity Fund Portfolio |
S&P 500 |
FTSE 100 |
|||||||
|
2015 |
2016 |
2017 |
2018 |
2019 |
2020 |
2021 |
2022 |
2022 |
2022 |
|
|
ROCE |
26% |
27% |
28% |
29% |
29% |
25% |
28% |
32% |
18% |
16% |
|
Gross Margin |
61% |
62% |
63% |
65% |
66% |
65% |
64% |
64% |
45% |
42% |
|
Operating Margin |
25% |
26% |
26% |
28% |
27% |
23% |
26% |
28% |
18% |
18% |
|
Cash Conversion |
98% |
99% |
102% |
95% |
97% |
101% |
95% |
88% |
88% |
66% |
|
Interest Cover |
16x |
17x |
17x |
17x |
16x |
16x |
23x |
20x |
10x |
11x |
|
Source: Fundsmith LLP/Bloomberg. ROCE, Gross Margin, Operating Margin and Cash Conversion are the weighted mean of the underlying companies invested in by the Fundsmith Equity Fund and mean for the FTSE 100 and S&P 500 Indices. The FTSE 100 and S&P 500 numbers exclude financial stocks. Interest Cover is median. 2015–2019 ratios are based on last reported fiscal year accounts as of 31st December and for 2020–22 are Trailing Twelve Months and as defined by Bloomberg. Cash Conversion compares Free Cash Flow per Share with Net Income per Share. |
In 2022 returns on capital and profit margins were significantly higher in the portfolio companies than in 2020 and 2021. Gross margins were steady. Importantly all of these metrics remain significantly better than the companies in the main indices (which include our companies). Moreover, if you own shares in companies during a period of inflation it is better to own those with high returns and gross margins.
Consistently high returns on capital are one sign we look for when seeking companies to invest in. Another is a source of growth — high returns are not much use if the business is not able to grow and deploy more capital at these high rates. So how did our companies fare in that respect in 2022? The weighted average free cash flow (the cash the companies generate after paying for everything except the dividend, and our preferred measure) grew by 1% in 2022.
This is the lowest growth rate we have recorded to date in our portfolio and probably says far more about the levelling off in demand in some sectors post the pandemic surge and macro-economic conditions than it does about the long-term growth potential of the businesses. You may recall that the free cash flow for our companies surged 20% in 2021, significantly above the more normal 9% growth in 2019 and 8% in 2020. Moreover, the free cash flow of the S&P 500 fell by 4% last year.
Frankly we are pleasantly surprised that there was any growth at all in our portfolio companies, and if 1% growth worries you it may be wise not to read next year’s letter.
Cash conversion remains depressed for our portfolio companies but is currently based upon some unusually volatile conditions caused by the pandemic’s disruption to supply chains leading to stockouts and subsequent hoarding of stocks by some companies. Cash flow is an acid test of a business but it is also a more volatile measure than profits which are based on accrual accounting and spread some cash flows between periods. We will have to wait a year or two before something approaching normality is restored and we can gauge how well our companies are doing on this measure.
The average year of foundation of our portfolio companies at the year-end was 1922. They are just over a century old collectively.
The second leg of our strategy is about valuation. The weighted average free cash flow (‘FCF’) yield (the free cash flow generated as a percentage of the market value) of the portfolio at the outset of the year was 2.7% and ended it at 3.2%.
The year-end median FCF yield on the S&P 500 was 3.4%, roughly in line with our portfolio. This is one benefit of the fall in share prices over the period.
Our portfolio consists of companies that are fundamentally a lot better than the average of those in either index and are valued fractionally higher than the average S&P 500 company.
Turning to the third leg of our strategy, which we succinctly describe as ‘Do nothing’, minimising portfolio turnover remains one of our objectives and this was again achieved with a portfolio turnover of 7.4% during the period, a little higher than usual. It is perhaps more helpful to know that we spent a total of just 0.003% (less than a third of a basis point) of the Fund’s average value over the year on voluntary dealing (which excludes dealing costs associated with subscriptions and redemptions as these are involuntary).
We sold our stakes in Johnson & Johnson (JNJ), Starbucks (SBUX), Kone (OTCPK:KNYJF), Intuit and PayPal and purchased stakes in Mettler-Toledo (MTD), Adobe, OTIS and Apple. This seems a lot of names for what is not a lot of turnover as in some cases the size of the holding sold or bought was small. We have held five of our portfolio companies since inception in 2010.
Why is this important? It helps to minimise costs and minimising the costs of investment is a vital contribution to achieving a satisfactory outcome as an investor. Too often investors, commentators and advisers focus on, or in some cases obsess about, the Annual Management Charge (‘AMC’) or the Ongoing Charges Figure (‘OCF’), which includes some costs over and above the AMC, which are charged to the Fund. The OCF for 2022 for the T Class Accumulation shares was 1.04%.
The trouble is that the OCF does not include an important element of costs — the costs of dealing. When a fund manager deals by buying or selling, the fund typically incurs the cost of commission paid to a broker, the bid-offer spread on the stocks dealt in and, in some cases, transaction taxes such as stamp duty in the UK. This can add significantly to the costs of a fund, yet it is not included in the OCF.
We provide our own version of this total cost including dealing costs, which we have termed the Total Cost of Investment (‘TCI’). For the T Class Accumulation shares in 2022 this amounted to a TCI of 1.05%, including all costs of dealing for flows into and out of the Fund, not just our voluntary dealing.
We are pleased that our TCI is just 0.01% (1 basis point) above our OCF when transaction costs are taken into account. However, we would again caution against becoming obsessed with charges to such an extent that you lose focus on the performance of funds. It is worth pointing out that the performance of our Fund tabled at the beginning of this letter is after charging all fees which should surely be the main focus.
In the past we have written about activism and our engagement with companies’ management, and this year I want to draw this together with a couple of examples.
Last year I wrote about Unilever (UL) and attracted a virtual tsunami of comment for my remarks about Unilever, purpose and Hellmann’s mayonnaise. Events soon overtook this commentary insofar as Nelson Peltz’s Trian Partners announced that it had bought a stake in Unilever and he was invited to join the board. We are asked to suspend disbelief that this was in no way linked to the subsequent announcement that Alan Jope will be leaving the CEO role. This explanation sounds like it was lifted from the script of Miracle on 34th Street.
As I have previously pointed out, our Fund has held Unilever shares since inception and was about the 12th largest shareholder when these events happened. Yet for the first eight years of our existence as a shareholder we did not hear from Unilever. The first contact was when we were asked to vote in favour of moving the headquarters and listing to the Netherlands. As I remarked at the time, it is not a good way to manage relationships to ignore people until you need their support.
Once contact had been established with Unilever we then tried to make some points about what we saw as problems with the performance of the business and the focus of the management, which were duly ignored. This is a business making a return on capital in the mid to low teens, below the market average, where you could measure annual growth if you could only count to three, and which missed every target it set out when it summarily rejected the Kraft Heinz (KHC) bid approach. So it’s not like there weren’t some questions to answer. Then came the near-death experience with the abortive GSK Consumer bid.
I don’t know how long Trian held its stake before Mr Peltz was invited to join the board or how big that stake was, but I would guess that they held it for far fewer months than we have held it in terms of years. We have no objection to Mr Peltz’s involvement. He at least seems to have the sense to become involved in good businesses which need some improvement, whereas some activists pick on poor businesses and all they can hope to achieve is a better-run bad business.
Where we have seen him involved in companies we have owned we have sometimes agreed with and admired his contribution — as in the operational improvements which accompanied his time at Procter & Gamble (PG) — and sometimes not — as when he promoted the idea of splitting PepsiCo (PEP) into separate drinks and snacks businesses.
What I find questionable is that companies mouth platitudes about wanting to attract long-term shareholders yet based on our experience, we tend to get ignored, whereas an activist who has held shares for fewer months than we have held in years gets invited to board meetings.
One example may just represent an outlier. But what about PayPal? We had held PayPal shares since it was spun out from eBay in 2015. We tried to engage with PayPal as we identified, seemingly long before the management, that their lack of engagement with new customers was a problem as was cost control and that their acquisitions were value destroying. In particular, we pointed out that the value destroying acquisitions might be avoided if the management remuneration incentives included some measure of return on capital. A representative of the board kindly told us they would think about that.
Whilst they were allegedly thinking about it Elliott Management bought a stake which led to them being given a board seat and an information sharing agreement.
Please don’t misunderstand the criticism I am levelling here. I am not envious. I do not want a seat on the board of Unilever, PayPal or any other listed company. Nor do I want an information sharing agreement. I think our research has been able to identify the problems of PayPal and Unilever better than the management and without any need for access to any unpublished information. In some cases you can determine more from what information is not disclosed. Take Unilever’s acquisition record as an example.
Here’s a chart covering Unilever’s acquisitions in just its Beauty & Wellbeing division over the past eight years.
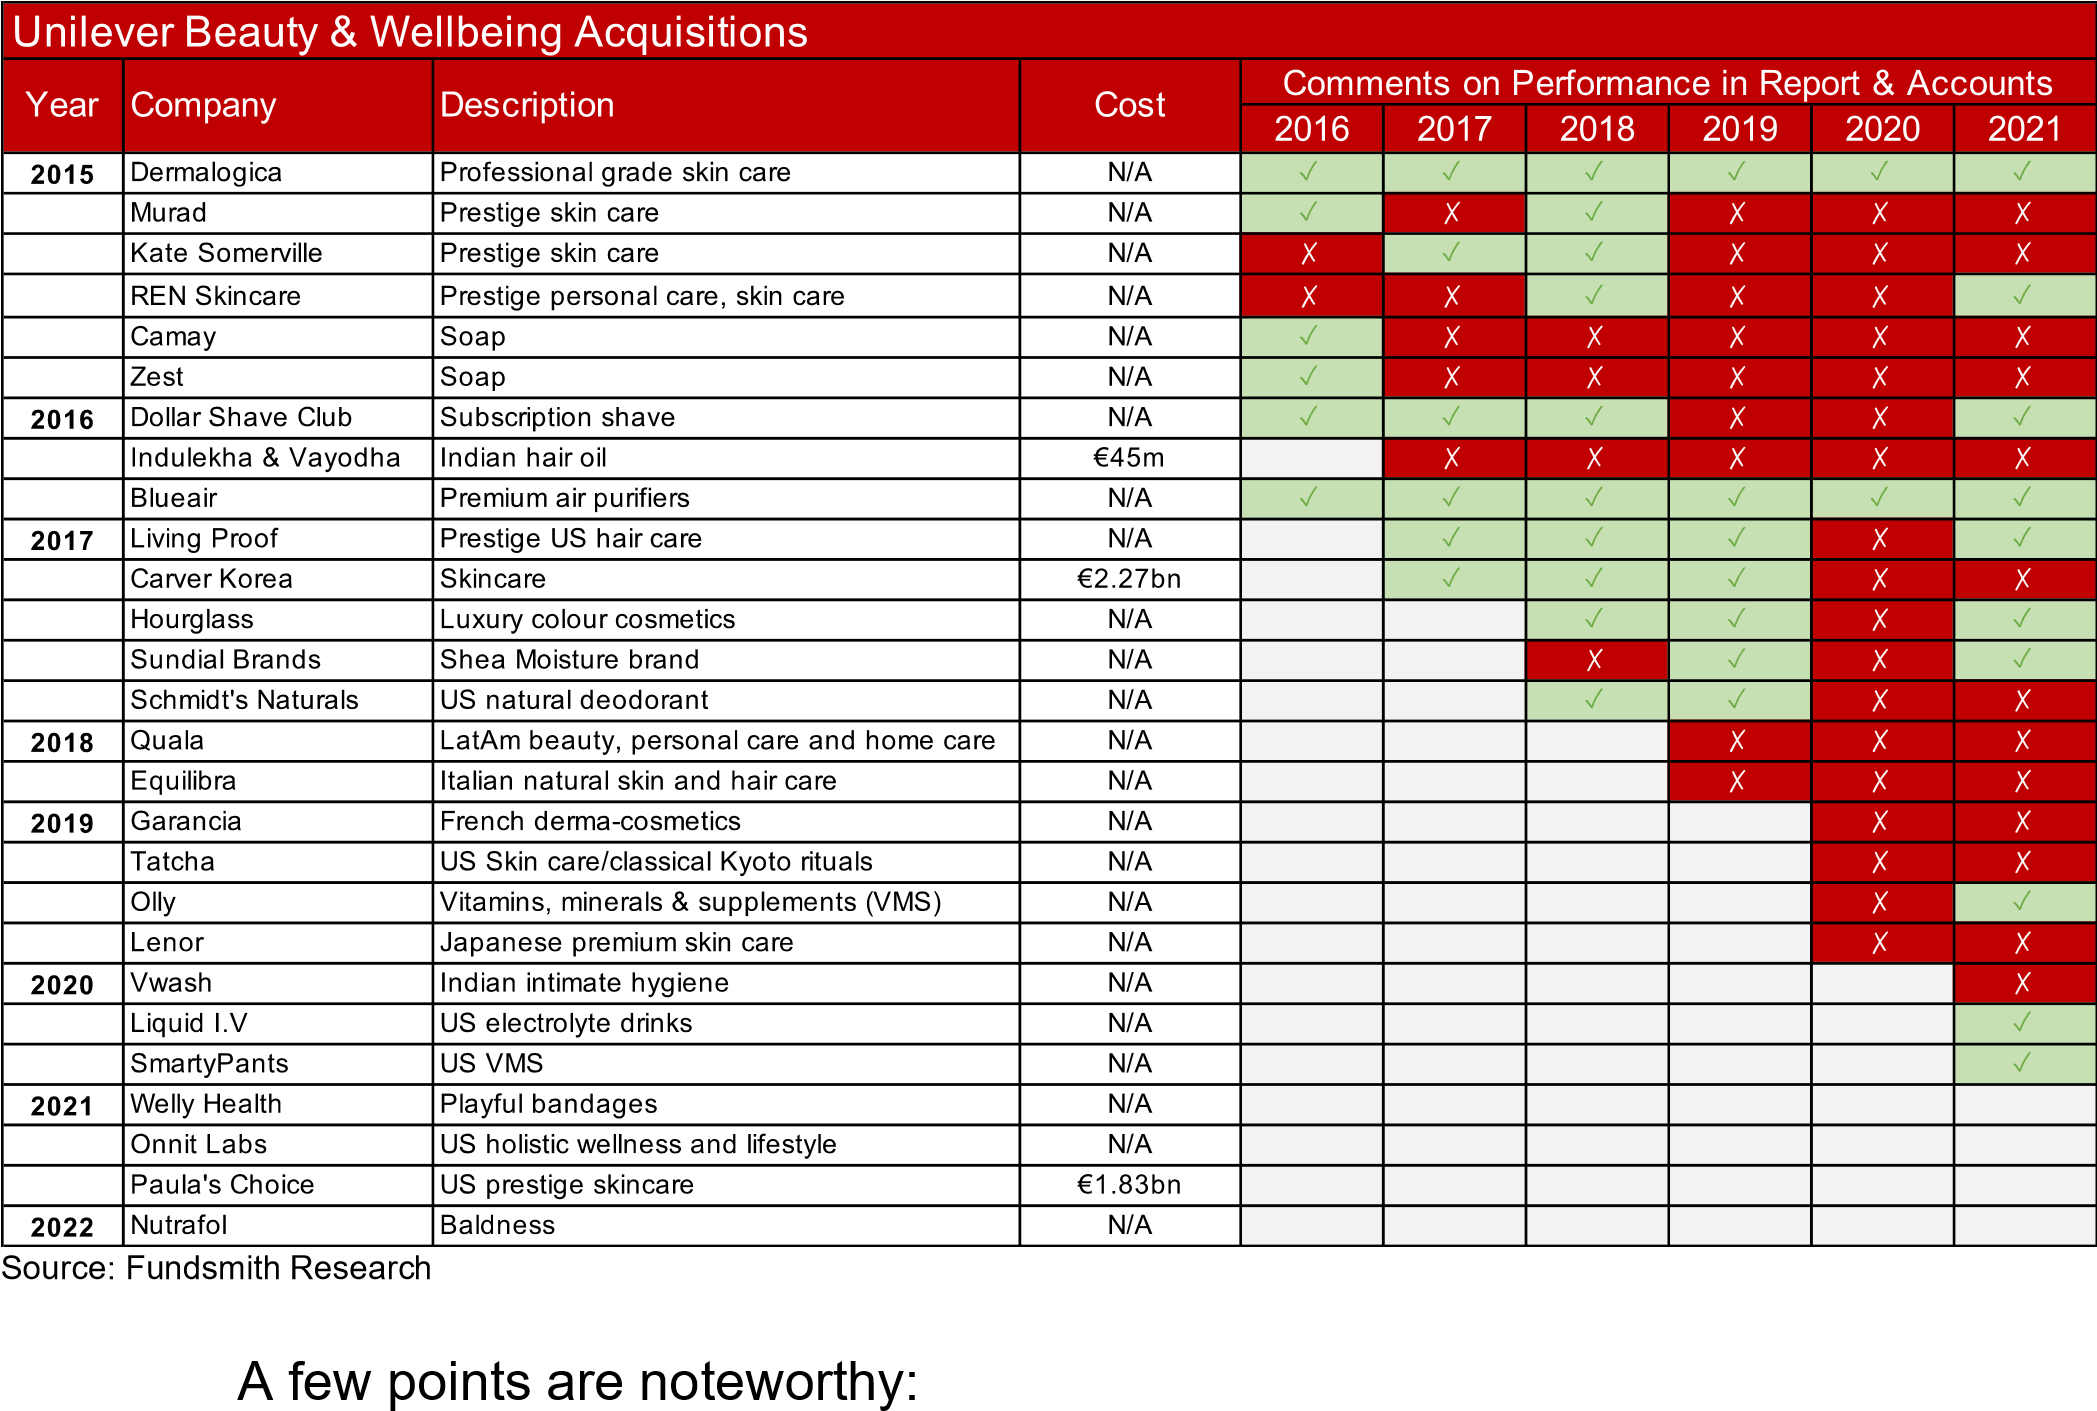
- Considering this is Unilever’s smallest division outside of ice cream they have been very active. Of course they might say that they are trying to build a wellbeing and beauty business by acquisition, but then all the more reason why we shareholders should know how they are performing.
- Yet we were only told the cost in just three out of 27 acquisitions. Whilst I am sure Unilever complied with their disclosure obligations, is there some reason why we shareholders can’t know how much of our money they spent? (If anyone is thinking of responding ‘commercial sensitivity’ could you please have the courtesy to check that I don’t have a mouthful of liquid before you say that?). We are aware from press speculation that Dollar Shave Club cost c.$1 billion and it has sunk without trace.
- The coloured table shows which of these acquisitions were mentioned in subsequent annual reports. It is clearly a minority — only 10 out of 27 in 2021 and in some years like 2020, just two. We have not heard about the Carver Korea acquisition which cost €2.3bn since 2019 (spoiler alert: purchased from Bain Capital and Goldman Sachs). Now call me cynical if you want but I doubt that mention was omitted because they were all performing embarrassingly well.
- You can find sources of information other than the company. This chart of Carver Korea’s sales revenue from Statista says it all:
Revenue of Carver Korea 2015-2021 (Bln Korean Won)
Shouldn’t we have some idea how Unilever and its management have performed before they are allowed to do any more acquisitions? Unilever’s low return on capital might be a clue.
We do not need an information sharing agreement to reach an obvious conclusion. What I am complaining about is the bipolar response some companies have to long-standing shareholders versus newly arrived ‘activists’.
As an investor you might reasonably query why if we had identified the problems at PayPal and Unilever we didn’t just sell the shares and avoid any underperformance. One reason is that we try to be long-term shareholders and when we hold shares in what we consider to be a good business, which we think is underperforming its potential, we like to see if we can help to correct that. After all, it’s easier to change the management than to change the business. However, when we are continually ignored there is another even easier option to sell the shares which we turn to when all other remedies fail.
Returning for a moment to Mayonnaisegate, amongst the outpouring of comments last year were a number of apologists for Unilever who were at pains to point out that the Hellmann’s brand has been growing revenues well and this was proof that ‘purpose’ works. Of course there is no control in that experiment; we don’t know how well it would have grown without the virtue signalling ‘purpose’. It also confuses correlation with cause and effect. There may be a positive correlation between stork sightings and births but that doesn’t prove that one causes the other. Maybe Hellmann’s would be growing as fast or even faster without its ‘purpose’.
To further illustrate the point, this year we are moving on to soap. When I last checked it was for washing. However, apparently that is not the purpose of Lux, the Unilever brand, which apparently is all about ‘Inspiring women to rise above everyday sexist judgements and express their beauty and femininity unapologetically’. I am not making this up; you can read it here.
I will leave you to draw your own conclusions about the utility of this.
One other topic which I want to cover this year is share-based compensation and especially its removal from non-GAAP (Generally Accepted Accounting Principles) profit figures.
Share-based compensation has become an increasingly prominent part of some companies’ expenses in recent years, especially among companies in the Technology sector. If we take for example the 75 companies in the S&P Dow Jones Technology Select Sector Index, share-based compensation expense expressed as a percentage of revenue has gone from an average of 2.2% in 2011 to 4.1% in 2021. This may not seem like much of an increase, but keep in mind that during this period revenue for this set of companies had almost quintupled on average.
There is nothing wrong per se with compensating employees with shares. In fact, there is a legitimate reason for doing so: it may help to align the interests of employees with those of shareholders. I want to focus on how share-based compensation is accounted for or, more accurately, how it is not accounted for in companies’ non-GAAP earnings figures.
Among the 75 companies in the Technology Select Sector Index mentioned above, 45 of them remove share-based compensation from non-GAAP versions of their earnings per share, operating income, or both — in plain English they remove the amount of the debit for share-based compensation which boosts their profits. That is about $26bn of expenses that have been adjusted out in reporting the 2021 profits in the non-GAAP results of these 45 companies.
This amounts to about an average of $600m of share-based compensation for each company which is excluded or added back in reaching their non-GAAP earnings. You will find it as no surprise that all of the companies in the index whose share-based compensation represents greater than 5% of revenue remove share-based compensation from non-GAAP measures.
What are the justifications for removing share-based compensation from measures of income and earnings? A common excuse that companies give for adjusting profits so that the debit for share-based compensation is removed is because it is a non-cash expense.
This argument makes no sense. Plenty of income statement items are partially or entirely non-cash. Depreciation is non-cash, but it still reflects the very real cost associated with a company’s long-lived assets (although many of the same people who adjust out sharebased compensation and many others try to get analysts to focus on EBITDA in order to ignore the inconvenient depreciation and amortisation cost). Deferred income taxes are non-cash but are nevertheless recorded in the P&L account.
Parts of revenue can be non-cash as well, but we certainly don’t see many companies removing them from their results. As long as accrual accounting is the standard, the ‘non-cash’ argument simply does not pass muster. If you want to review cash items, then look at the cash flow statement, not an adjusted P&L account.
Other reasons given for excluding share-based compensation include the fact that the calculation of the expense may use valuation methodologies that depend on assumptions and that the values of the securities given to employees as compensation may fluctuate and are outside a company’s control.
It is true that the expense associated with stock options provided as compensation is calculated using option pricing models, which rely on assumptions for the risk-free interest rate and share price volatility. But other items on a GAAP income statement make significant use of assumptions and estimates as well. Depreciation expense is calculated based on the estimated useful lives of assets, for example.
It is also true that the share price will fluctuate and is outside of a company’s control, but so are many other factors relevant to a company’s operations which can be in the income statement, such as commodity prices which may affect input costs and the value of hedges. The lack of control does not justify their removal from important financial metrics.
Yet another reason proffered for excluding share-based compensation is that it results in double-counting because the shares paid to employees are reflected as both an expense item in the income statement and in the share count that is used as the denominator for per share measures such as EPS.
First of all, it is important to note that this argument applies only to per share metrics such as earnings per share, and hence, it provides no excuse for excluding share-based compensation from measures of gross margin or operating income, which many companies do.
Secondly, by their nature, financial statements have a degree of inter-relation. Many items on the income statement flow back into other parts of the income statement through the balance sheet. If you increase the cash expenses of a company, there will be less cash and/or more debt on the balance sheet. This will in turn affect the income statement by increasing interest expense and/or reducing interest income. Similarly, an increase in share-based compensation expenses will have a secondary impact on the balance sheet in the number of shares outstanding.
We now arrive at a fourth, and perhaps the most nefarious excuse given by companies for removing share-based compensation from their non-GAAP metrics: everybody else does it. This does not make it correct nor is it true. Indeed, it may very well be that the companies that do not adjust their profit numbers from GAAP are put at a disadvantage.
Take the example of Microsoft and Intuit. Microsoft shares are currently being valued at a P/E ratio of 25.0 times the consensus EPS estimate for the fiscal year ending June 2023. Meanwhile, Intuit is being valued at 28.4 times the non-GAAP consensus estimate for the fiscal year ending July 2023. Many investors and analysts may accept that Intuit is trading at a higher multiple given expectations of greater growth potential.
However, Intuit removes share-based compensation from their non-GAAP EPS whereas Microsoft does not. Given that Intuit’s GAAP EPS guidance for the year ending 31st July 2023 is $6.92–$7.22, its non-GAAP guidance is $13.59–$13.89, and the consensus estimate for 2023 EPS is at $13.69, it seems clear that most sell-side analysts are accepting the company’s non-GAAP adjustments, which includes the removal of some $1.8bn of share-based compensation, in their estimates.
If we include the impact of share-based compensation in Intuit’s 2023 EPS to make a more apples-to-apples comparison with Microsoft based upon GAAP EPS, Intuit’s 2023 EPS would be closer to $9, meaning that the shares would be trading at a multiple of about 43 times. I think investors and analysts may find a premium of 14% for Intuit over Microsoft (28.4 times versus 25.0 times) to be reasonable. I’m not so sure they are fully aware that Intuit shares are actually trading at a premium of 73% if share-based compensation is treated in the same manner between the two companies.
Many investors and analysts, including us, look to cash flow metrics more than accrual profits. Unfortunately, share-based compensation may cause distortions in cash flow metrics as well, even when they follow GAAP. Under GAAP, share-based compensation is added back in the cash flow from operating activities, which in turn is used in the computation of free cash flow.
Some researchers and commentators argue that share-based compensation should be reclassified from the operating activities section to the financing activities section of a cash flow statement for analytical purposes. We agree. After all, the decision to fund compensation to employees with shares rather than cash is a financing decision rather than one pertaining to the operations of a company. As such, a measure of cash flow from operating activities that does not benefit from adding back share-based compensation is likely more reflective of the ongoing cash generation of a company.
If we apply this concept to the case of Intuit, it would imply that the company is not in fact trading at a trailing twelve-month free cash flow yield of 3.5% as it seems. Removing $1.5bn of share-based compensation from the $4.1bn of operating cash flow reported in the cash flow statement would leave Intuit’s free cash flow yield much lower, at 2.2%. This example gives a sense of the magnitude of distortion that the accounting for share-based compensation could inflict on free cash flow yields.
However, I suspect the most pernicious effect of adjusting profits to exclude the cost of share-based compensation occurs when the management start to believe their own shtick and mis-allocate capital based upon it. Too often management fail to mention expected returns on capital deployed when they make acquisitions and instead rely on statements about earnings dilution or accretion. We have just been living through an era where interest rates were close to zero.
Statements about earnings dilution or accretion from an acquisition versus the alternative of interest income forgone on the cash do not reflect anything useful. In a period of such low rates the only acquisitions which could be dilutive are those where the money was literally shredded. Amazingly there are some of those too.
Once people start relying upon this spurious measure of whether an acquisition represents value based upon earnings dilution or accretion and combine this with using earnings adjusted by adding back the significant cost of share-based compensation, they can make some gross errors. We suspect this may be part of the reason for Intuit’s acquisition of the online marketing platform Mailchimp in 2021 for $12 billion, half of it in cash.
This represented 12 times Mailchimp’s revenues (not its profits, its sales). As a result Intuit’s return on capital has fallen from 28% in 2020 to just 11% in 2022 but no doubt it is not dilutive to EPS adjusted by adding back share-based compensation. The Intuit CEO described the Mailchimp acquisition as ‘an absolute game changer’. Shareholders must hope he is right and in the way that he meant it.
We have coined a phrase at Fundsmith for this practice of relying upon earnings adjusted to take out the cost of share-based compensation and other real and persistent expenses (such as restructuring costs that keep recurring). Instead of the usual phrase of ‘fully diluted earnings per share’ being earnings per share diluted by all the shares which a company has agreed to issue through options and so on, we refer to these heavily adjusted EPS measures as ‘fully deluded earnings per share’.
Last year in this letter I said I thought we were probably in for an uncomfortably bumpy ride in terms of valuations. We have no idea when the current period of inflation and central bank interest rate rises which caused this prediction to come true will end. It is sometimes said that central bank policy is always either too lax or too tight, it is never exactly right. We need not discuss whether it has been too lax in the past.
Presumably at some point it will become too tight and quite probably tip the major economies into recession. This holds few fears for us. Our companies should demonstrate a relatively resilient fundamental performance in such circumstances, and the only type of market which ends in a recession is a bear market.
What we are clear about is that we continue to own a portfolio of good companies. Where the end of the easy money era has exposed any doubts, and there are always doubts, we have acted upon them and/or aired them in this letter.
Our companies are more lowly rated than they were a year ago, now being rated roughly in line with the market. This does not make them cheap and there is no guarantee that they will not become more lowly rated, but our focus is on their fundamental performance, as it should be, because in the long term that will determine the outcome for us as investors.
I will leave you this year with a quote from Winston Churchill:
‘If you are going through hell, keep going’.
At Fundsmith we intend to.
Finally, may I wish you a happy New Year and thank you for your continued support for our Fund.
Yours sincerely,
Terry Smith, CEO, Fundsmith LLP
|
Fundsmith LLP is authorised and regulated by the Financial Conduct Authority. Registered in England & Wales: OC354233. Registered office: 33 Cavendish Square, London, W1G 0PW. Disclaimer: A Key Investor Information Document and an English language prospectus for the Fundsmith Equity Fund are available via the Fundsmith website or on request and investors should consult these documents before purchasing shares in the fund. Past performance is not necessarily a guide to future performance. The value of investments and the income from them may fall as well as rise and be affected by changes in exchange rates, and you may not get back the amount of your original investment. Fundsmith LLP does not offer investment advice or make any recommendations regarding the suitability of its products. This document is a financial promotion and is communicated by Fundsmith LLP which is authorised and regulated by the Financial Conduct Authority. Sources: Fundsmith LLP & Bloomberg unless otherwise stated. Data is as at 31st December 2022 unless otherwise stated. Portfolio turnover is a measure of the fund’s trading activity and has been calculated by taking the total share purchases and sales less total creations and liquidations divided by the average net asset value of the fund. P/E ratios and Free Cash Flow Yields are based on trailing twelve month data and as at 31st December 2022 unless otherwise stated. Percentage change is not calculated if the TTM period contains a net loss. MSCI World Index is the exclusive property of MSCI Inc. MSCI makes no express or implied warranties or representations and shall have no liability whatsoever with respect to any MSCI data contained herein. The MSCI data may not be further redistributed or used as a basis for other indices or any securities or final products. This report is not approved, reviewed or produced by MSCI. The Global Industry Classification Standard (GICS) was developed by and is the exclusive property of MSCI and Standard & Poor’s and ‘GICS®’ is a service mark of MSCI and Standard & Poor’s. |
Editor’s Note: The summary bullets for this article were chosen by Seeking Alpha editors.
Editor’s Note: This article discusses one or more securities that do not trade on a major U.S. exchange. Please be aware of the risks associated with these stocks.
Be the first to comment