

lisegagne/E+ via Getty Images
Investors who are on the lookout for a passable mix of value and quality in an equity portfolio, probably with a layer of defensiveness on top, could take a closer look at the First Trust Nasdaq Food & Beverage ETF (NASDAQ:FTXG). This is not the best-of-breed food & beverage ETF, with a few nuances under the hood, principally regarding valuation, yet it does deserve a closer inspection by investors who would like to hedge against a possible recession with a portfolio of companies enjoying inelastic demand.
Today, I would like to provide an assessment of its investment strategy, factors it is most exposed to at the moment, returns it clocked in the past and why, and other pivotal matters essential for understanding whether FTXG should be considered at the current price or not. Let us dig in.
What is specific about FTXG’s investment strategy?
FTXG’s investment strategy is based on the modified factor-weighted Nasdaq US Smart Food & Beverage Index. The index follows an annual reconstitution and quarterly rebalancing schedule.
Using the food & beverage securities from the Nasdaq US Benchmark Index as the selection universe, the index provider whittles the list down to only the most liquid names and then decides which weight each one deserves depending on a combination of volatility, value, and growth characteristics. The volatility factor is essentially a function of the TTM price fluctuations. The value factor relies on the Cash flow/Price ratio (we will be taking a closer look at this metric shortly), a nicely selected metric useful for the analysis of the consumer staples companies, I should note. The growth factor here is not a revenue- or net income-mindful parameter; it is indicative of momentum as it is based on the average price return over three, six, nine, and twelve months.
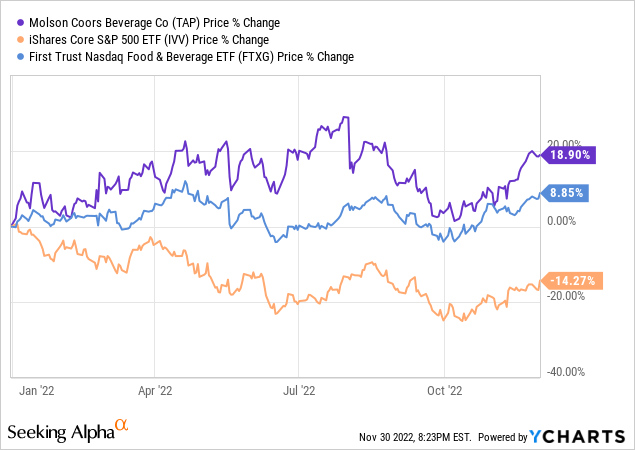
The result is an FTXG portfolio of 30 holdings as of November 25, with the key ten stocks sporting weight close to 60%. The weighted-average market capitalization is at about $49 billion, as per my estimates. This figure reflects an insignificant presence of small- and mid-caps of about 8.7%. Also, since the underlying index is factor-weighted, mega-caps have only a modest share of the net assets, of around 8% allocated to PepsiCo (PEP) and Coca-Cola (KO). Regarding industries, food products are the main one with 56.7% weight, followed by soft drinks with 13.4%. Distillers & vintners are underweighted, with 72 bps allocated, represented only by the B class shares in Brown-Forman Corporation (BF.B).
The largest holding currently is Molson Coors Beverage Company (TAP), a brewer with around $10.7 billion in LTM sales. TAP does not have an eye-catching growth story, with a forward revenue growth rate of a modest 4.2% and forward EPS growth at just 1.8%, both behind the sector medians. Yet the stock has been in the limelight this year, delivering a close to 19% return, a result nothing short of phenomenal amid the raging bear market, thanks to strong investor interest in recession-proof beverage plays.
Reasons for skepticism: quality, defensiveness premia compress yields
The essential issue I see with this ETF is that the quality and defensiveness premia (and size, to some extent) naturally hinder the fund from achieving an attractive valuation. Another way of saying, even during slack periods for defensive equities when investors are chasing growth regardless of valuation, they might be modestly overpriced anyway.
Yet in fact, if taken correctly, a comparatively better-priced food & beverage equity portfolio could still be distilled. The Invesco Dynamic Food & Beverage ETF (PBJ) that we discussed in June is an example worth mentioning.
Anyway, a balance of profitability and value is not what FTXG has achieved.
Its portfolio is tilted towards strong quality stories, with over 88% allocated to companies with a B- Quant Profitability rating or better. The above-mentioned KO and PEP are unrivaled, boasting A+ ratings.
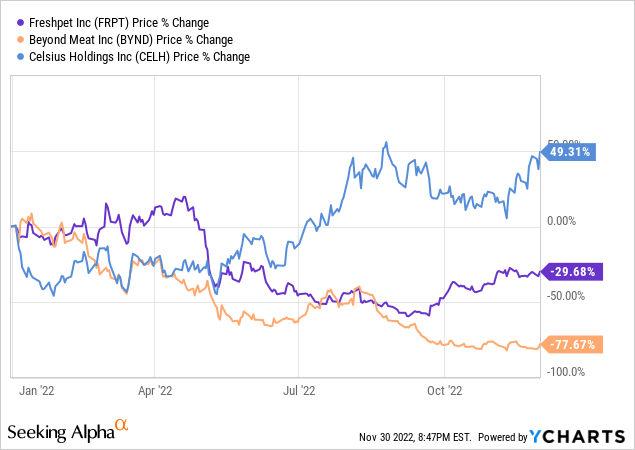
Delving deeper, there are just three EBITDA-negative companies in this portfolio, namely Beyond Meat (BYND), Freshpet (FRPT), and Celsius Holdings (CELH), accounting for just 2.3%. For BYND and FRPT, lackluster quality was likely among the culprits of their steep decline in 2022, yet not for CELH.
Next, only three companies failed to deliver the TTM operating cash flow, unsurprisingly, BYND and FRPT, and also Bunge (BG).
There is something to dislike when it comes to the balance sheets, as over a half of FTXG’s holdings have a Total debt/EBITDA ratio above 3x, yet I believe this does not pose a serious threat to returns owing to sector-leading (as illustrated by the Quant Profitability ratings) margins and capital efficiency profiles of the stocks (hence, strong self-sufficiency and lower dependence on external financing), which counterbalance a comparatively high level of borrowings.
Unfortunately, due to the overall resilient quality profile, FTXG scores poorly against value indicators. First, its weighted-average Enterprise Value/Sales is over 3x, not a level I like. The debt-adjusted earnings yield is only 5.9%. The reason why I believe profitability is the likely culprit is that the weighted-average revenue growth is approximately 8.6%, as of my estimates, so it is unlikely growth expectations have meaningfully influenced valuation. Next, the WA Cash flow/Price ratio, which I promised to address, is at 22.5x. The earnings yield is, uncoincidentally, at only 3.9% vs. around 5.2% of the iShares Core S&P 500 ETF (IVV).
Finally, the Quant Valuation grade, essentially a composite of a variety of relevant metrics compared to the company’s historical averages and the sector medians as well, for about half of FTXG’s holdings is D or worse. Stocks with value characteristics account for just 14% (B- and better), principally thanks to BG which has a 7.9% weight. For context, only ~38% of PBJ’s holdings are overvalued, while close to a quarter are priced attractively.
Final thoughts
I am constructive on FTXG, though with caveats.
The major advantage of the ETF is a portfolio of defensive names benefitting from inelastic demand, something undoubtedly of value as we are approaching 2023, with recession risks still not abating amid the wildcard of inflation, though the markets are feeling exceedingly enthusiastic about the soft-landing scenario. This scenario is bullish for the growth echelon and bearish for value & defensive plays.
The ETF has already demonstrated this year that it is capable of easily shrugging off the headwinds stemming from higher rates and subsequently lower risk appetite, capitalizing on them instead, benefiting from investor dollars flowing out of growth stocks to those offering an aura of comparative safety and resilience. The flip side is premium valuation, alas. For investors seeking cheaper portfolios, PBJ is a slightly better pick in this regard.
Apart from that, food & beverage equities are not perennial outperformers as dovish periods (e.g., 2020) were barely supportive of their alpha.
To corroborate, incepted in September 2016, FTXG delivered a CAGR of just 6.88% during the October 2016 – October 2022 period, underperforming IVV by about 5.6% and PBJ by 56 bps, even though it has easily outshined the market this year. Risk-adjusted returns were also much softer than those of the market as illustrated by the Sharpe and Sortino ratios.
| Portfolio | FTXG | IVV | PBJ |
| Initial Balance | $ 10,000 | $ 10,000 | $ 10,000 |
| Final Balance | $14,905 | $20,272 | $15,377 |
| CAGR | 6.88% | 12.50% | 7.44% |
| Stdev | 15.34% | 16.81% | 14.29% |
| Best Year | 23.98% | 31.25% | 26.57% |
| Worst Year | -12.09% | -17.75% | -11.19% |
| Max. Drawdown | -21.74% | -23.93% | -20.51% |
| Sharpe Ratio | 0.44 | 0.72 | 0.5 |
| Sortino Ratio | 0.68 | 1.08 | 0.77 |
| Market Correlation | 0.68 | 1 | 0.74 |
Created by the author using data from Portfolio Visualizer
So when the Fed finally pauses hikes and then starts cutting, likely at some point in 2023, FTXG and similar ETFs will become suboptimal allocations.
All in all, while appreciating the fund’s factor-centered strategy, I recommend investors do their own due diligence to decide whether they are content with a mix of quality and value hiding under the hood of this ETF, assigning a Hold rating for now.
Be the first to comment