

djgunner
Introduction
Bermuda-based Frontline Ltd. (NYSE:FRO) reported its second-quarter 2022 results on August 25, 2022.
Important note: This article is an update of my article published on July 09, 2022. I have been following FRO on Seeking Alpha since 2015.
The company indicated that as of June 30, 2022, its fleet consisted of 68 vessels, with an aggregate capacity of approximately 12.5 million DWT:
- 64 vessels owned by the Company (19 VLCCs, 27 Suezmax tankers, 18 LR2/Aframax tankers)
- Four vessels that are under the Company’s commercial management (two Suezmax tankers and two Aframax tankers)
- The company’s fleet has scrubbers installed on about 65% of the total fleet.
As of June 30, 2022, the Company’s owned fleet included 32 scrubber fitted vessels (13 VLCCs, 19 Suezmax tankers). Scrubber installations were completed on two additional owned LR2/Aframax tankers in August 2022. Additional scrubber installations are planned on five owned vessels in 2022 (three VLCCs and two LR2/Aframax tankers) and one owned VLCC in 2023. Following these scrubber installations and including the four scrubber-fitted vessels to be delivered under our newbuilding program, 65% of our fleet will have scrubbers installed.
1 – 2Q22 results snapshot
Frontline reported a net income of $47.1 million, or $0.23 per diluted share, for the second quarter of 2022, compared to a loss of $26.63 million or $0.14 per share in 2Q21. The adjusted net income was $42.5 million, or $0.21 per diluted share, for the second quarter of 2022.
The company said that the 2Q22 was a “shoulder quarter” regarding oil demand, with Russia being the catalyst. The company sees a bright future.
FRO 2Q22 Highlights (Frontline Ltd.)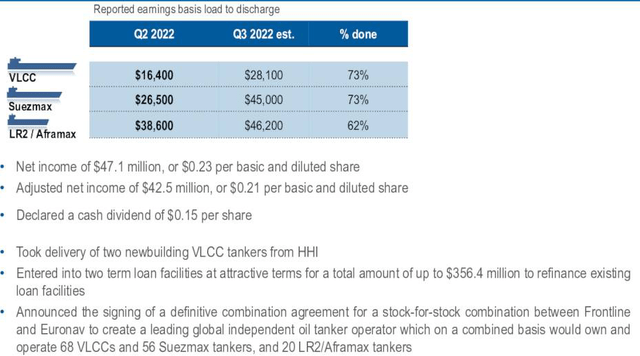
Furthermore, Frontline reported total operating revenues of $300.44 million for the second quarter of 2022 compared to $170.02 million in 2Q21.
Frontline Ltd declared a cash dividend of $0.15 per share for the second quarter of 2022.
Finally, Frontline Ltd announced the signing of a definitive combination agreement on July 11, 2022, for a stock-for-stock combination between Frontline and Euronav NV (EURN) to create a leading global independent oil tanker operator with 146 vessels, including 68 Very Large Crude Carriers (VLCCs).
The combined company will be held roughly 55% by existing Euronav shareholders and 45% by existing Frontline shareholders, assuming all Euronav shares are tendered in the tender offer.
Lars H. Barstad, Chief Executive Officer of Frontline Management AS, said in the press release:
Frontline’s fleet of LR2 tankers took center stage in the second quarter of 2022 during which period we achieved the highest quarterly TCE we have recorded on this vessel class. Sanctions on Russian oil and other products disrupted trade lanes for refined products globally, causing both refinery margins and freight rates to rise. Crude oil transport has also been affected, and Suezmax tankers have seen increased utilization and freight rates, throughout the second quarter.
FRO Average daily time charter equivalent 2Q22 (Frontline Ltd.)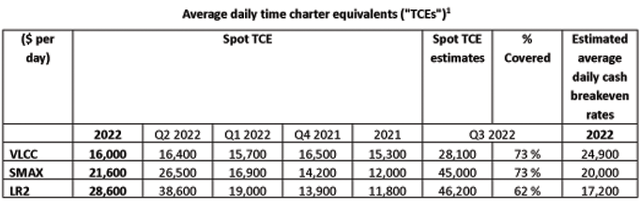
In the second quarter, Frontline achieved $16,400 per day on the VLCC, $6,500 per day on the Suezmax fleet, and a whopping $38,600 per day on the LR2/Aframax fleet (see table above).
So far, in the third quarter of 2022, FRO booked 73% of its VLCC days at $28,100 per day, 73% of Suezmax days at a solid $45,000 per day, and 62% of our LR2/Aframax days at $46,200 per day.
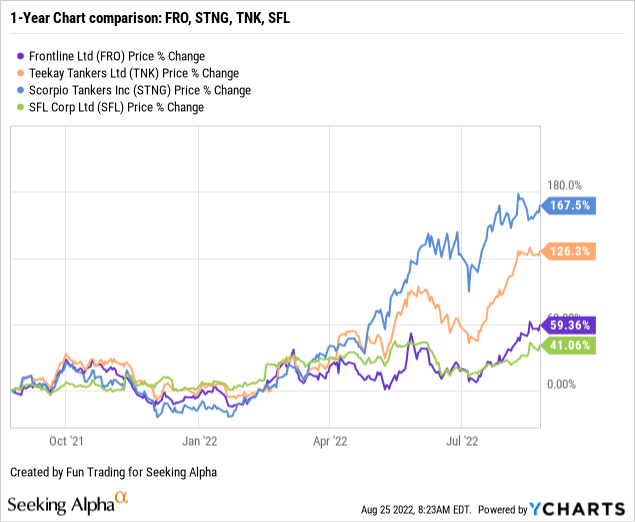
2 – Stock Performance
Frontline and SFL Corp. (SFL) have underperformed their peers below and are up 59% and 41% on a one-year basis, whereas Scorpio Tankers (STNG) and Teekay Tankers (TNK) show a tremendous uptrend.
Note: I recommend reading my recent article on SFL, published on August 19, 2022, by clicking here.
4 – Investment thesis
The tankers market remains highly unpredictable, and investing a considerable amount of your cash in this segment is not recommended due to the risk involved.
However, I consider FRO an excellent trading tool due to its high volatility. It is tempting to keep a medium long-term position, especially after the merger between FRO and EURN, which creates a more stable and reliable company in the tankers segment with room for significant synergies.
FRO Presentation (Frontline Ltd.)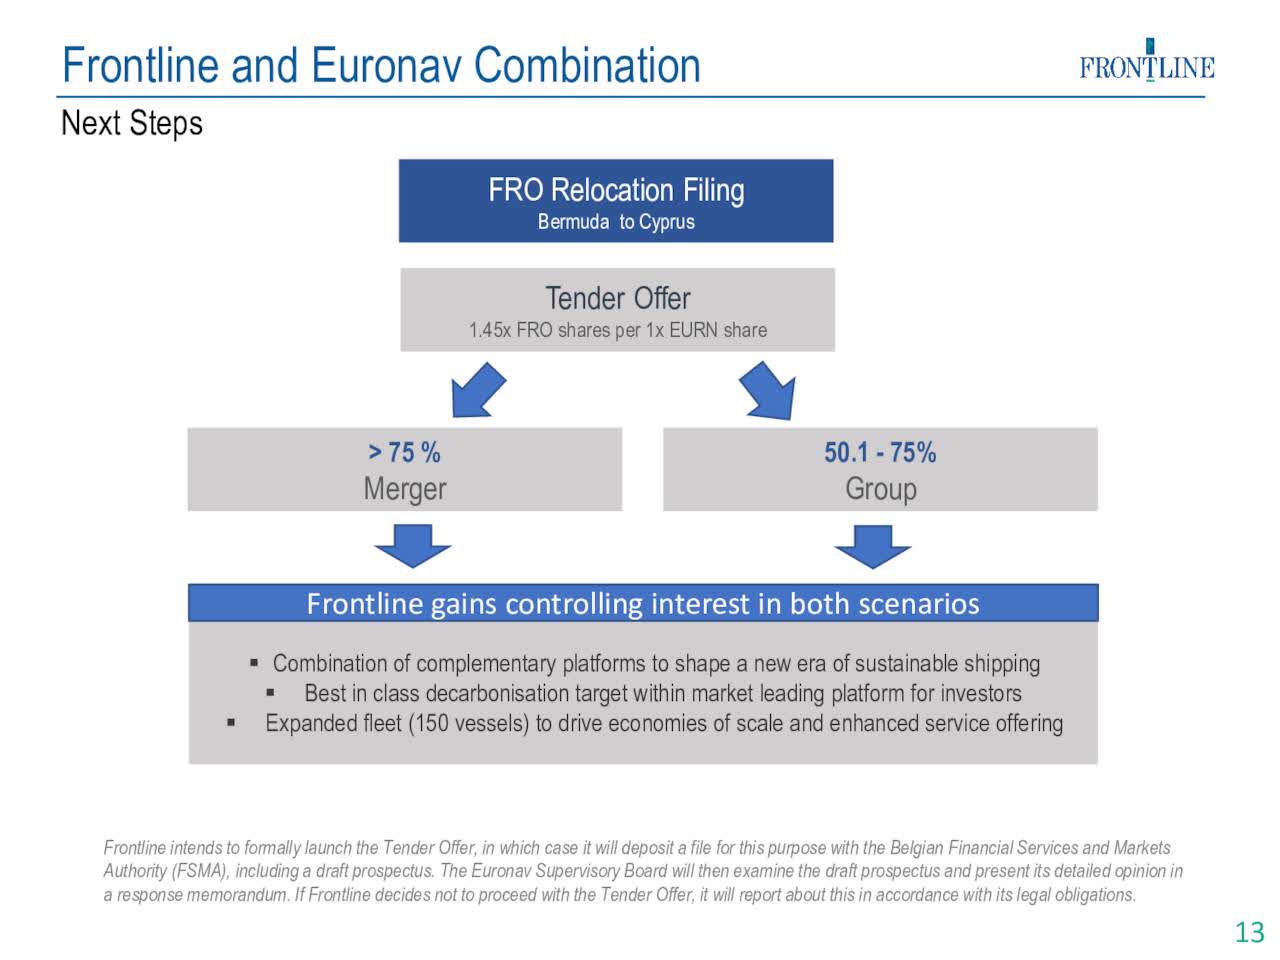
According to Hellenic Shipping news:
Spot charter rates for uncoated tankers were very disappointing in 1Q22, then fluctuated wildly in 2Q22, and are again very strong in 3Q 2022.
Indicative 1-year timecharter rates in Jul 2022 were being estimated at about 20,250 USD/day for a VLCC tanker ; 23,375 USD/day for a Suezmax ; and 23,100 USD/day for an uncoated Aframax.
FRO has performed well this quarter, and the outlook points to better rates. However, tanker rates have always been unpredictable, even if the near-term outlook looks encouraging.
CEO Lars Barstad said in the conference call:
The time charter market has almost erupted over the last month. The time charter of the period market is an old school bellwether for large oil transporters expectations. These are, as we referred to as the big guys, the Shells, the Equinors, the BPs, the Chevrons, the big boys in the game that have equity crude have substantial transportation needs are in the market, all of them for up to 3-year commitments on time charters. And to them – even for them, a 3-year commitment is significant. We have seen earlier kind of in the reporting season, even 5-year charters being concluded.
This recent uptrend was driven primarily by the impact of the ongoing Ukraine conflict. The midsize tankers segment benefitted the most due to disruptions in oil trading patterns.
Thus, I continue to recommend primarily using FRO as a trading vehicle but also keeping a medium long-term position expecting a massive rebound in the sector. The idea is to keep a core position and trade short-term LIFO.
Frontline Ltd. – The Raw Numbers: Second-Quarter Of 2022 And Financials History
| FRO | 2Q21 | 3Q21 | 4Q21 | 1Q22 | 2Q22 |
| Total Revenues in $ Million | 170.02 | 171.83 | 213.55 | 217.44 | 300.44 |
| Net Income in $ Million | -26.63 | -33.21 | 19.79 | 31.15 | 47.10 |
| EBITDA $ Million | -12.0 | -17.97 | 41.25 | 48.10 | 66.04** |
| EPS diluted in $/share | -0.13 | -0.17 | 0.10 | 0.15 | 0.23 |
| Operating cash flow in $ Million | 29.22 | -3.53 | 25.24 | 17.34 | 65.17 |
| CapEx in $ Million | 137.65 | 36.85 | 243.57 | 11.19 | 148.45 |
| Free Cash Flow in $ Million | -108.43 | -40.38 | -218.33 | 6.15 | -83.28 |
| Total cash $ Million | 143.03 | 124.95 | 115.51 | 113.88 | 286.00 |
| Long-term Debt in $ Million | 2,217.9 | 2,258.2 | 2,316.2 | 2,230.8 | 2,328.4 |
| Quarterly Dividend $/share | 0 | 0 | 0 | 0 | 0.15 |
| Shares Outstanding (Diluted) in Million | 197.82 | 198.03 | 202.45 | 203.53 | 206.97/222.62* |
Source: Frontline material
* The weighted average number of shares outstanding for the purpose of calculating basic and diluted earnings per share for the second quarter of 2022 was 206,964,570, which includes the impact of the 19,091,910 Frontline shares to be issued to Hemen in connection with the privately negotiated share exchange transactions with Euronav shareholders. Following the issuance of the 19,091,910 Frontline shares to Hemen, expected to be completed in August 2022, the Company will have a total of 222,622,889 shares issued and outstanding.
** Estimated by Fun Trading.
Note: More data are available to subscribers only.
Analysis: Total Operating Revenues, Earnings Details, Free Cash Flow
1 – Operating Revenues were $300.44 million in 2Q22
FRO Quarterly revenues history (Fun Trading)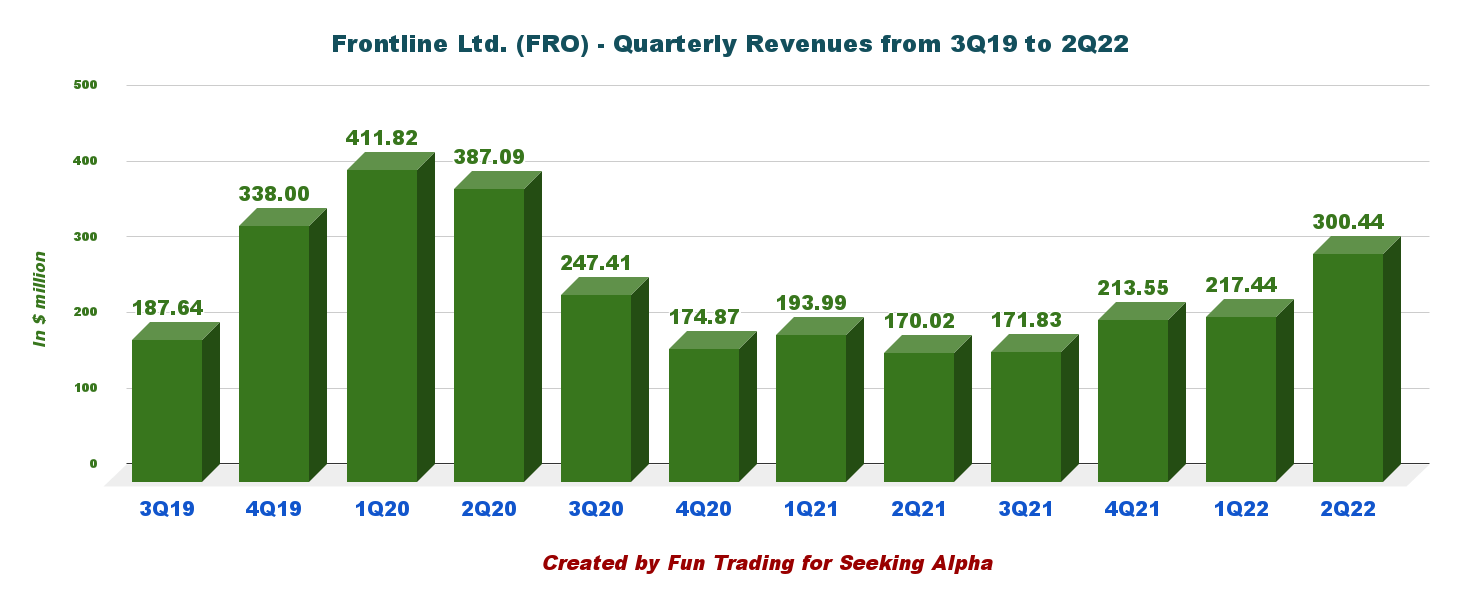
Frontline announced record revenues of $300.44 million for the second quarter of 2022 (see chart above).
The company posted a net income of $47.10 million, or $0.23 per diluted share, for the second quarter of 2022 and an adjusted net income of $42.5 million, or $0.21 per diluted share, compared with an adjusted net loss of $1.6 million in the previous quarter.
CEO Lars Barstad said in the conference call:
We are seeing highly inefficient trading patterns developing and this to the benefit of oil in transit and utilization, as you can see on the graph at the bottom right. Towards the end of the second quarter, we saw all Frontline asset classes, including the VLCC start to move up. Asian and in particular, Chinese demand was still subdued, but current level of activity paints an interesting picture for future starts to come.
2 – Free cash flow was a loss estimated at $83.27 million in 2Q22
FRO Quarterly Free cash flow (Fun Trading)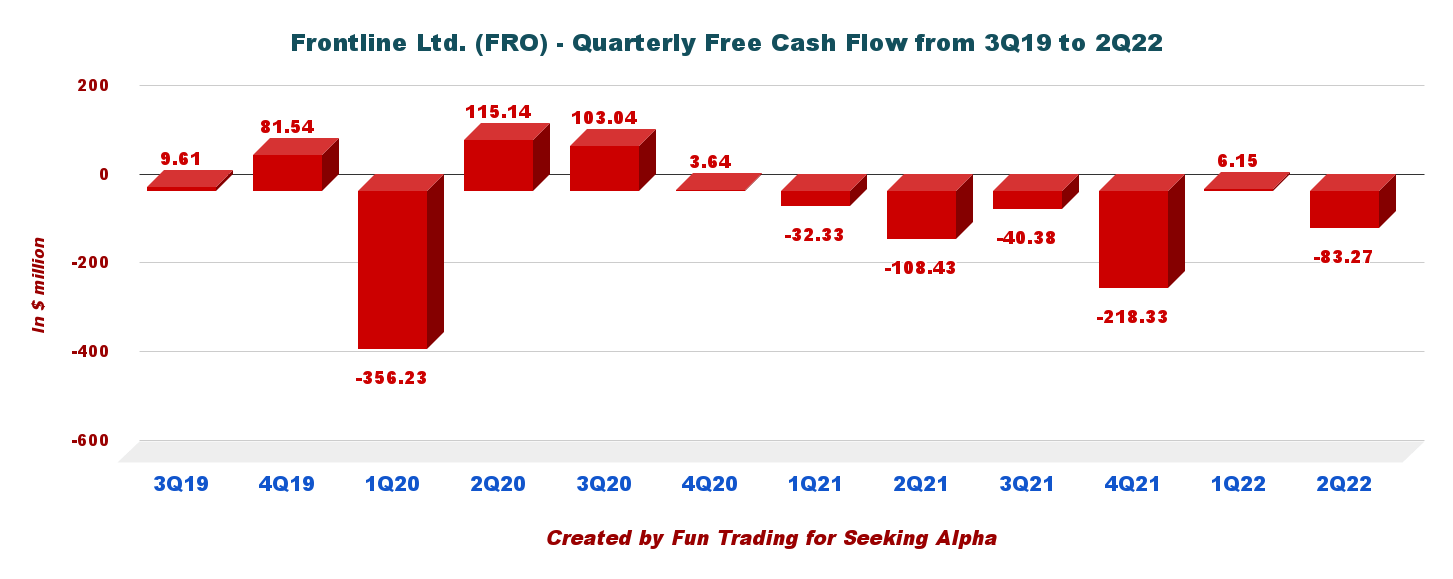
Note: Generic free cash flow is cash from operation minus CapEx.
Trailing 12-month free cash flow is estimated at a loss of $335.84 million, with a loss estimated at $83.27 million in 2Q22.
As a reminder, FRO stopped paying dividends starting in 3Q20. However, the company decided to restart its dividend payment this quarter and declared a cash dividend of $0.15 per share for the second quarter of 2022.
3 – Debt analysis: Net debt is estimated at $2.03 billion in 2Q22 (consolidated and including current)
FRO Quarterly Cash versus Debt (Fun Trading)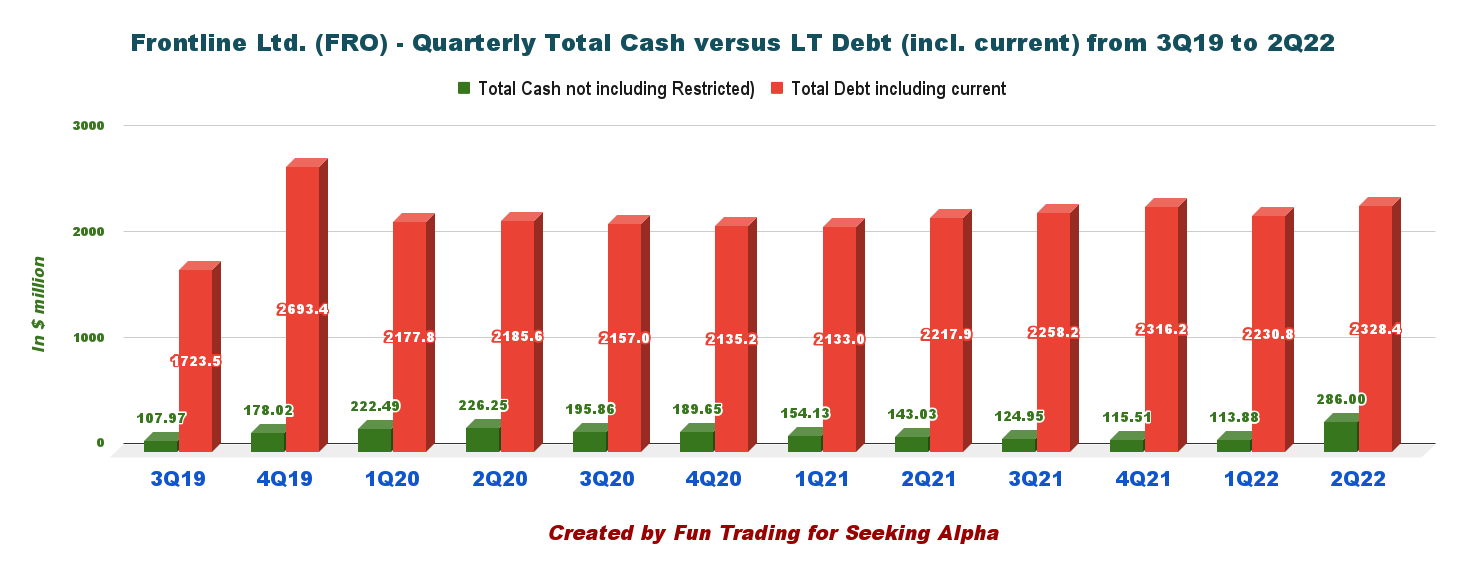
As of June 30, 2022, total cash was $296.00 million, and long-term debt, including current, was 2,328.4 million.
Technical Analysis And Commentary
FRO TA Chart (Fun Trading)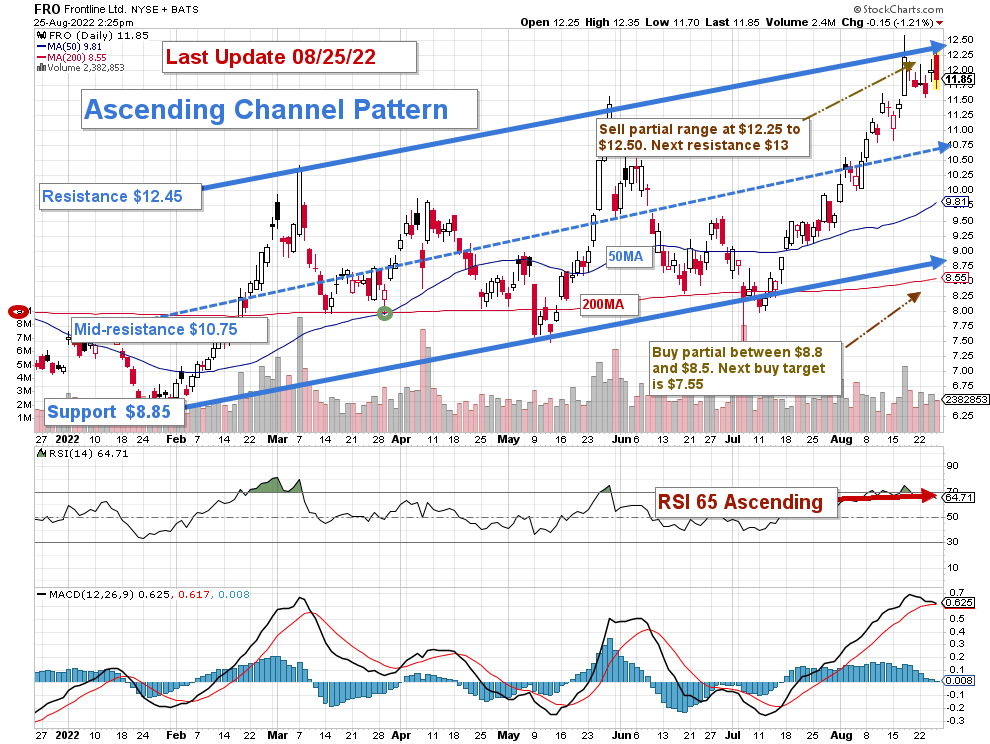
Note: The chart is adjusted for the dividend.
FRO forms an ascending channel pattern with resistance at $12.45 and support at $8.85. An ascending channel is generally a bullish signal.
The short-term trading strategy is to trade LIFO about 50%-60% of your position and keep a core long-term position for a much higher payday.
I suggest selling between $12.3 and $12.5 and waiting for a retracement between $10.75 and $8.85 with potential lower support at $7.55.
If the market turns bullish as expected, FRO could break out and reach $13.8-$14.5.
Note: The LIFO method is prohibited under International Financial Reporting Standards (IFRS), though it is permitted in the United States under generally accepted accounting principles (GAAP). Therefore, only US traders can apply this method. Those who cannot trade LIFO can use an alternative by setting two different accounts for the same stocks, one for the long term and one for short-term trading.
Warning: The TA chart must be updated frequently to be relevant. It is what I am doing in my stock tracker. The chart above has a possible validity of about a week. Remember, the TA chart is a tool only to help you adopt the right strategy. It is not a way to foresee the future. No one and nothing can.
Author’s note: If you find value in this article and would like to encourage such continued efforts, please click the “Like” button below as a vote of support. Thanks.
Be the first to comment