

Maneeta Chauyrod/iStock via Getty Images
By Rob Isbitts.
I spent part of December 26, “Boxing Day,” hoping to identify some great long-term buys, based on analysis of chart pattens of every stock in the S&P 500. I failed. Boxing day threw me a left hook. Let me explain why.
After a full year of broad stock market weakness, I thought that, as in past cycles, a big group of deeply-undervalued stocks from a technical perspective would be easy to find. Now, I tend to be pretty tough grader. I spent most of my career managing money for a very homogeneous group of high net worth families, and they were risk-averse. I am also the son of a guy who grew up in New York City during the Great Depression, so the concept of “risk-management, then return-seeking” investing is something I was essentially born with.
But bear markets, like bull markets, don’t last forever. And, while my view into 2023, as it has been throughout 2022, is unfavorable toward most of the equity market, the best thing an investor can do is try to make a strong case that they are wrong…before they are very wrong. So, I went looking where so much money is invested: the S&P 500 Index (SP500). All 500 stocks. And, using both daily and weekly price charts and my favorite short-list of technical indicators, as I have for a long time.
This analysis should be viewed in the context in which it was performed. I was not looking to put “buy-sell-hold” ratings on each stock. Instead, I was looking across the market and sectors, and down to individual stocks, for stocks with high reward potential over the next 6-12 months, but which did not carry what I believe to be high risk, or even average risk. In other words, I wanted to have my cake and eat it too.
I also went looking for signs of danger. I define that as a stock chart pattern that exhibits high risk of loss (a drop of 15% or more), and without an equal chance of posting a big gain. After all, many investors are OK with high risk/high return propositions.
I’ve performed this exercise many times in the past, but have never written about it publicly until now. This seemed like the ideal time to do it.
Broad conclusions
1. There are virtually no “slam dunk” buys.
2. There is a moderate amount of stock that I’d put in the “teetering” category. That is, they are hanging by a thread, such that another little push down in price will put them in clear downtrends. For these stocks, the market’s performance in early 2023 could be crucial. After all, if we get a rough start to the year, there’s a good chance all sectors and most industries will be part of the mess. That’s how it goes when trading range markets like the we’ve had for the past 6 months finally makes up its mind, and heads lower.
3. There are some stocks I’d consider buy-able, but they are few and far between. So, based on #2 above, they too are best characterized as being OK as long as the broad market continues to at least tread water.
4. There are some cross-sections of the S&P 500 that looks simply awful. Remember my investment rule to live by: any investment can go up in price at any time. So in these cases, it not that they are “sell immediately,” but rather are situations with high-risk of major loss. That makes their reward potential, whatever it is, worth putting off.
5. The biggest group of stocks were those that just look downright uninteresting. In other words, they definitely don’t look bullish, but they are also not yet what I’d consider decidedly bearish.
My bottom-line: as a whole, this looks like a market that can better be described as weak than a budding catastrophe. Translation: it is hard to buy stocks as a broad portfolio exposure, and it seems just a matter of time before we’ll have another leg lower.
The S&P 500 Index looks worse than the average stock, as you will see from some of my comments below. Equity exposure is not something that has to be avoided (though mine is essentially net-zero right now), but expecting a major bull market to break out any time soon is a very high-risk proposition. I have a strong suspicion that the first quarter of 2023 will sort out a lot of this.
OK, those are the generalizations. Now, here are some representative charts. I identified 5 general groups of stock chart patterns, and chose 1 stock to represent what many other stocks look like in that group. I didn’t use my usual fancy chart presentation, as the YCharts version imbedded in Seeking Alpha’s contributor center do a nice job of helping you visualize what I’m writing about here, without so much “noise” in the chart.
And, based on what I read in the comments section following the publishing of this article, I am up for doing a more specific follow-on piece if demand warrants.
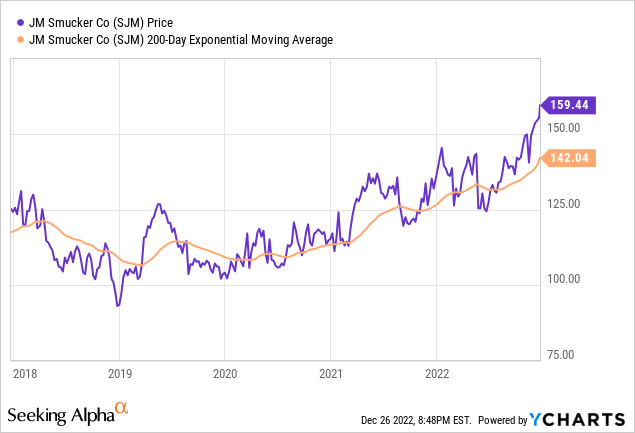
1. Looking better than most
Who doesn’t like peanut butter and jelly? J.M. Smucker (SJM) is still rallying and recently equaled its 2016 high, after a very long climb higher. What to watch for: when even the strongest stocks falter, the bear market is running into its next phase.
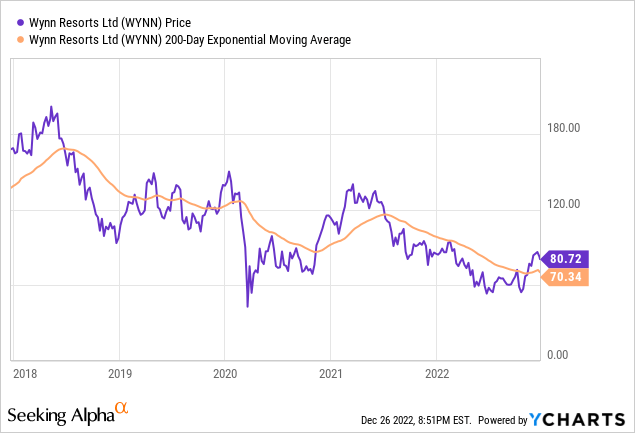
2. Teetering, but not in a strong trend either way
Wynn Resorts (WYNN), like many leisure companies, had a resurgence following the Covid reopening. But that phase is tiring, and consumer balance sheets are getting thin again. WYNN had a nice pop, but its longer-term trend is now teetering on taking over again. Not done deal, but getting there. Q1 will tell us.
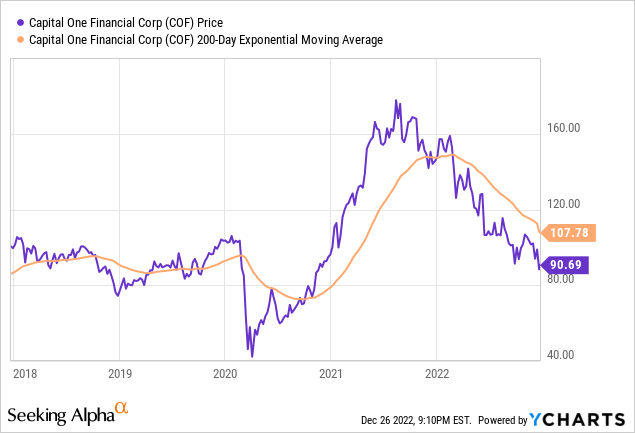
3. In solid bearish trend
I know that according to many investment experts, we are not on the verge of another 2008 financial crisis. I don’t know about that, but I do know that there are many financial sector charts that look like this. In particular, it is companies like Capital One (COF), who lend to consumers (credit cards) that show severe and continued technical weakness. COF has been cut in half since August of 2021. But you know what? A stock can fall 50% over and over and over, and still not hit zero.
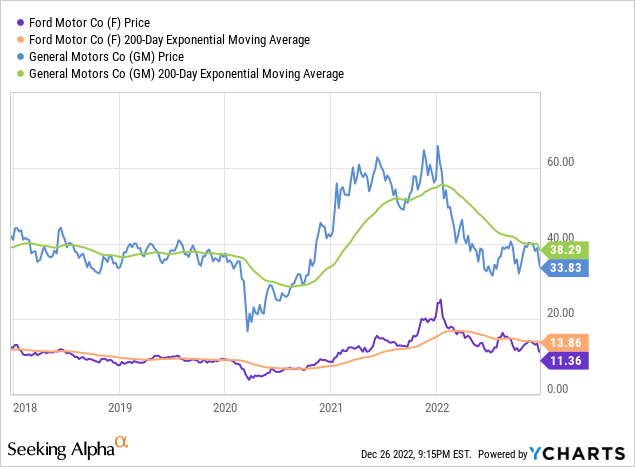
4. Look worse than bad (watch out)
Here’s a 2-for-1. The big 2 U.S. auto companies, Ford (F) and General Motors (GM). Their stocks are down big and look lower, barring some type of dramatic turnaround that is not yet evident in the price patterns. The fundamental translation: weaker consumer spending in 2023, as the slew of Fed rate hikes make their way into people’s lives. And that pandemic-era stimulus is largely spent, prompting the same old/same old weakness in consumer balance sheets.
As always, while I’m a chartist at heart, the chart is the last step in the process. It helps you decide what to buy, sell, hold or ignore at a certain price and point in time. What precedes that is a process of determining what set of securities you are willing to own, if its price and price pattern give you the “go” signal.
5. Stock market icons that look particularly vulnerable
Representing the FAANG stocks, here is one of them. This is a bad situation that looks much more likely to get worse before it gets better. That will not surprise anyone who invested during the Dot-Com Bubble bust of 2000-2003. This is precisely what happened then. And, what seemed to cinch the greater demise of the former market darlings? That no one believed it could happen, even while it was happening. The same thing is palpable in today’s market.
Does this mean Alphabet (GOOG) and the other FAANGs that look similar, chart-wise (AAPL, MSFT, AMZN), will implode in 2023? There’s a strong chance of that, but after the run they’ve had, you must always leave room for the possibility that the final, emotional drawdown in this cycle is delayed. But again, that’s a longer shot than just looking at this picture, seeing what is happening, and concluding that the risk is decidedly to the downside. That’s why I keep writing and placing Buy ratings on Single Inverse exchange-traded funds (“ETFs”).

Summary stats
If you look at the 5 types of charts I chose representatives for here, the final thing I’d like to explain at this point is about how many of the 500 S&P index stocks looked similar. Here’s that tally, using the numbers (1-5) I assigned to the charts above:
#1 – 9 stocks
#2 – 12 stocks
#3 – 37 stocks
#4 & #5 – 19 stocks.
Note: I grouped 4 and 5 together, since they are the same thing, just with the latter being among the very largest, high-index-weighted stocks.
Sum it up and that’s 77 of the 500 S&P 500 stocks. Perhaps the most bullish thing one can take out of this is that the other 80% of the index did not look great, but also did not look poor enough to consider making the cut for this article. Take that as you wish. Just do this above all else in 2023, as I hope investors did in 2023: don’t be a hero, prioritize risk-management.
Be the first to comment