

MicroStockHub/iStock via Getty Images
Background and Thesis
This article is motivated by some of the Q&As with our marketplace members. So, a bit of background to start off. As part of our marketplace service, we provide regular update on an UTMA (Uniform Transfers To Minors) account that we hold for our teenage son. We use the account to educate him on personal finances. And each year, we give his Christmas and New Year gift in the form of stock shares (together with other more “normal” gift). Of course, the tax benefits are a plus too.
This background leads us to Ford (NYSE:F), a stock held in this account to be elaborated on more in the next section. And some members asked about the rationale for including a highly cyclical stock like F in such an account, an account that is meant to provide a nest egg for our kid(s).
Our view is kind of exactly the opposite. Our view is that the long-term time horizon for such accounts is actually a good reason to consider such cyclical stocks. And the remainder of this article will organize our Q&As in a more coherent way to further illustrate our thinking. In the end, you will see that our key reasoning is twofold:
- The discrepancy between its accounting earnings and its owners earnings makes its hidden P/E even lower than what is on the surface (only about 7x FW P/E as seen in the chart below).
- As such, it begins to fit one of my investment tenets of “looking for hidden 1x PE stocks”. And in our view, the combination of such wide margin of safety and the long timeframe of our UTMA account provides high return potential AND lower risks at the same time.
With this, let’s dive and explore more specifics.
Source: Seeking Alpha data.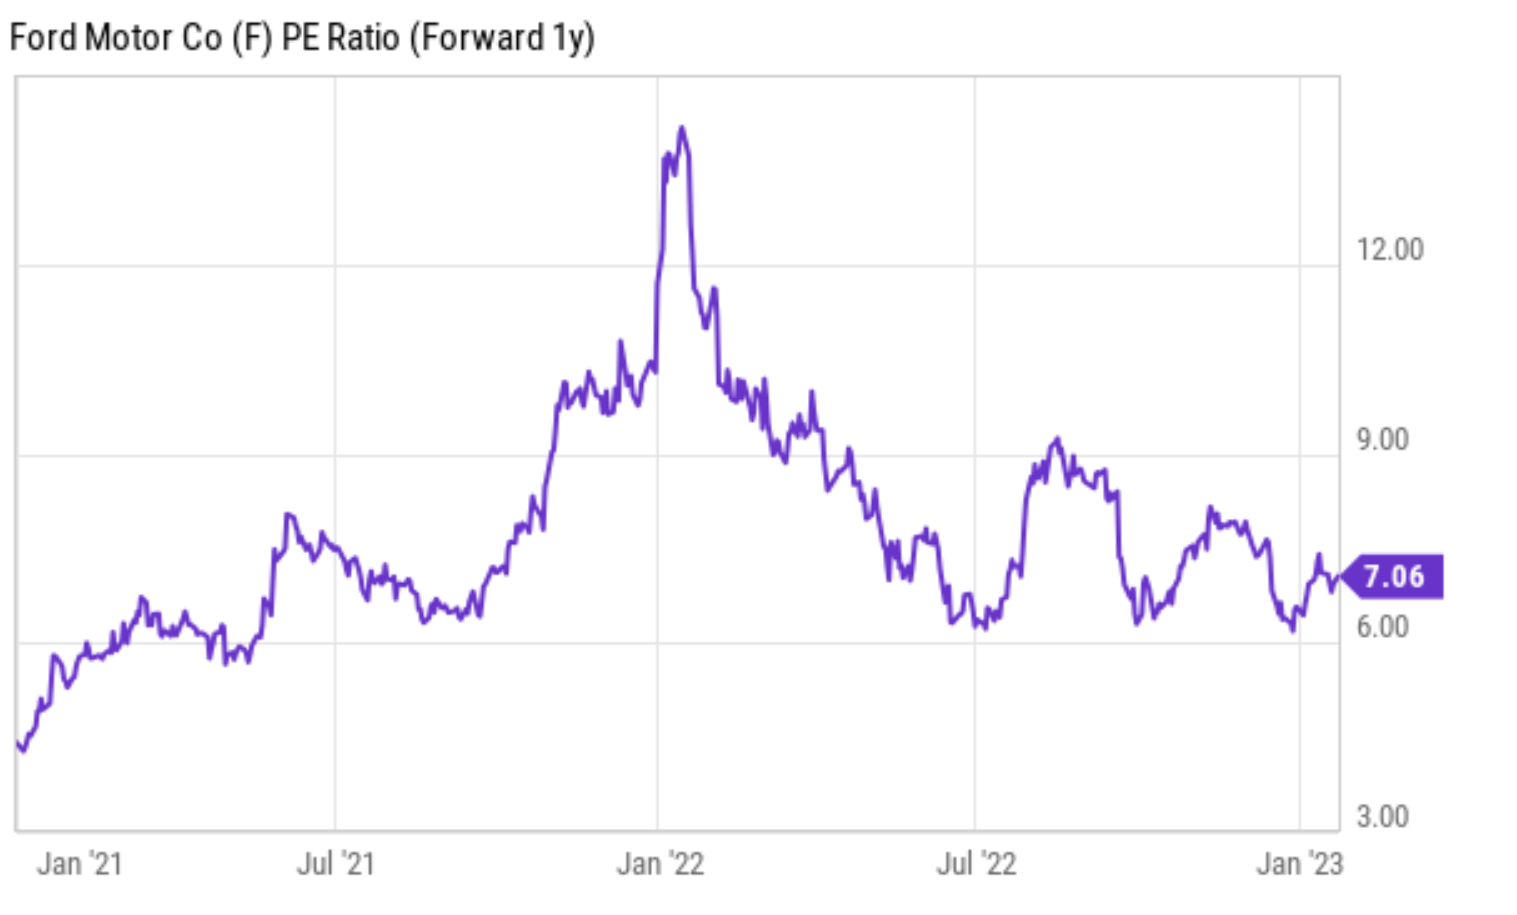
Our UTMA account
Details of our UTMA account have been provide in a recent article. As aforementioned, our top motivations for opening this account involved educational considerations, some nest egg for our son, and tax considerations. Our current holdings in the account are in the table. A few notes:
- For performance tracing purposes, I used the prices on July 11, 2022 (the date I first published this portfolio) on SA as the entry price. So, it’s easier for readers to verify and track its performance.
- Our actual portfolio size is substantially smaller. The $100k starting size used here is just to simplify the math.
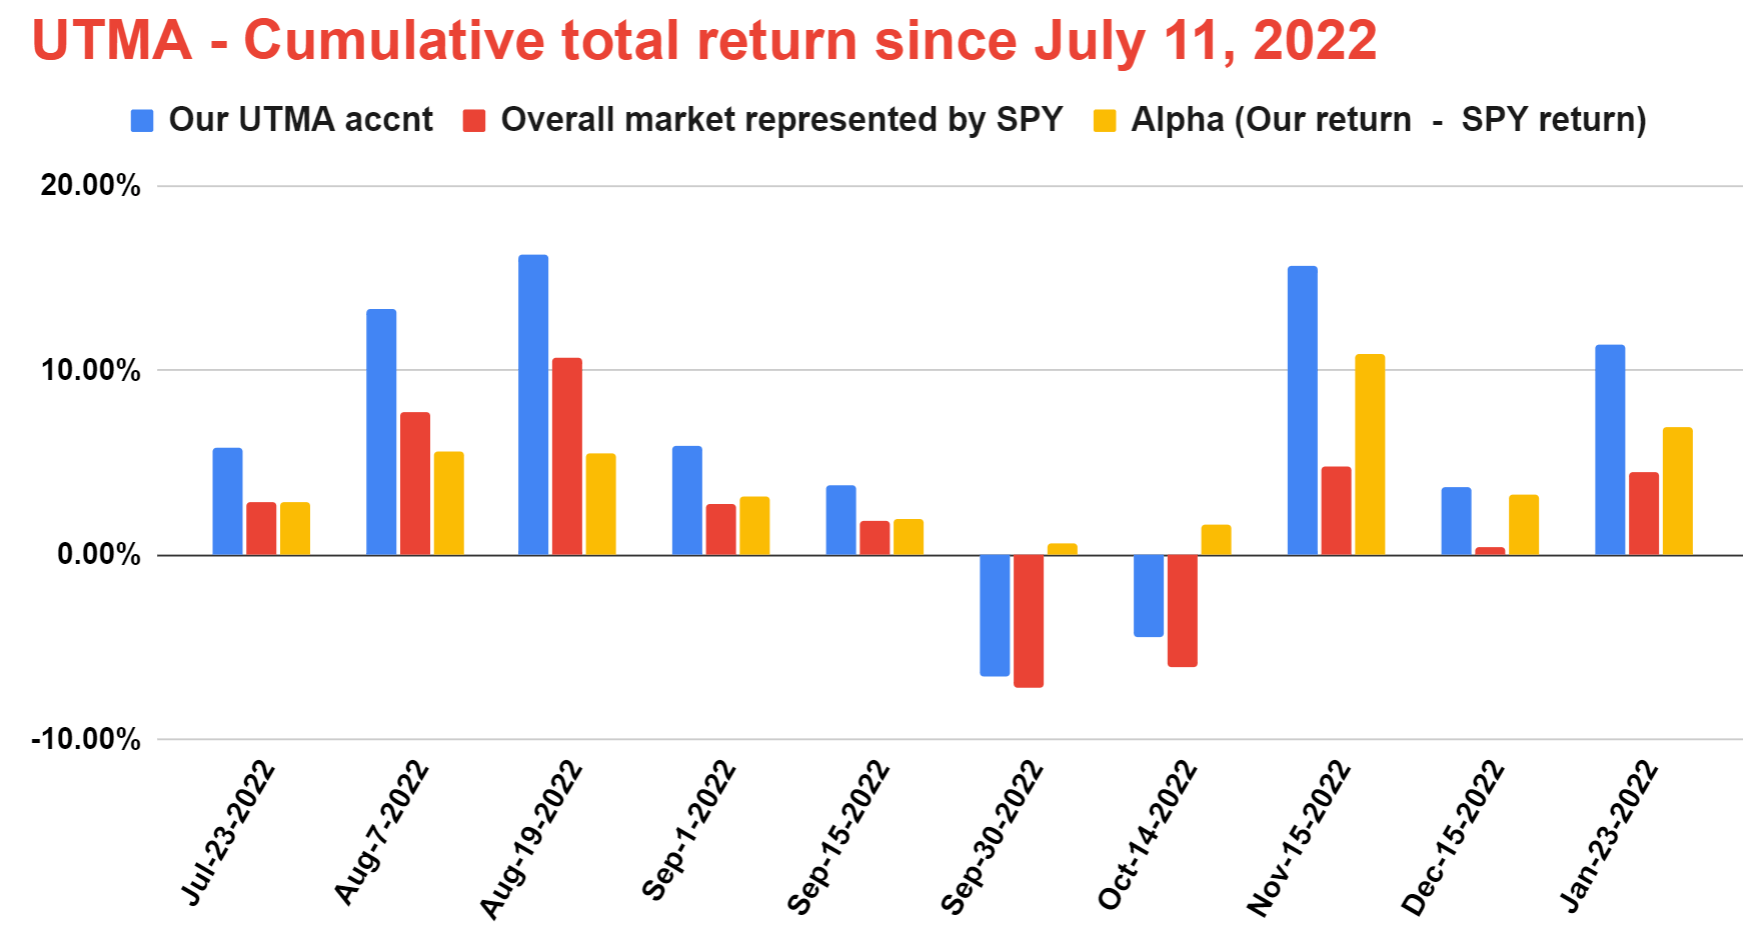
As seen, F is one of our 6 holdings in the account, representing about 16.8% of the current total. Our UTMA account has systematically outperformed SPY, a good demonstration of our concentrated philosophy. The account outperformed SPY by about 8.8% since July 2022 as of this writing. Our experiences repeatedly show that a few well-chosen stocks offer both superior performance and also lower risks than a bunch of poorly understood holdings. Realistically, our observation is that most individual investors cannot meaningfully understand and track more than about two dozen stocks.
Source: Author, our Son’s UTMA current holdings Source: Author, UTMA cumulative return since July 11 vs. SPY returns.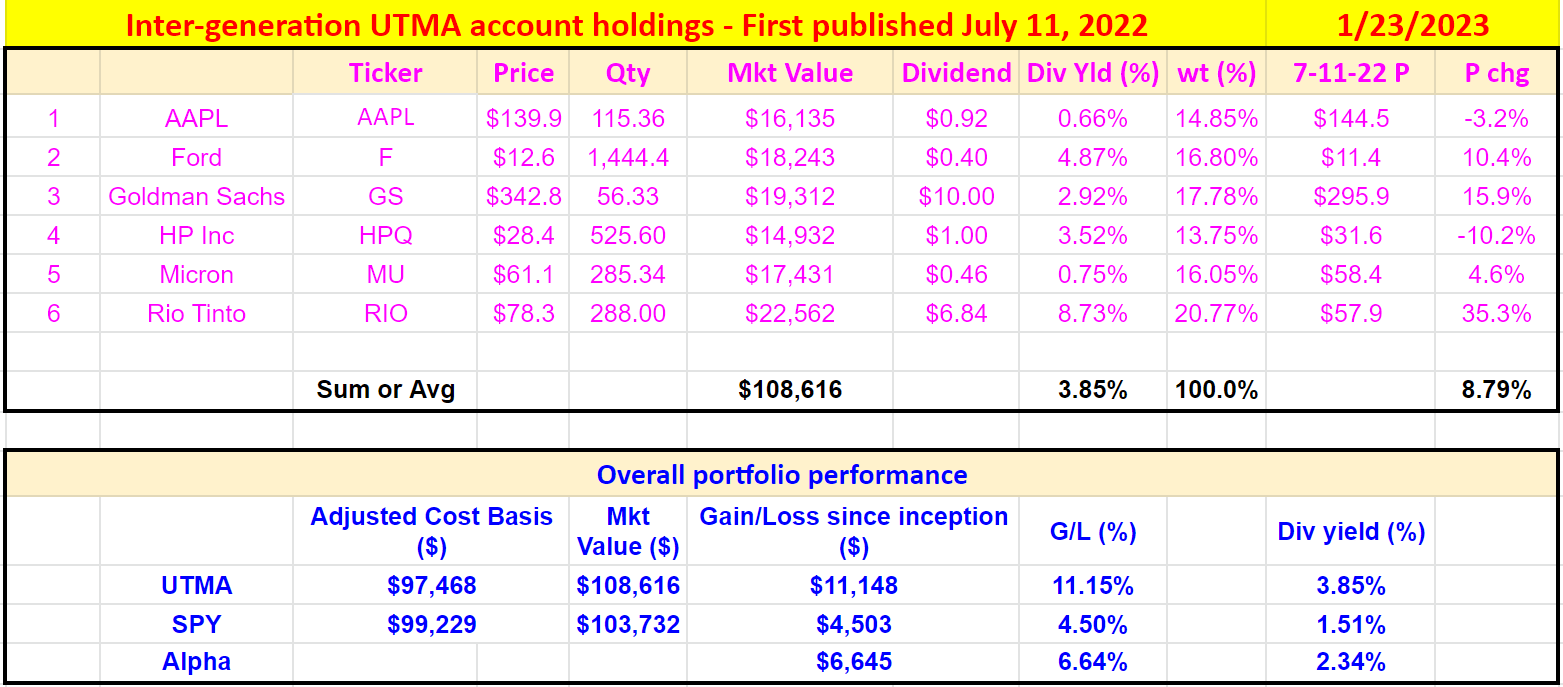
The search of 1x P/E stock
Mohnish Pabrai is an investor that I closely follow. Take a book of his book, The Dhandho Investor, if you are interested. His style is to push value investing to the extreme. And one of his “tenets” for doing so is to look for stocks with 1x hidden P/E. The auto industry, with its notorious cyclicality, is a place that offers many of the best fits for the 1x P/E tenet. And one of Pabrai’s own 1x P/E picks involved Fiat Chrysler a few years earlier. More specifically,
Pabrai says when he bought Fiat Chrysler, it was trading at less than $5 a share and the company had forecast by 2018 it would be making about $5 a share. In 2016 it spun off Ferrari, but including that it exceeded the forecast number. The PE of 1x materialized and the investment increased by 7 to 8 time in that time.
And now I see F is getting close to a 1x P/E stock too. Next, you will see why my analysis is that F’s hidden P/E ratio is in the range of 2x to 3x. Not exactly 1x, but quite close.
First, the accounting earnings of F underestimate its true economic earnings (or OE, owners earnings) substantially. The key differences between accounting EPS and OE is in the treatment of the CAEPX expenses, which is a major expense for auto companies. The details are in my earlier article. And the gist is that A) the CAPEX expenses should be broken into two parts (Maintenance CAPEX and Growth CAPEX), and B) the growth part should be considered part of the OE.
With this understanding, the results below are my analysis of F’s OE in recent years, compared to its commonly quoted accounting EPS. As seen, F’s OE systematically exceed its accounting EPS by a large amount. Furthermore, despite the cyclical nature (as reflected in the large fluctuations in its accounting EPS), its OE has been quite stable and all positive. To be more qualitative, its OE in the past 7 years (approximately one business cycle) have averaged $2.5 per share. And the ratio between its OE and accounting EPS is on average 180%.
Source: Author based on Seeking Alpha data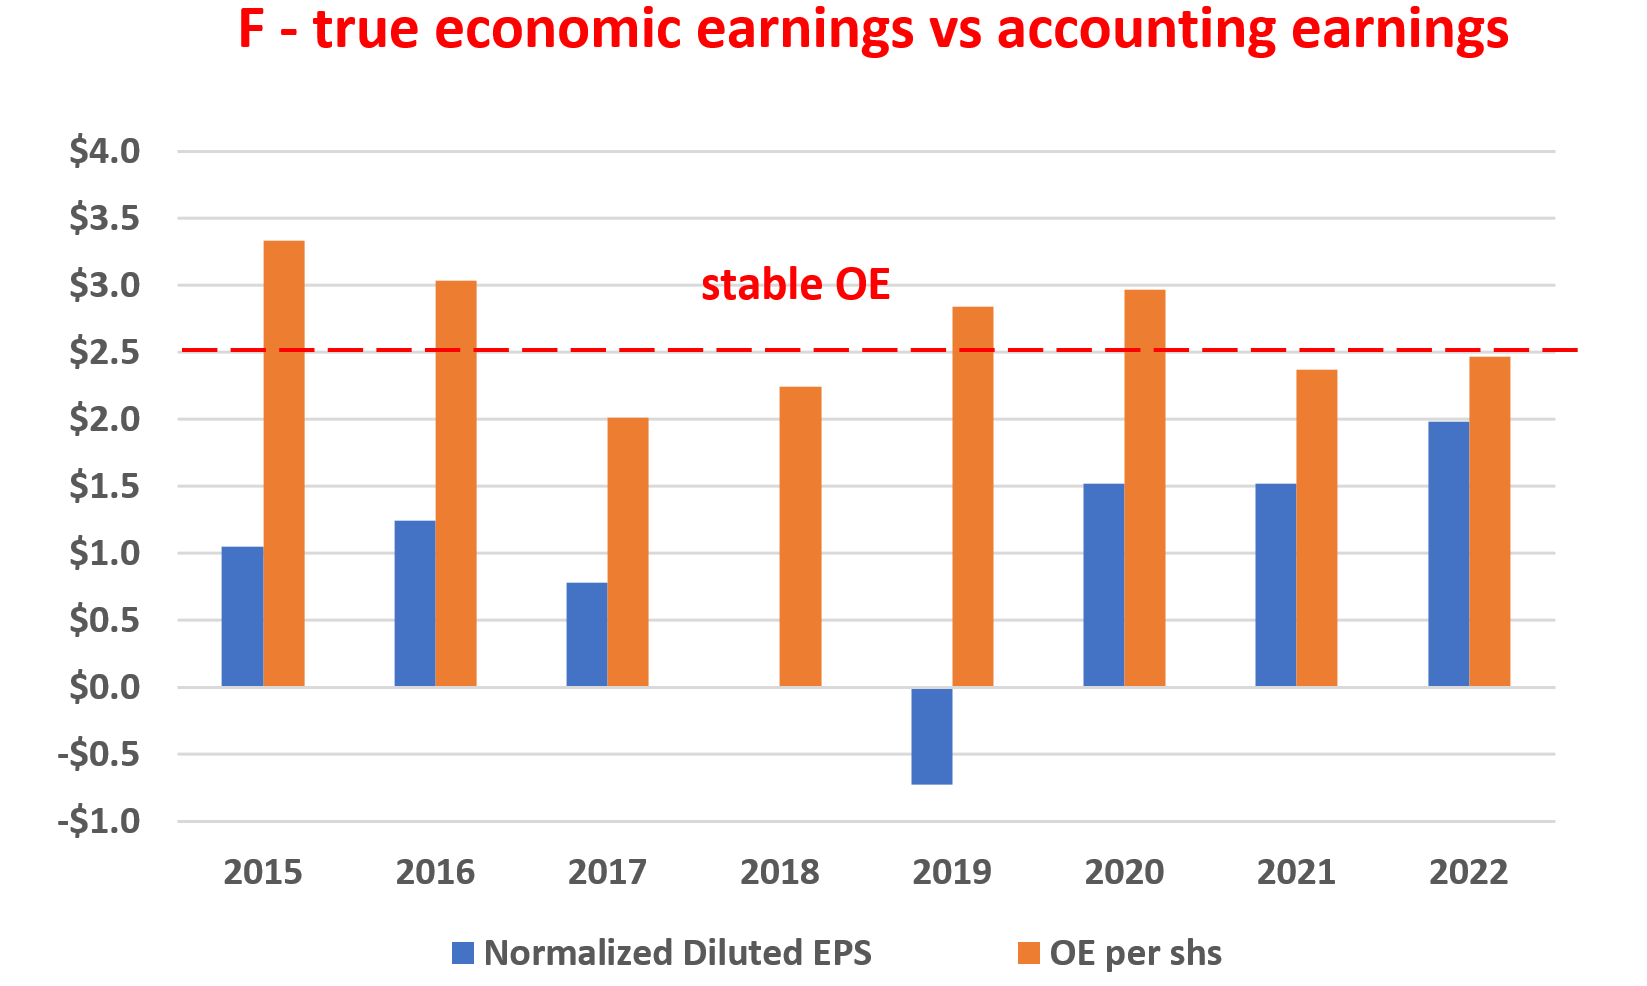
Consensus estimates project its EPS in the range of $2.06 to $2.61 in three or four years. Such projection translates into a P/E ratio of about 4.75x in 2026 as seen. I find such estimates a bit on the conservative side as detailed in my other articles on F. Using its return on capital employed (“ROCE”) and its investment rates, my EPS projections are a bit higher than these consensus estimates.
However, even if I keep using these consensus estimates, its hidden P/E is still substantially below the 4.75x that the consensus projects a few years down the road because of the discrepancy between the OE and its accounting EPS as just mentioned.
If we extrapolate the ratio between its OE and EPS (on average 180% during the past business cycle), its P/E ratio based on OE would be about 2.6x. Not exactly a 1x P/E stock, but quite close.
Source: Seeking Alpha data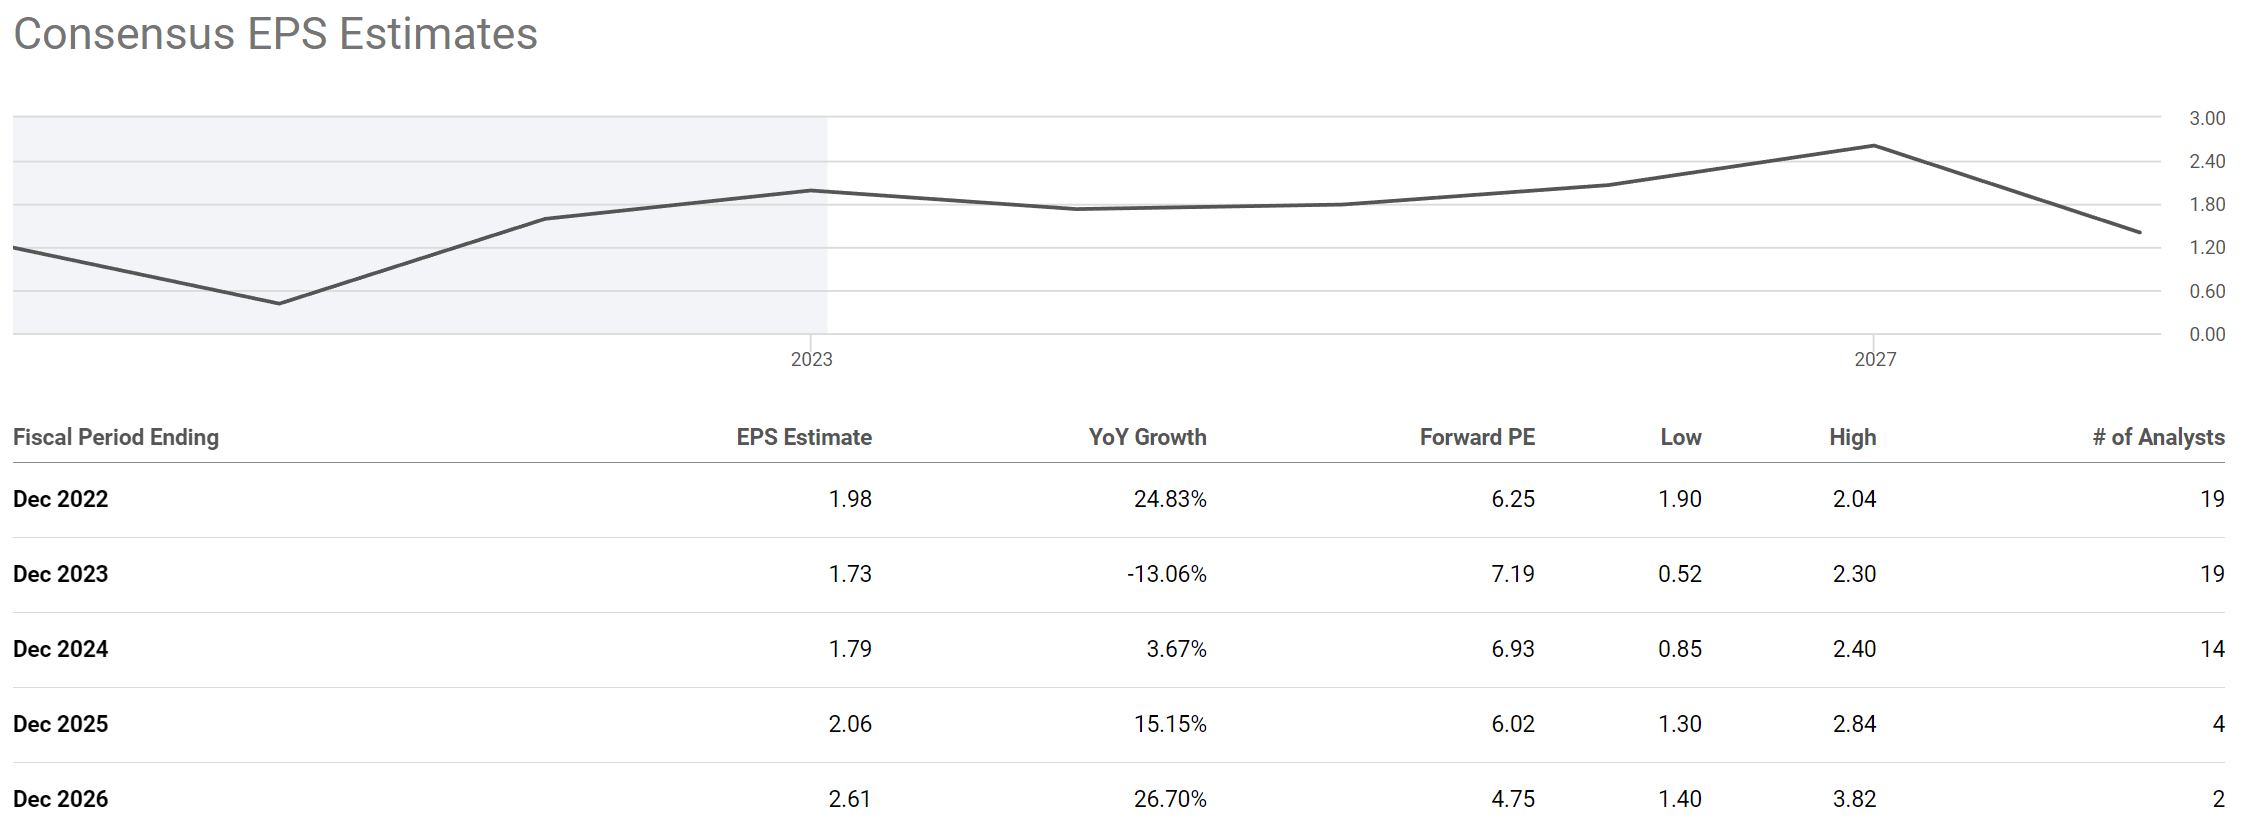
Risks and final thoughts
Our F investment certainly entails a range of immediate and also long-term risks. In particular, the immediate risks are what keep its valuation at the currently compressed level. These risks include macroeconomic conditions such as inflation, global supply chain disruptions, raw material cost, et al. In particular, I view F’s lineup strong and popular and many of its vehicles have long waiting lists. A key problem has been finding the parts to build them amid the ongoing logistic congestion. Also note that its recent accounting earnings dipped into the red, as F recorded a $2.7 billion non-cash impairment charge on its investment in Argo AI. Even though this would be onetime and non-recuring loss, the Argo AI setback could impact the progress of its self-driving program.
All told, Pabrai’s 1x hidden P/E tenet is a good rule that I have relied on to pick highly cyclical stocks (or stocks facing higher-than-usual uncertainties). In my experiences, when a stock’s valuation approaches this level, the margin of safety is so wide that I have had good success rates. And in the case of Ford, I see its hidden P/E in the 2x to 3x range. Finally, I see a long timeframe, when combined with such a wide margin of safety, to REDUCE (instead of increase) the investment risks.
Be the first to comment