

Sean Gallup/Getty Images News
Thesis
A frequent Q&A topic with my readers involves the valuation of high-growth stocks with negative profits. In these cases, common valuation metrics like P/E and price/cash multiples do not apply. In this article, I would like to compile the discussions into a coherent thesis and perform a case study on two EV players: Ford (NYSE:F) and NIO (NYSE:NIO).
A key concept here is what I call an acid test. The test involves a hypothetical thought experiment. If the business stops growing now (i.e., if it stops investing in growth CAPEX), would its profits turn positive? And you will see that F passes the test, but NIO doesn’t. Combined with other considerations, including F’s impressive product lineup and NIO chip supplies uncertainty, the thesis is a pair trade idea: buy F and sell NIO.
NIO Vs. Ford – Free cash flow and CAPEX
I am sure all readers are familiar with the importance of free cash flow (“FCF”). However, like many other investing concepts, the devil is all in the footnotes. In the case of FCF, the inputs, more specifically, the capital expenditure can be ambiguous. We will detail this ambiguity later. And for now, let’s first take a look at a more overall level to prime the more in-depth analysis later.
The first chart below compares the free cash flow of F and NIO. And as you already know, NIO currently (and historically also) suffers a negative free cash flow. While F enjoys a positive FCF consistently over the years. Currently, its free cash flow is about $1 per share, resulting in an attractive price/FCF ratio of around 12x only (more on this in the valuation section).
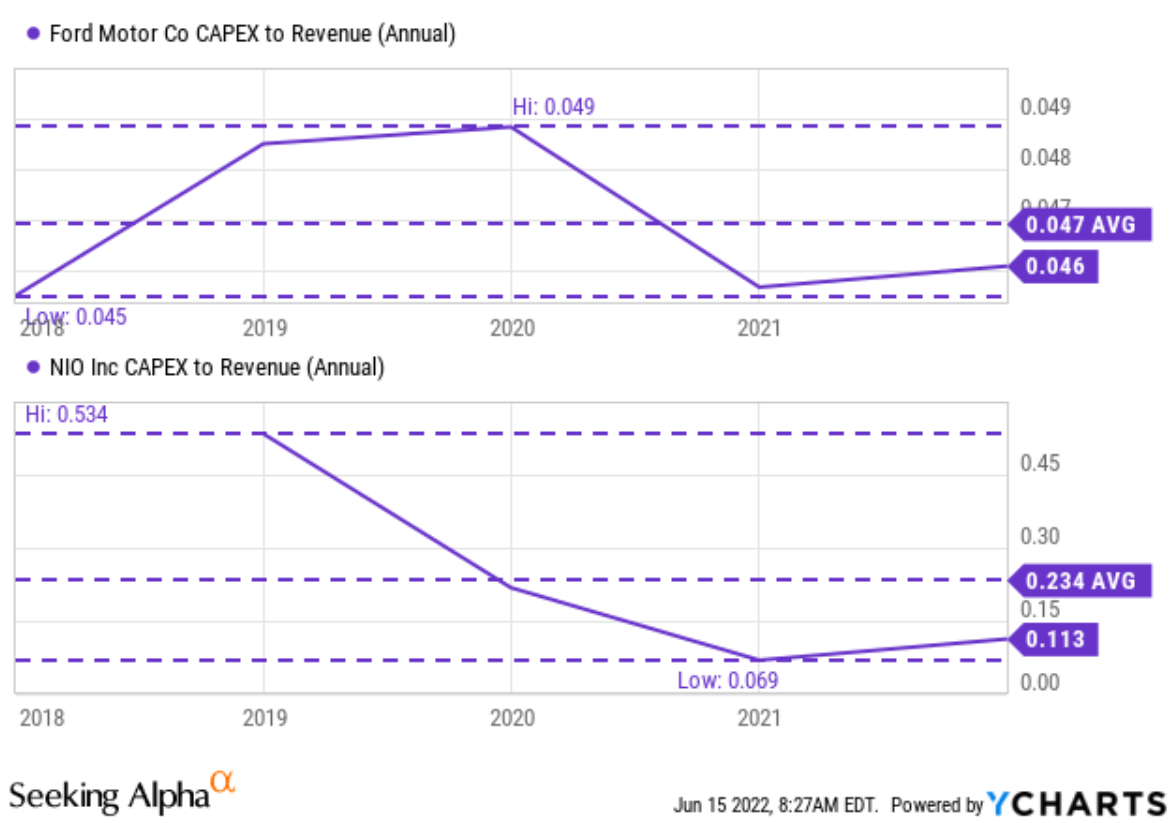
The next chart shows the key input in the computation of FCF: the capital expenditures. F has been very consistent in terms of its CAPEX expenditures. Over the past five years, it has been spending on average 4.7% of its revenues on CAPEX. The expenditure fluctuated only within a very narrow range between 4.5 to 4.9%. In contrast, NIO has been spending a lot more on CAPEX, on average 23.4%. And its expenditures also fluctuated in a much wider range, from as low as 6.9% to as high as 53%.
It is not necessarily a bad thing to have a negative FCF. Of course, it is definitely a good thing to have positive FCF. A negative FCF could mean that a business sees plenty of growth opportunities (like Amazon in its earlier years) and therefore invests CAPEX aggressively to pursue them. And this is what we will examine closely next.
Seeking Alpha and YCharts Seeking Alpha and YCharts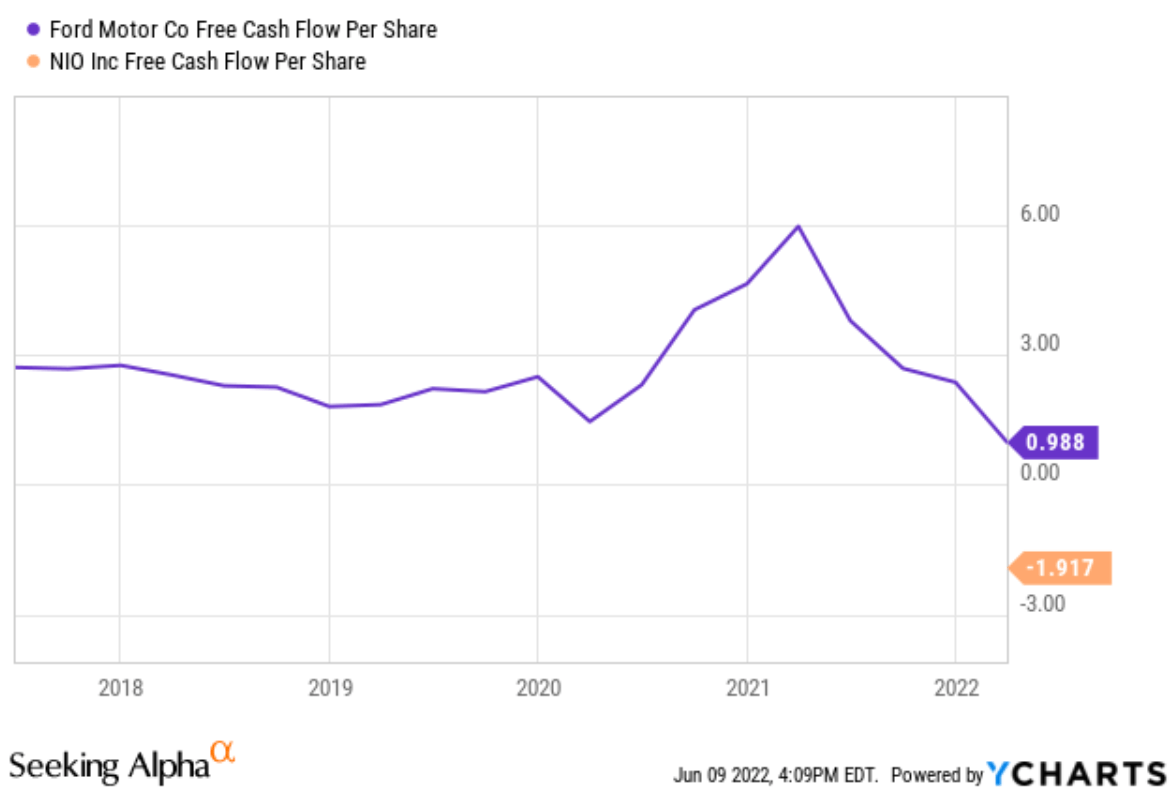
My acid test
As detailed in my earlier article,
- The key of interpreting negative FCF for growth stock is to decompose the CAEPX expenses into two parts: the maintenance CAPEX and growth CAPEX. Maintenance CAPEX is the mandatory part to keep the business running. And the growth CAPEX is the optional part. The growth part should actually be considered part of the owners’ earnings because it can be returned to the owners if the owners decide not to grow the business anymore – a key insight that investors like Buffett have recognized.
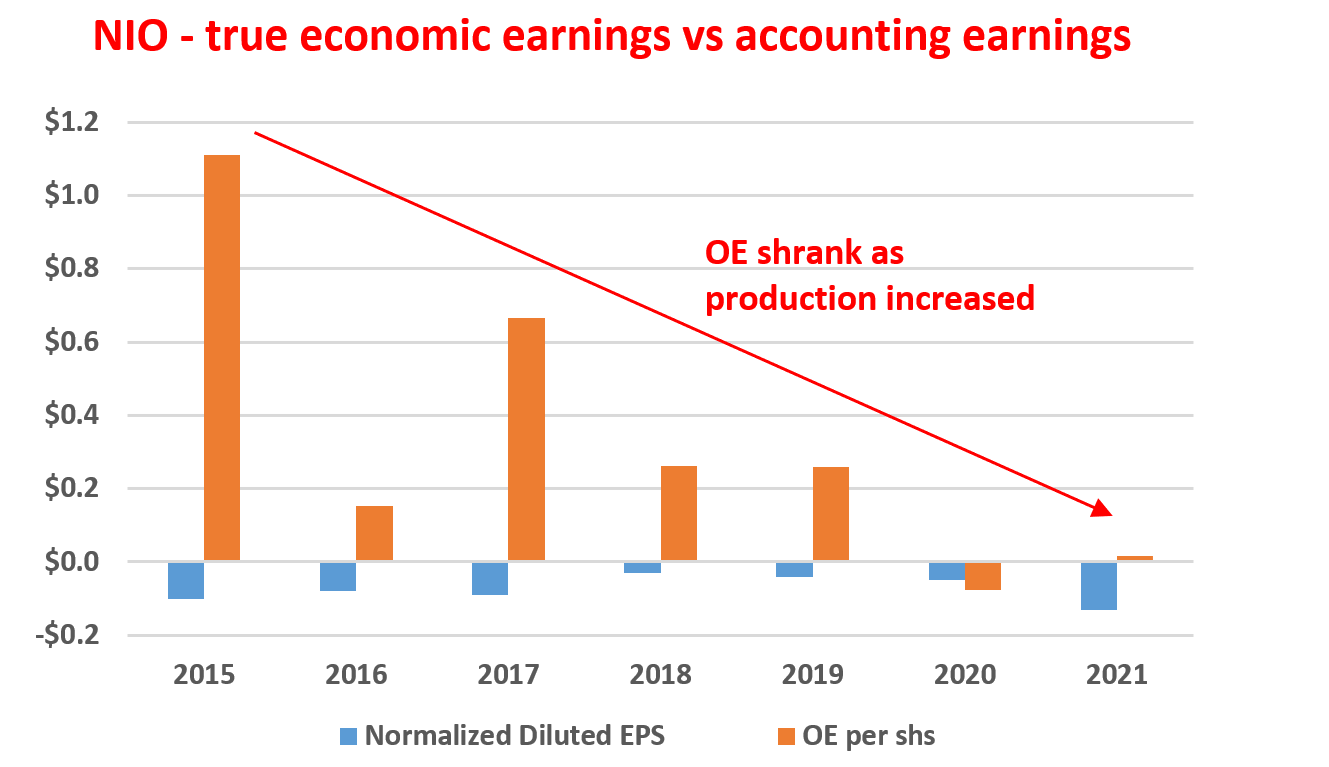
- Under this background, the following chart shows my analyses to delineate the maintenance CAPEX and growth CAPEX of F and NIO. This analysis is performed by Bruce Greenwald’s method. Readers interested in more details could take a look at my earlier article on AAPL and/or Greenwald’s book entitled Value Investing.
The first figure shows F’s OE (i.e., its true economic earnings) compared to its accounting earnings. As you can see, Ford’s true economic earnings have been consistently better than its accounting EPS by a good margin. Its true OE over the past few years has been on average $2.6 per share, which is almost 2.6x above it CFC as aforementioned. This makes its valuation even more attractive than on the surface. Its true PE ratio based on OE is only about 4.84x at its current price level.
In contrast, the second figure shows NIO’s OE compared to its accounting earnings. The picture here is a very concerning one. First, NIO’s accounting EPS has always been in the negative (and has become even more negative in 2021). Second, its OE has been rapidly deteriorating over the years as it ramped up its production and delivery.
by a good margin. Its true OE over the past few years has been on average $2.6 per share, which is almost 2.6x above its CFC as aforementioned. This makes its valuation even more attractive than on the surface. Its true PE ratio based on OE is only about 4.84x at its current price level. For example, in its March 2022 quarter, it delivered a total of 9,985 electric vehicles, up more than 37% YoY. This is also the 8th consecutive quarter that its delivery grew at a similarly rapid pace.
This is very concerning to me. I would expect a business to increase its owners’ earnings as it ramps up production because it can (or it should be able to) recuperate its fixed cost investments gradually and also leverage the economy of scale to boost profitability. But the opposite is happening to NIO.
Author based on Seeking Alpha data Author based on Seeking Alpha data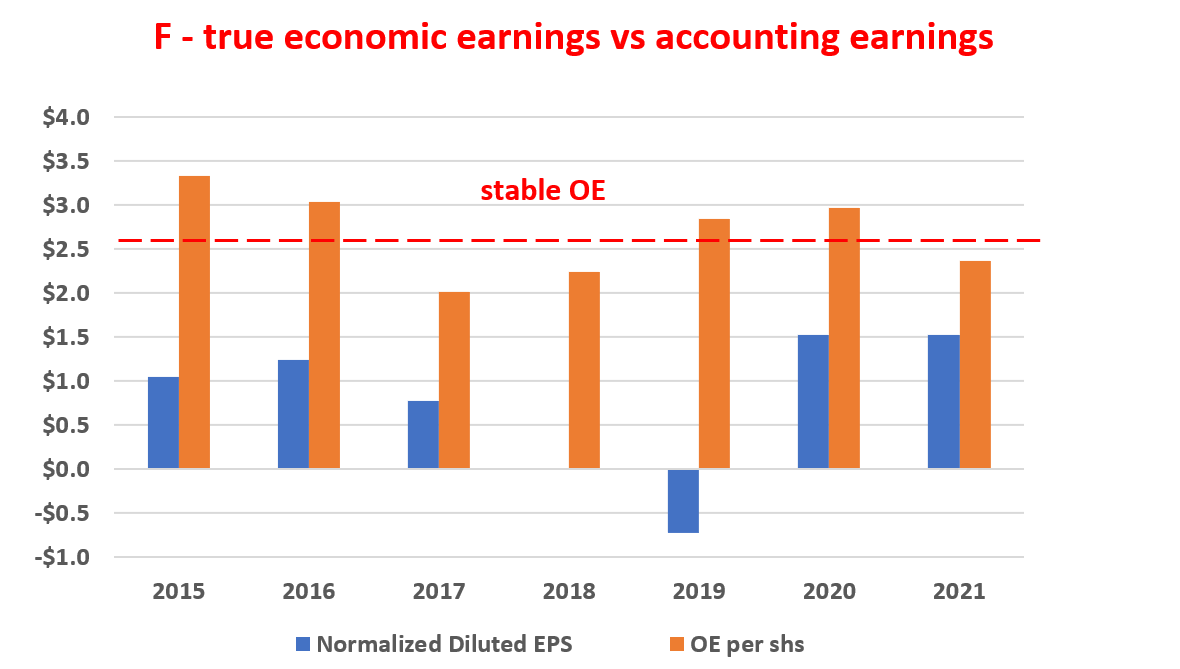
NIO Vs. Ford – Valuation
Due to the negative profits (EPS, free cash flow, et al) mentioned above, valuation comparison in terms of bottom lines is not really meaningful here for F and NIO. NIO’s PE even based on its EPS 3 years out is still at 77.5x, and its price to cash flow is reported as 99.6x. Although these metrics are very reasonable to F. Its FW PE is 6.3x. And as aforementioned, its PE based on true economic earnings is even more attractive, only 4.8x.
Since bottom-line valuation metrics are not applicable here, let’s take a quick look at their price-to-sales multiples. NIO is currently priced at a price-to-sales ratio of 4.95x. This is more than 13x higher than F’s 0.36x (and also General Motors too).
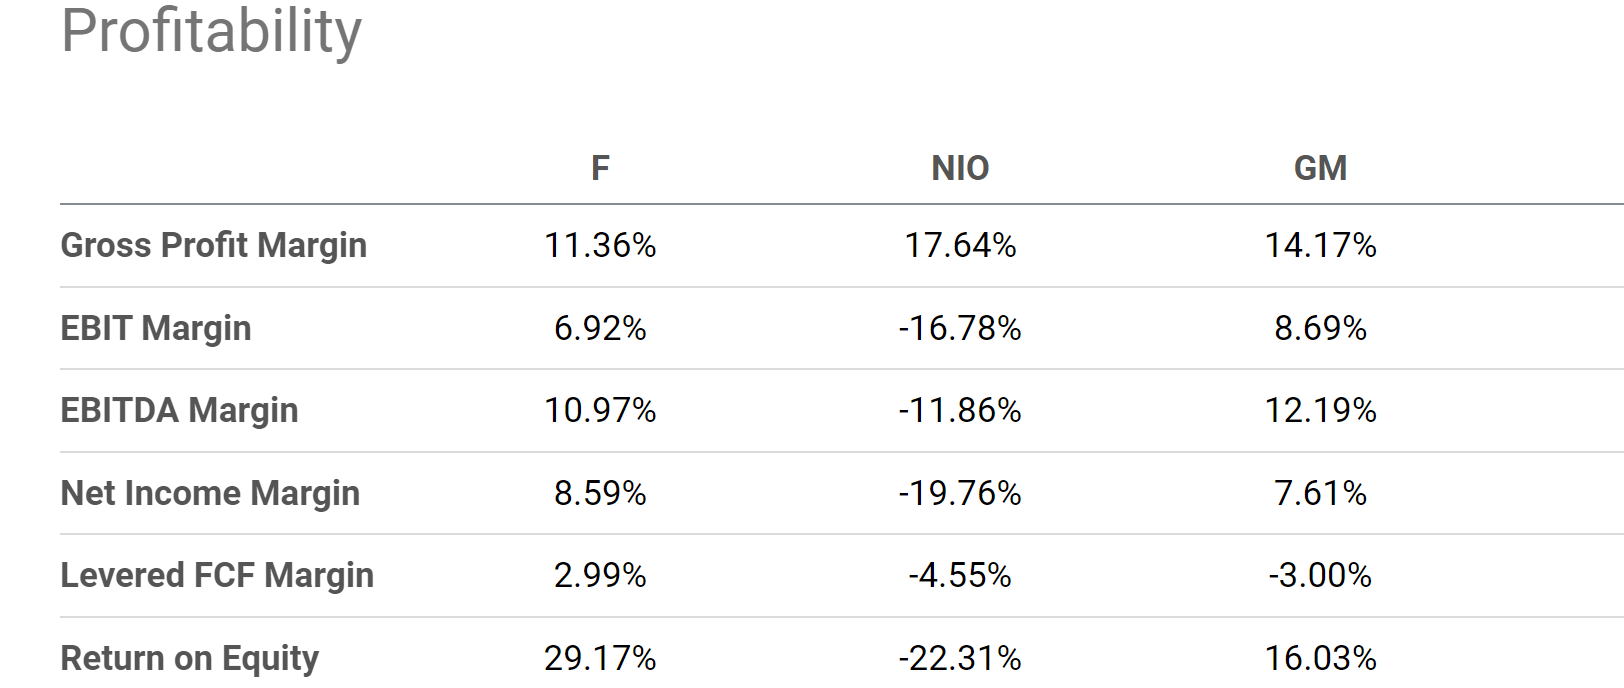
And again, the real premium is more than 13x because the margins from F or GM are much healthier than NIO as you can see from the second chart. Both F and GM enjoy stable EBIT and net profit margins in the 7% to 9% range, while NIO’s margins are negative. Even if we invoke the so-called price-sales-growth ratio (“PSG”) – and note we are treading into more and more speculative regimes now by just invoking such a concept – NIO’s valuation is difficult to justify. A 13x P/S premium would imply NIO can grow 13x faster than F or GM. If F or GM grows at 4% CAGR, NIO would have to grow at 52% CAGR – an extremely bold assumption to me.
Seeking Alpha Seeking Alpha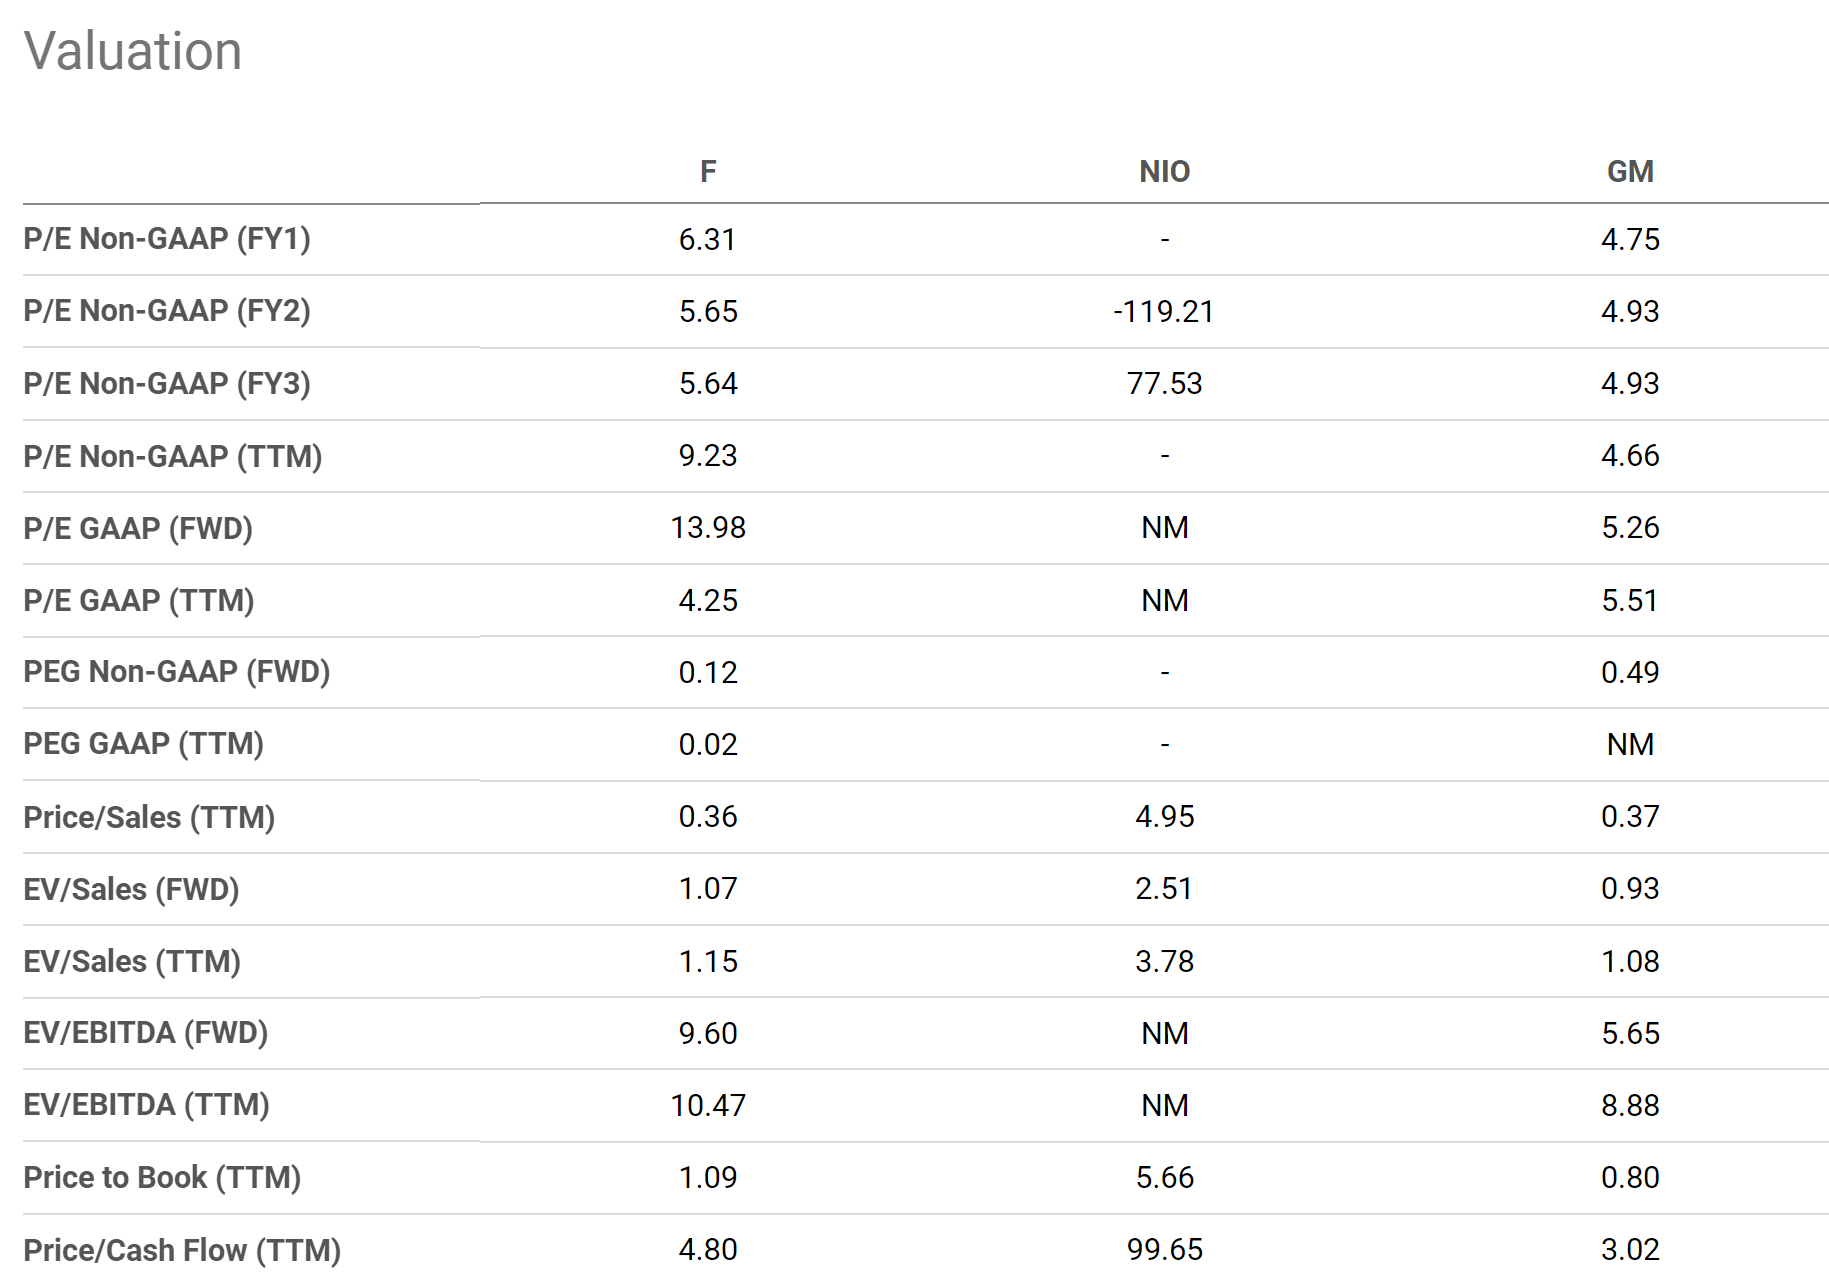
Final thoughts and other risks
This article describes a pair trade idea consisting of selling NIO and buying Ford. The central argument is built on what I call an acid test. It is the first test I run on high-growth stocks with negative profits. And F passes this test consistently, but NIO fails (and its scores are deteriorating).
Other positive considerations for Ford include its impressive product lineups. A number of its recent launches have been welcomed by consumers, including the Bronco, Maverick, and Mustang Mach-E. Another highlight is its F-150 Lightning trucks. The F-150 is the electric version of its top-selling pickup. It just began full production and has already inked 200,000 reservations.
Other negatives for NIO include the intensifying competition in the EV space in China and its chip supply uncertainties. The China EV market has enormous potential, but competition is also fierce. NIO faces stiff competition from both domestic players (BYD, Xpeng, Li Auto, et al) and also global players (like Ford and Tesla). And NIO is not the market leader. Also, NIO relies on Nvidia’s chips predominately. The disruption in chip supplies has created negative impacts for NIO and can persist longer. Furthermore, as both the U.S. and China now view chips as a matter of national security, termination of chip supplies could be possible if the tension between these two countries escalates.
Finally risks. The downside risks for Ford include competition with other players too and also the global shortage of semiconductors. Although I view the risks Ford faces, especially in terms of chip shortage, much less severe than NIO. Its management expects improved chip availability in the second half to fuel wholesale volume growth of 10% to 15% for the year. And Ford does not have the potential risk of chip supplies sanction.
The upside risks for NIO include the government’s incentive. For example, its Battery as a Service (BaaS) can benefit from the government’s support and favorable policy. However, for me, it is too speculative to base investment decisions on such potential incentives. The government’s policy and incentives on something as new as EVs will be evolving and unpredictable. Furthermore, the unpredictability is further compounded by the competitors in this space. Even a favorable policy could end up helping a competitor more (and hence actually be negative for another player).
Be the first to comment