

tadamichi
Written by Nick Ackerman, co-produced by Stanford Chemist. This article was originally published to members of the CEF/ETF Income Laboratory on September 7th, 2022.
Cohen & Steers Closed-End Opportunity Fund (NYSE:FOF) is a convenient approach to gaining significant diversification with one fund alone. They take a fund of funds investing approach, leading to exposure to thousands of different positions.
However, one of the primary reasons that I see investing in FOF would be to get a “discount on discount” with the underlying CEFs. At this point, FOF is continuing to trade at a premium which makes it less appealing. Since we’ve been in a bear market that looks set to continue, their distribution will also be under pressure and something to watch.
With that being said, I still enjoy keeping an eye on FOF to see what they might be holding in their portfolio. That can give me some ideas of what might be attractive positions that are worth considering. I’ve found that their top ten often coincide with funds I hold currently or would find to be attractive.
The Basics
- 1-Year Z-score: 1.42
- Premium: 3.49%
- Distribution Yield: 9.03%
- Expense Ratio: 0.95%
- Leverage: N/A
- Managed Assets: $304.9 million
- Structure: Perpetual
FOF has an investment objective of “seeking to achieve total return consisting of high current income and potential capital appreciation.” They will invest “in the common stock of closed-end management investment companies that invest significantly in equity or income-producing securities.” This broad-based approach sets management up for an endless amount of flexibility. Also interesting is that they don’t include ETFs in that description but still hold ETFs in smaller capacities anyway.
The fund isn’t overly large, bringing down the average volume and making it harder to buy and sell for large investors. Yahoo Finance puts the average daily trading volume at around 61k.
The fund’s expense ratio is on the lower end, but that’s a good thing because the underlying funds have their own expenses too. That’s always a consideration that should be factored in. They hold several PIMCO funds, which often have some of the highest expense ratios. Some of the capital being invested would be pushing a 3 to 4% expense ratio when factoring in the underlying positions.
Rising interest rates wouldn’t impact FOF due to higher leverage expenses since they don’t utilize leverage directly. However, the underlying positions do utilize leverage. Therefore, some of the underlying holdings can be impacted by the higher rates on their leverage if they aren’t hedged.
Performance – Premium Continues To Make It A Hold
In my prior coverage, the fund hasn’t performed very well but has done better than we might first imagine.
FOF Return Since Previous Update (Seeking Alpha)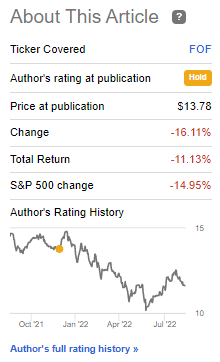
On a total return basis, the fund slightly outperformed the S&P 500. On a YTD basis, based on a total NAV return, slightly outperformed the S&P 500 as measured by the SPDR S&P 500 (SPY). It has underperformed compared to Vanguard Total Bond Market (BND) and iShares iBoxx $ High Yield Corporate Bond (HYG). BND and HYG have interestingly performed quite similarly this year.
Ycharts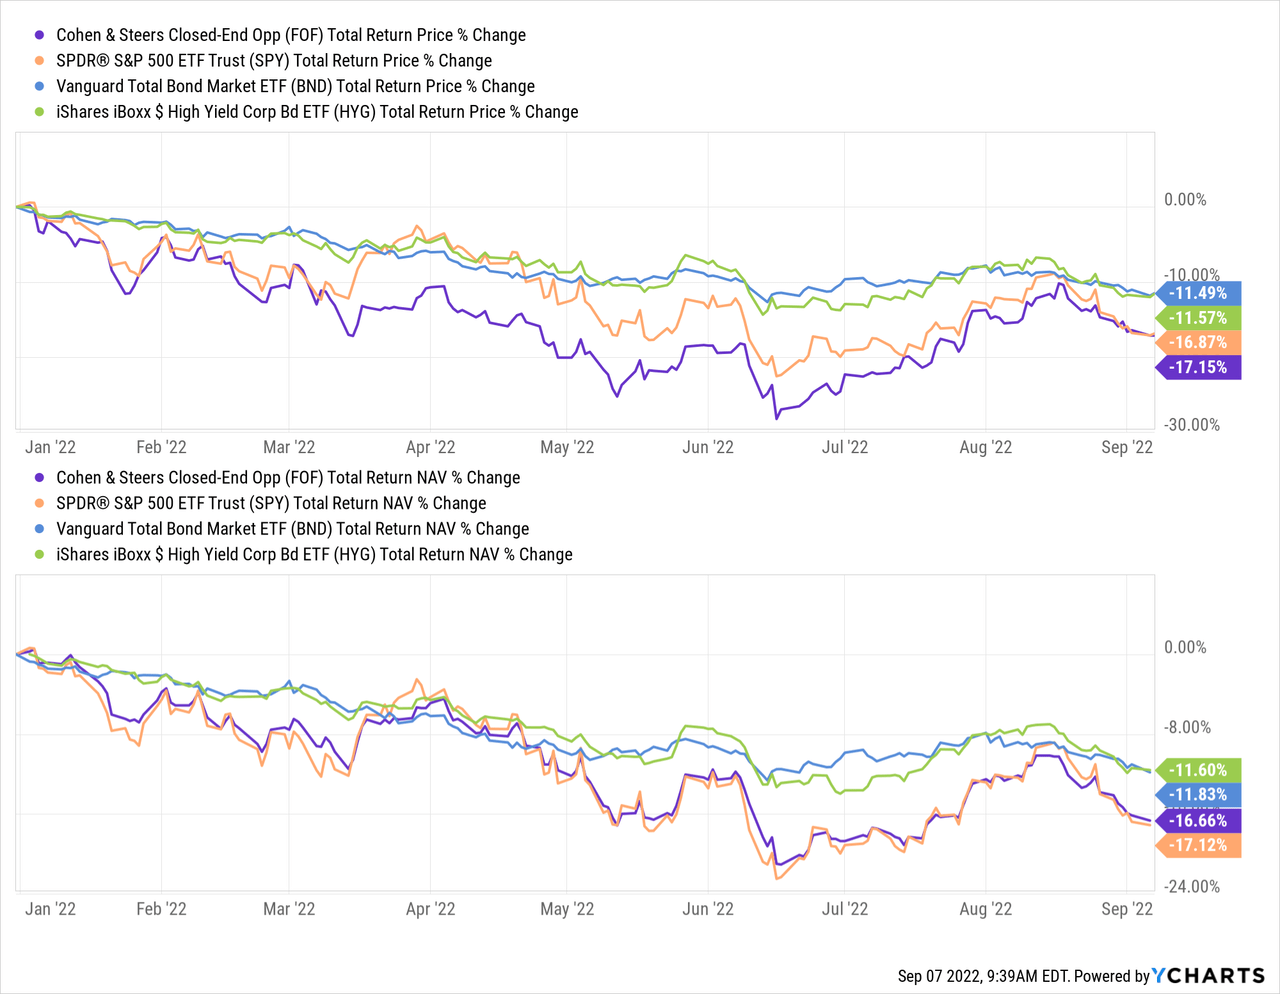
FOF is heavier in equity investments, so this isn’t too much of a surprise. However, the fund also has to contend with widening discounts in the underlying CEFs it holds as well as the challenging performance of declining bond and equity prices. Plus, of course, the majority of CEFs are leveraged, meaning that during downturns, they can perform even worse too. That’s why I see FOF as performing quite well, given the circumstances.
When looking at other CEFs’ total NAV returns, that effectively eliminates the discount widening or narrowing impact we see when looking at the share price results. For FOF, the NAV is these underlying positions on their share price basis.
Based on the fund’s latest fact sheet ending June 30th, 2022, here are the fund’s annualized returns.
FOF Annualized Returns (Cohen & Steers)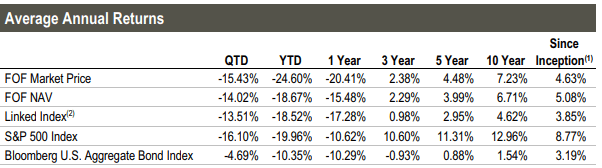
In this case, they used a linked index, the S-Network All Taxable ex-Foreign plus Capped Muni CEF Index. They’ve performed well against that index, which might very well be the most appropriate. However, I think comparing it against a blend of SPY, BND and HYG provides a better comparison. That’s what I tried to highlight above when comparing those three ETFs.
While that is somewhat encouraging, I still can’t get too enthusiastic due to the fund’s premium. With a premium, I believe you are losing half of what makes FOF worth investing in. One could argue against that because the overall prices of everything else are depressed. However, investing in a CEF at near its all-time high valuation is generally not seen as typically working out well.
Ycharts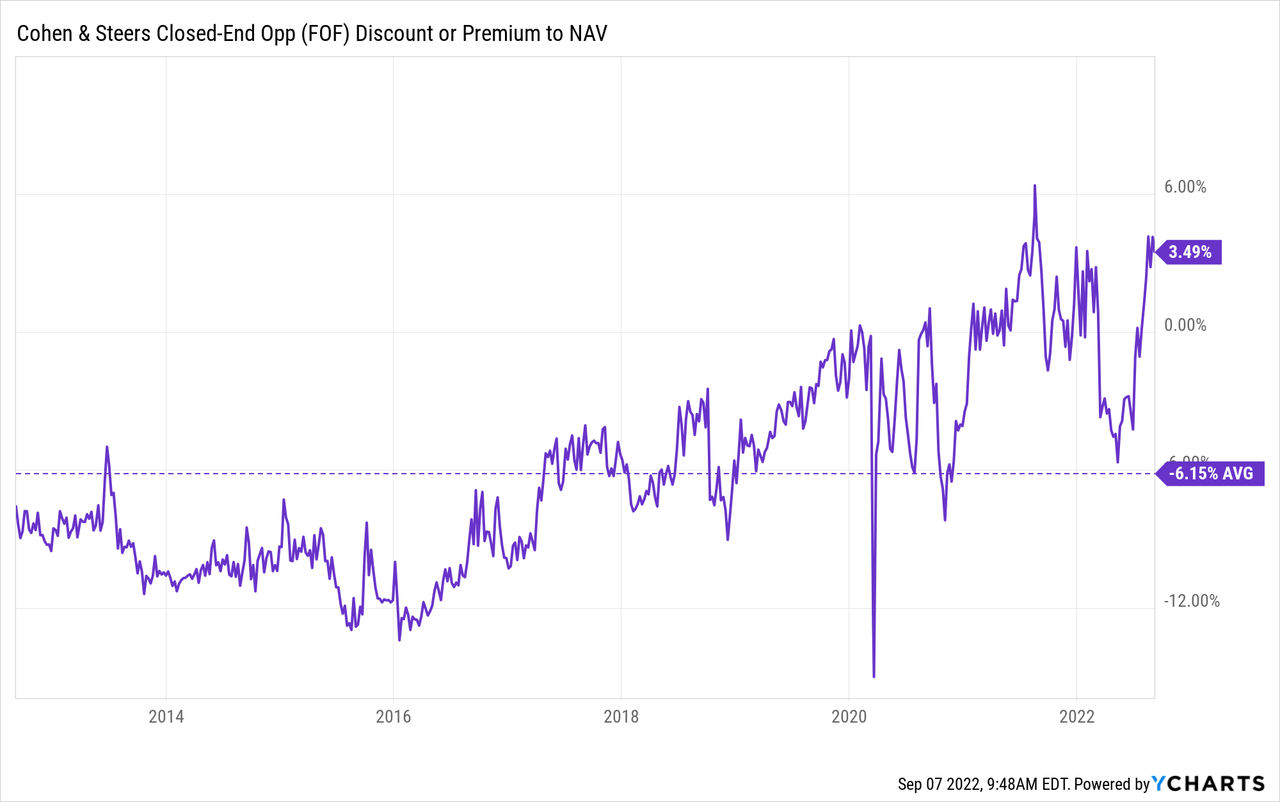
Distribution – Becoming Elevated
When looking at FOF previously, the 7.48% distribution yield FOF sported was quite attractive. I also would have considered it quite reasonable. Since things have continued to slide since that time, we’re being pushed to a 9.03% distribution yield. Based on the NAV, it comes to a 9.35% rate.
They have been fairly steady with their distributions since they launched, too. They cut during 2008/09, as many funds and companies did. They also switched to a quarterly distribution before reverting to a more popular monthly payout schedule. When they switched back to monthly, it was a marginal increase from the equivalent quarterly amount.
FOF Distribution History (CEFConnect)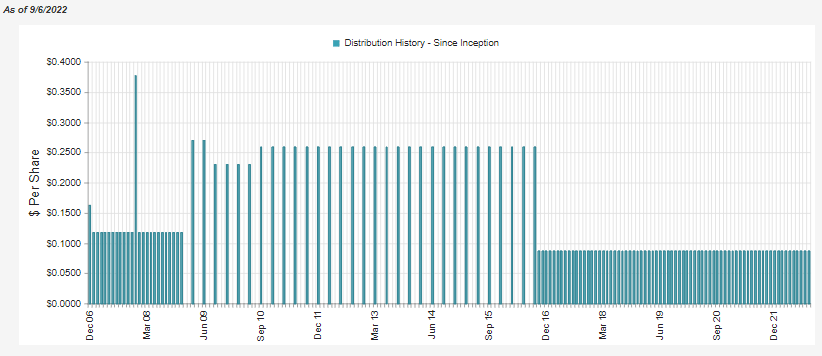
This isn’t the first time the fund has yielded over 9% in the last decade. In fact, on several occasions, the fund hit a 10%+ yield.
Ycharts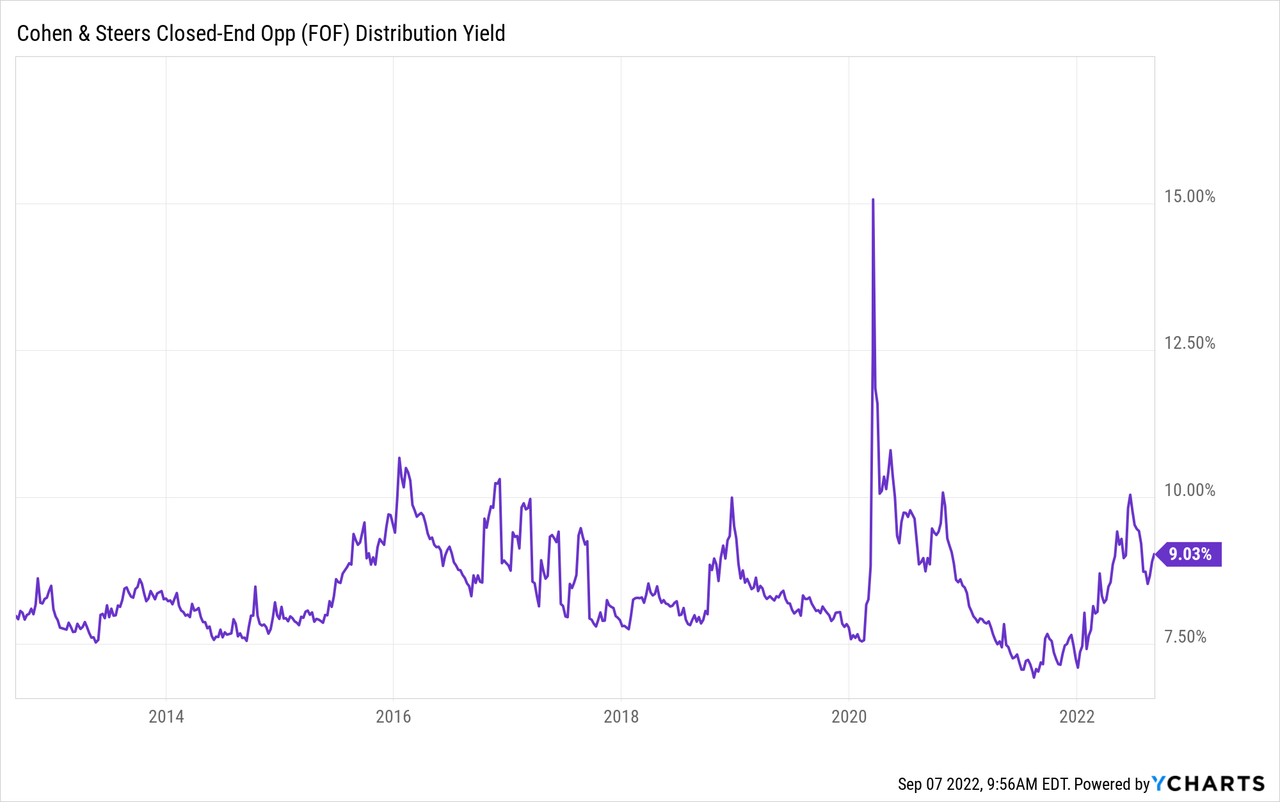
I start to worry about how this could be a more extended period of the fund yielding at an elevated level. The COVID spike was relatively short-lived.
The fund’s NII increased from their last reporting period if we annualize the figure, which is promising. It’s even a meaningful increase from last year’s $3.583 million NII generated. They still rely on a significant amount of capital gains to fund their distribution. As an equity fund, this is normal.
FOF Semi-Annual Report (Cohen & Steers)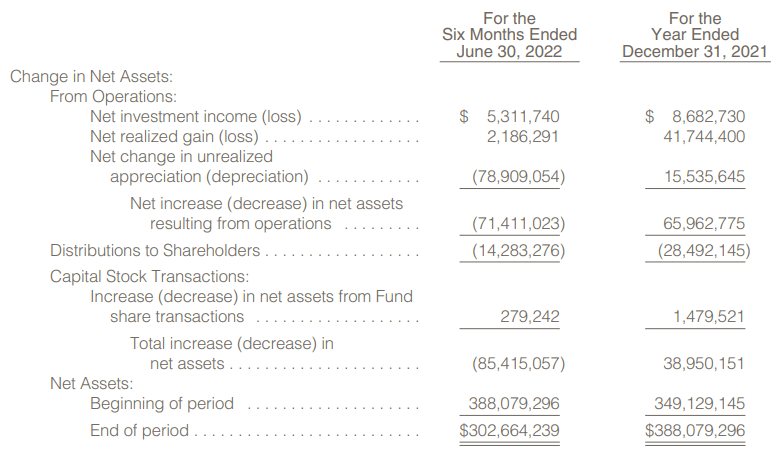
On top of this, however, we have to remember that the CEFs of the underlying positions will also rely on capital gains to maintain their payouts too.
As we know, CEF payouts are more properly called “distributions.” That means their payouts are composed of income, capital gains and/or return of capital. For FOF, when they collect these payouts from underlying funds, it is simply “dividend income” that makes up their total investment income. It doesn’t break down what is income or capital gains for FOF.
So despite the NII being $5.312 million and providing distribution coverage of 37.19%, it isn’t as stable as one might think. During a prolonged bear market, it will become more and more difficult for equity funds to maintain their distributions. It isn’t impossible, as some funds also employ option writing to generate gains too, but it does become more difficult. If we start seeing distribution cuts from CEFs more broadly, it will doubly affect FOF.
Given the 9% distribution level, we can see that historically FOF has never been able to earn that level. If we look at the longer-term annualized results above, the NAV’s total return was just over 5%. Even during good times, the fund provided just enough returns to stay mostly flat in the last decade. From the fund’s inception to 2010, I’m not concerned because we all know what happened during that time.
Ycharts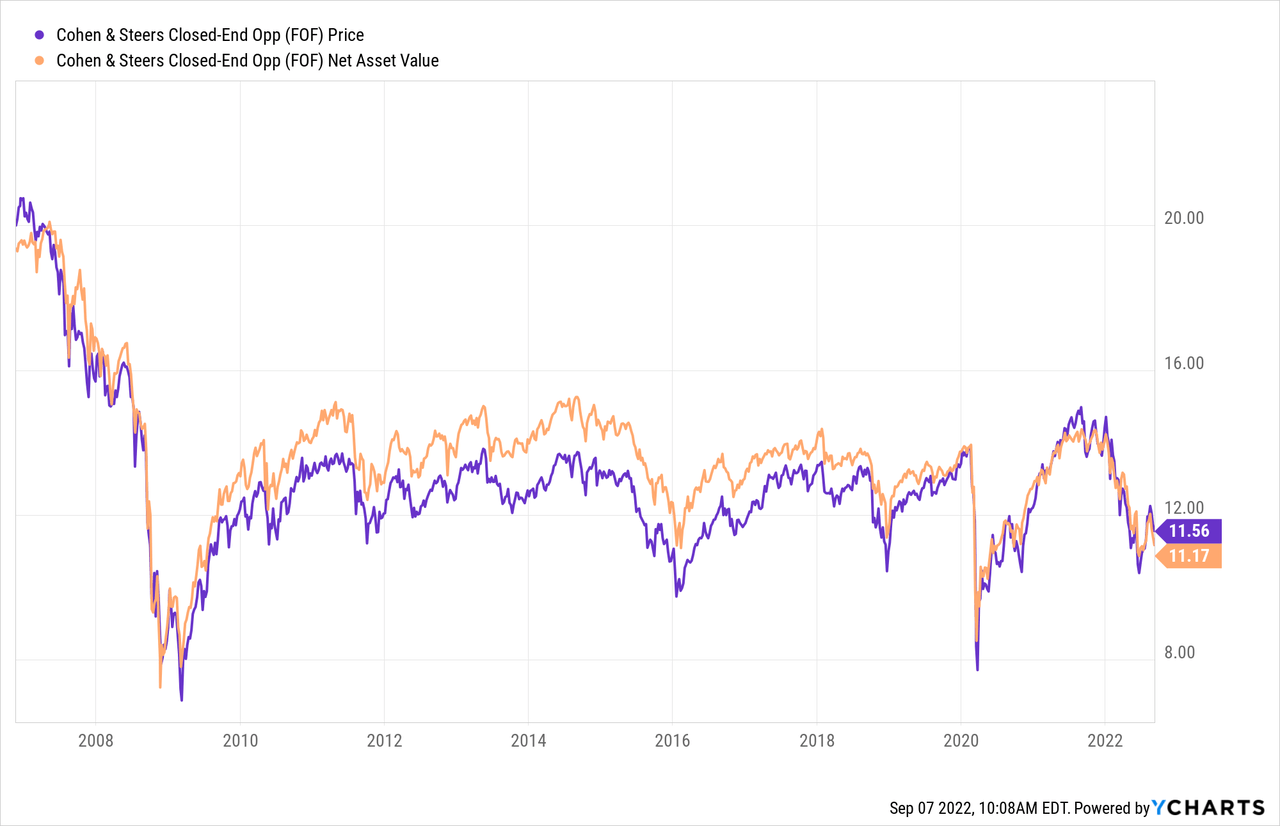
That isn’t to say they don’t keep pumping out this same distribution, but I think a distribution cut is on the table unless we see a recovery in the market. At this point, it will require quite the recovery too.
FOF’s Portfolio
FOF can be quite active in the management of its portfolio. The portfolio turnover rate for the last six months was 25%. In the last five fiscal years, they’ve averaged a turnover rate of 56.8%.
At the end of June, the fund still favored equity positions. That’s a fairly regular occurrence for FOF. At the end of September 2021, the weightings were 54/32/10 in equity, fixed-income and municipal, respectively.
FOF Asset Allocation (Cohen & Steers)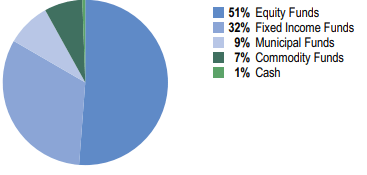
When looking at the fund’s top ten, it comprises 32.3% of the portfolio. That’s a slight increase from the 30% at the end of September 2021. However, I wouldn’t consider it an overly material shift.
FOF Top Ten (Cohen & Steers)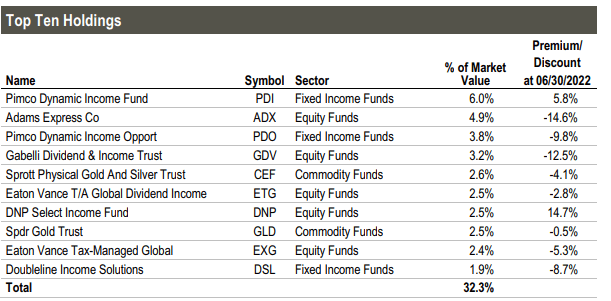
PIMCO Dynamic Income Fund (PDI) has moved up to the largest position for the fund, which replaced Adams Diversified Equity Fund (ADX) (it appears C&S hasn’t changed over to the new name yet.)
They weren’t particularly strong performers during the period relative to the rest of the fund.
Ycharts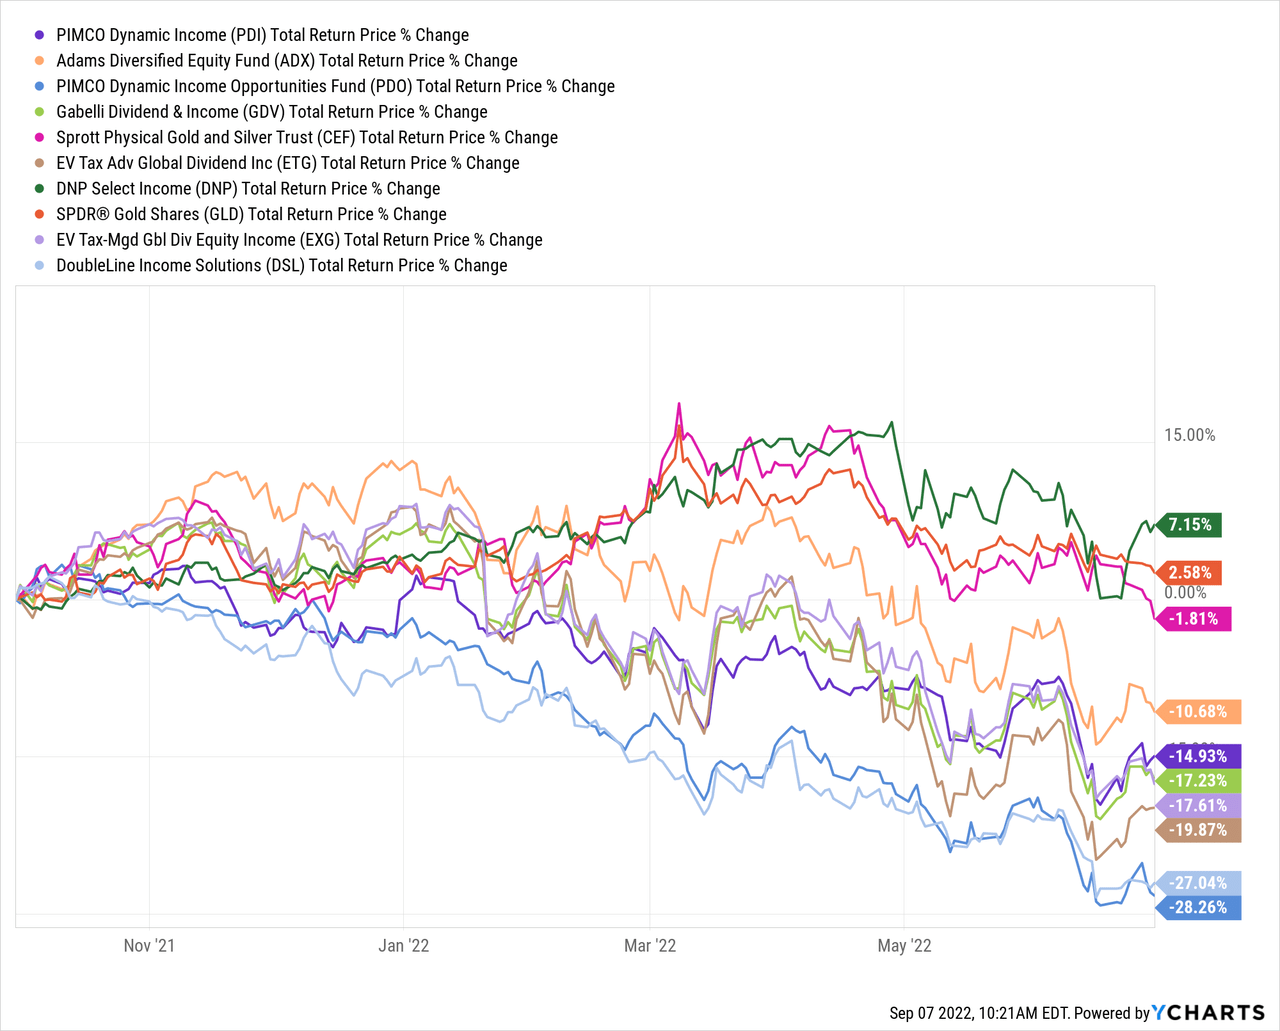
However, the large increase for PDI to propel it to the top position was the merger. PIMCO Dynamic Credit & Mortgage Income Fund (PCI) and PIMCO Income Opportunity Fund (PKO) were merged into PDI. That was completed in December 2021.
Another PIMCO fund has also been gaining traction in FOF’s portfolio. That is the PIMCO Dynamic Income Opportunities Fund (PDO). It was previously the ninth largest position for the fund, and it has now moved up to the third largest position.
During the reporting period, though, it was the worst performing of the top ten. Remember, some of this had to do with discount widening and not the actual comparison of the underlying portfolio. For FOF, it doesn’t matter what the NAV does for these funds, but the share price is what counts for FOF. At least, when we are looking at why the weightings might have shifted. In the long run, better NAV performance should lead to better results in the share price.
One of the reasons for this is that, at the end of June 30th, 2022, the fund held 832,270 shares of PDO. At the end of Q3 2021, it was only 461,915 shares. I don’t blame them either, as PDO became one of the cheapest PIMCO funds available. It also provided significant distribution coverage. So much so that they raised the payout of the fund. It had been a fund I was adding to personally.
Conclusion
FOF is an interesting fund and worth checking out for income investors. As a highly diversified fund, it can easily fit into any investor’s portfolio without disrupting asset or sector allocations. However, one of the main reasons to buy this fund is for a discount on discount. Due to the fund trading at a premium, I can’t get excited.
Be the first to comment