

marchmeena29
Written by Real-Time Retired Guy, co-produced by Nick Ackerman. This article was originally published to members of Cash Builder Opportunities on July 27th, 2022.
According to their website, “Fidus Investment Corporation invests debt and equity capital primarily in lower middle market companies located in the United States.” They are an externally-managed, closed-end, non-diversified management investment company. We know them better as a business development company (“BDC”).
Fidus Investment Corporation (NASDAQ:FDUS) has as its primary investment objective the generation of current income from their debt investments (primarily floating rate/senior loans) and capital appreciation from their equity investments.
Investment Strategy
FDUS utilizes a value-focused approach, investing primarily in mezzanine debt, senior secured debt and equity securities of companies having revenues in the range of $10 – $150 million.
At the close of the calendar year 2021, FDUS had debt or equity investments in over 70 companies with an aggregate value of over $719 million.
As of July 22, 2022 (according to data found on cefdata.com), FDUS’ portfolio was weighted as follows:
- First Lien Senior Secured Debt – 54.4 percent
- Second Lien Senior Subordinated Debt – 20.4 percent
- Common Stocks – 18.3 percent
- Unsecured/Subordinated Debt – 4.9 percent
- Preferred Stock – 1.2 percent
- Warrants/Options – 0.4 percent.
FDUS’ investment mix has performed quite well, with a ten-year total return of 13.4 percent, a five-year total return of 14.1 percent, a three-year total return of 17.4 percent, and a year-to-date total return of 9.1 percent. These are excellent returns considering the COVID market impact and the 2022 bear market.
Current Investment Portfolio
FDUS’ industry exposure is well-diversified among 13 sectors. The following is a current summary of their holdings as prepared by CefData:
- IT Software – 25.8%
- Healthcare and Pharma – 14.4%
- Manufacturing – 10.3%
- Business Services – 8.1%
- Consumer Products – 7.8%
- Energy – 4.8%
- Defense – 4.1%
- Transportation – 4.1%
- Media – 3.5%
- Investment Funds – 3.2%
- Industrial/Capital Equipment – 2.9%
- Environmental Services – 2.7%
- Other Products/Services – 8.3%
- Annual portfolio turnover is about 12%.
Financial Data
In order to provide a realistic assessment of the outlook for FDUS going forward, we shall look at specific financial information including: earnings and revenues trends and estimates, net asset values (NAV), dividends and dividend coverage, and price/NAV history.
Fortunately, there are a number of websites that now offer extensive coverage of the BDC sector. These include: cefdata.com, bdcinvestor.com, and a weekly BDC insight provided by Raymond James.
Net Asset Values
At a market price of $18.64 and with a present NAV of $19.91, FDUS currently trades at a discount to NAV of 6.4 percent. Over the past ten years, the discount has fluctuated from 65 percent (during the COVID inflection) and a premium of 39 percent in 2014. The average discount ranges from about two percent to 18 percent, so the current level of six percent is not a great bargain.
FDUS Premium/Discount History (Fidus Investment)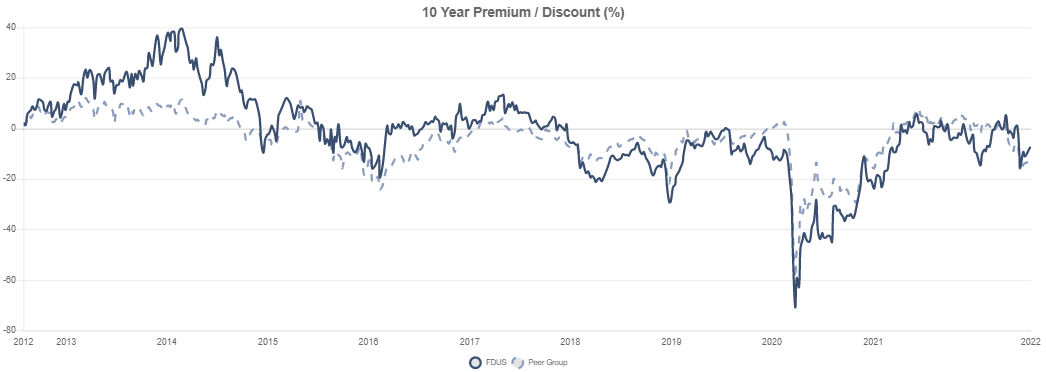
Since 3/31/2015, FDUS’ NAV has steadily increased from $15.18 to its present level of $19.91 (I have excluded the drop experienced in early 2020 due to the COVID impact on all stocks. This indicates that not only have they been covering their distribution to investors, but shows they’ve been able to grow on top of that.
Recent Earnings and Income Trends
Since 2018 earnings per share (EPS) have generally been increasing. (excluding 2019). The following represents their diluted annual EPS for these five years:
- 2018 – $1.54
- 2019 – $1.44
- 2020 – $1.55
- 2021 – $1.77
Source: CNN Business
During this period, revenues have shown a similar increase:
- 2018 – $76.4 million
- 2019 – $77.1 million
- 2020 – $85.1 million
- 2021 – $90.4 million
Source: CNN Business
Total investment income (TII), adjusted net investment income (NII), and NII/share (arguably the most important numbers when evaluating BDC’s) for FDUS during this same period was as follows:
- 2018 – TII = $76.4 million, NII = $37.7 million, NII/Sh = $1.42
- 2019 – TII = $77.1 million, NII = $35.3 million, NII/Sh = $1.31
- 2020 – TII = $85.1 million, NII = $38.0 million, NII/Sh = $1.62
- 2021 – TII = $90.4 million, NII = $43.3 million, NII/Sh = $1.77
Source: FDUS Annual Reports
Dividends and Dividend Coverage
Investors generally purchase shares in BDCs to harvest the dividends, which, on a yield basis, are quite high in comparison to other stock sectors.
Since 9/30/2011, FDUS’ dividends paid have increased from $.32/Q to the current level of $.36/Q, excluding special dividends, which, over the past four quarters, have been fairly substantial ($.04 in 9/21, $.05 in 12/21, $.17 in 2/22, and most recently $.07 in 5/22). So, over the past 12 months, FDUS has paid a total of $1.79/share. Their annualized regular dividend is currently $1.44/share.
FDUS NAV Growth and Cumulative Dividends (Fidus Investment)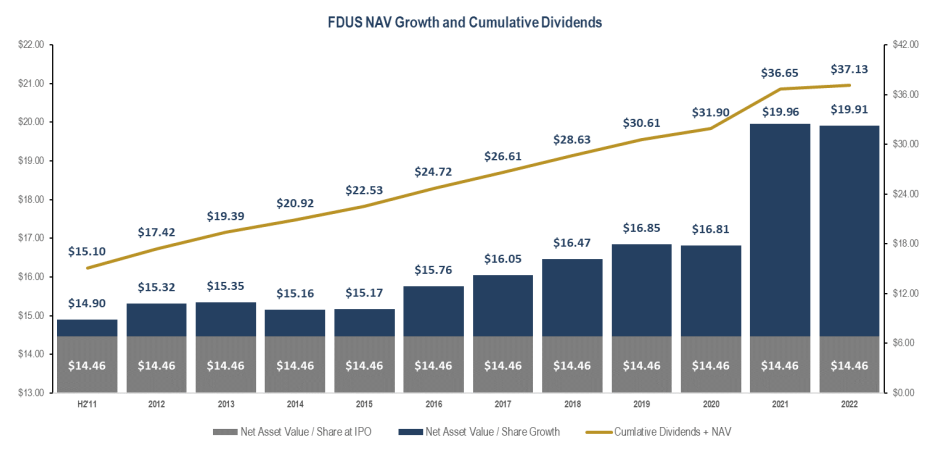
The dividend coverage is measured by the net investment income (NII)/dividend paid. We present the quarterly dividend coverage (post-COVID) for FDUS as follows:
- Q4 2020 NII = $.25 (Adjusted $.44), Div = $.38, Div Coverage = 116%
- Q1 2021 NII = $.46, Div = $.39, Div Coverage = 118%
- Q2 2021 NII = $.42, Div = $.38, Div Coverage = 111%
- Q3 2021 NII = $.40, Div = $.36, Div Coverage = 111%
- Q4 2021 NII = $.49, Div = $.36, DIV Coverage = 136%
- Q1 2022 NII = $.43, Div = $.36, Div Coverage = 119%
Over the past four quarters, core NII has covered dividends by 119 percent. In the most recent quarterly report, FDUS reiterated that since their IPO, they have paid out 18 special or supplemental dividends totaling $1.39/share. In addition, as of March 31, 2022, they have $1.77/share in undistributed spillover income remaining.
Earnings Forecasts And Analysts’ Price Targets
Several financial publications and investment analysts have made forecasts both for future earnings and price targets for both 2022 and 2023.
Earnings
The consensus earnings estimates for this time period are as follows:
- Q2 2022 – $.42
- Q3 2022 – $.44
- FY 2022 – $1.63 (Low), $1.71 (High)
- FY 2023 – $1.74 (Low), $1.90 (High)
No estimates have been provided for dividends going forward; however, it is assumed that the base annual dividend of $1.44 will remain in place and that all, or a portion of the undistributed spillover income of $1.77/share will be allocated to shareholders on a quarterly basis, as has been the case for the prior four quarters.
Analysts Forecasts
A fair number of analysts follow FDUS and have provided share price forecasts for the coming twelve-month period. These are as follows:
- Low – $19.50/share
- Median – $21.00/share
- High – $21.50/share
I have no idea as to what overall market conditions go into making these price forecasts, and also no clue as to how accurate analyst estimates have been for FDUS in the past, but I believe these target prices assume there will be no extended bear market.
Comparisons Versus Peer BDCs
Raymond James publishes a BDC Weekly Insight report on the BDC sector. These statistics provide a good picture of how FDUS is performing relative to about 50 other BDCs. The following data relating to FDUS was published by Raymond James on July 21, 2022:
- Year-To-Date Total Return – 9.4% (Ranked #1)
- Trailing 12 Months Total Return – 21.9% (Ranked #2)
- Price/NAV – 0.94 (Ranked Just Below Mean of 0.89)
- Dividend Coverage – 100.0% (Ranked Just Below Mean of 101.3%)
- Quarterly Dividend Growth – 10.3% (Ranked #15)
- Debt/Equity Ratio – 77.9 (Ranked #8)
- Return On Equity (GAAP) – 25.8% (Ranked #3)
From these data, one can see that FDUS has a very high ranking among its peers.
Conclusion
I have personally owned FDUS for about two years and have benefitted from the past four quarters of special dividends. As a retired person, my buy/sell decisions are generally based upon a company’s industry outlook; dividend growth potential; and the implied impact of the overall economy on stock market performance.
From the research that I have recently completed, it appears that the BDC sector has a very favorable outlook going forward for the next few years, probably due to the predominance of floating rate loans in their portfolios.
With respect to the FDUS dividend stream, it would also appear that shareholders have a reasonable expectation of additional special dividends over the coming quarters, hence a growing yield.
With respect to adding to my existing FDUS position, the big “if” for me is the country’s economy, interest rates, and inflation, none of which is particularly exciting at this point. Supposedly, if interest rates continue their upward path, the floating rate loans held by FDUS will increase revenues. Of course, the downside would be that as rates increase, so might defaults, which would adversely affect FDUS.
As far as stock market performance going forward, I don’t see a clear return to the bullish performance of the past few years. In fact, I think there is the potential for a moderate to severe bear market during the balance of 2022 and into 2023. Looking back to the last major bear market (2008 – 2009), we know that in such a situation, all stocks go down. My layperson’s outlook is for the markets to be range-bound until at least the November elections.
Equating the above with analyst targets for FDUS, one could expect about 5.4 percent price appreciation to the low target of $19.50, about 13.5 percent price appreciation to the mean target of $21.00, and 16.2 percent price appreciation to the high target of $21.50. Adding a current regular dividend yield of 7.7 percent to these would result in a decent total return.
Taking all of the above into consideration, I would currently rate FDUS a HOLD.
Be the first to comment