

Stadtratte/iStock via Getty Images
European stocks are heading higher over the past months, as have most stock markets, including the US, since the lows in October 2022. However, we may be heading for more turmoil until we know more about the final target for rates from the Fed.
That said, European stocks are beginning to look attractive and represent an opportunity for US stock investors. The European economy is not as vibrant as the US economy, and that is reflected in a typically lower GDP Growth rate.
However, the current foreign exchange rate for the EUR/USD creates an interesting prospect. Euro-denominated stocks are looking cheap from the point of view of an investor with a book in US dollars.
We’ll look into this in detail shortly, but briefly, the Euro is extremely cheap compared to the dollar. That gives US investors a possible discount at this price, if and when the EUR/USD retraces higher. We’ll look at the SPDR Euro STOXX 50 ETF and also the general outlook for the EUR/USD
SPDR Euro STOXX 50 ETF (NYSE: NYSEARCA:FEZ)
The FEZ ETF invests in stocks that make up the capitalization weighted index of the Euro STOXX 50. The top 10 holdings are listed below and closely follow the weightings of the index. The top 10 holdings represent 43.51% of the company, and the market capitalization of each stock is above $82 billion.
Top 10 holdings FEZ (State Street Global Advisors)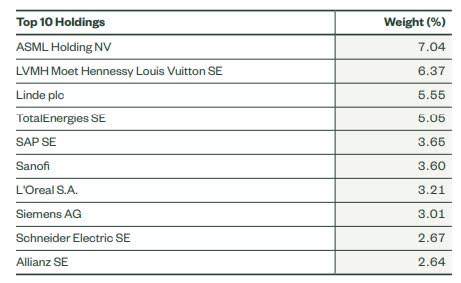
FEZ ETF Details
-
AUM: $2.04 Billion
-
Price: $41.90
-
Daily volume:: 2.5 million shares
-
Expense Ratio: 0.29%
-
Inception: October 15, 2002
-
Issuer: State Street
FEZ ETF Performance
The FEZ ETF closely tracks the Euro STOXX 50 index, the recent performance of the fund is detailed below:
| YTD | 6.70% |
| 1 month | 5.46% |
| 6 months | 25.52% |
| 1 year | -9.80% |
| 5 years | -0.64% |
| 10 years | 17.93% |
| Max | 67.60% |
FEZ ETF Technical Viewpoint
Let’s take a look at the price performance of the ETF. Looking at the weekly chart, we can see that the recent rally that started in October 2022 is now trading in the Ichimoku cloud. This is a resistance area and needs to be broken to confirm the bullish trend.
At the start of the week price action has cleared the cloud, however, the lagging line (green line) needs to clear the cloud also to confirm the trend. Price action is also hovering around a resistance area (blue line) from a previous retracement tested various times back in February and March 2022.
Clearing that resistance area is another indication of the strength of the bullish momentum. But we’ll have to wait at least until the end of this week before we might make a conclusion. The RSI is also indicating bullish momentum as it’s above 50 and its moving average as it heads higher.
TradingView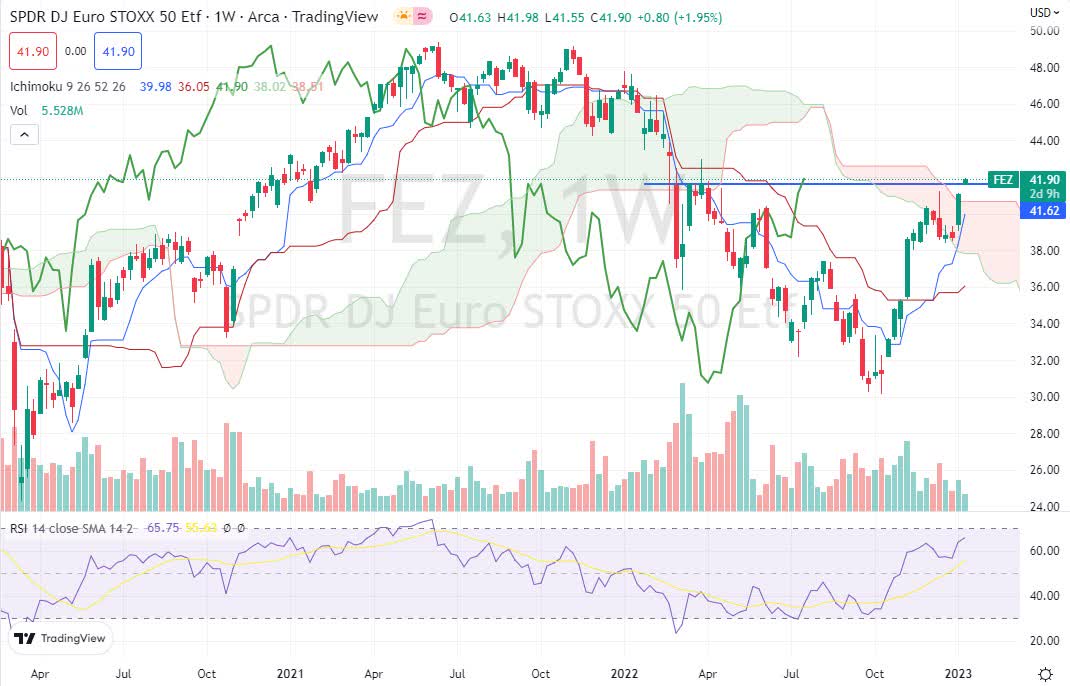
The daily chart shows a clear short-term bullish trend, with price action above the cloud, and all secondary indicators of the Ichimoku system confirming the bullish trend. The RSI is also indicating strong bullish momentum.
Should price action retrace, we would expect support to appear at the area on the top side of the cloud at $39. Whereas, a break upwards of the cloud and resistance area on the weekly chart would see the next price target at $45.
Quant Rating
The Quant rating gives FEZ ETF a Buy. As we can see below, only one of the 5 factors is low. Risk gets a rating of D+. Which I guess is mainly why this ETF doesn’t get a Strong Buy rating instead.
Quant Rating (Seeking Alpha)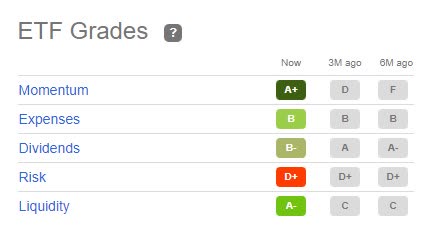
Expanding the Risk Grade, we see exactly why this ETF gets a D+ for risk. The standard deviation is 31.12 which is 35.78% higher than the average of all ETFs. That may be a disadvantage at times, but when you are bullish about a security I think you should see it as an advantage.
Seeking Alpha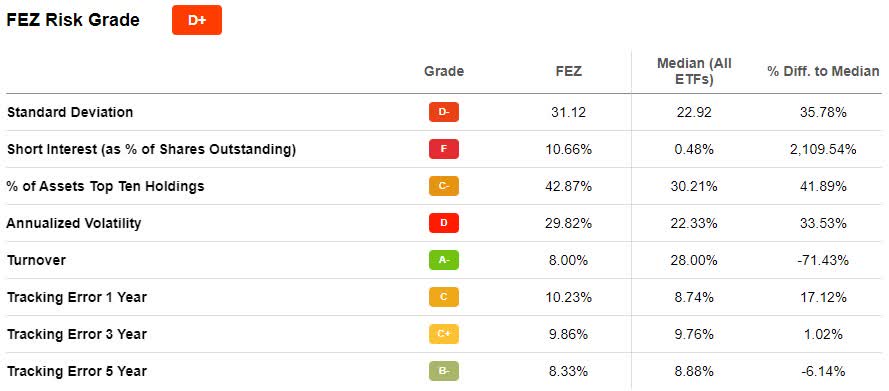
The other element in the factor that is low is the percentage of short holdings at 42.87% compared to an average in all ETFs of 0.48%. However, I wonder which ETFs are included to make that average. And I would also imagine Europeans may still be more interested in being short, as there is no exchange rate incentive.
FX Rate & Analysis
Let’s have a look at the technical analysis for the EUR/USD currency pair. Before we get into that, let’s consider the buying power ratio of both currencies. Sometimes known as the Big Mac index. The theory is that in countries where economies are developed to a similar level, products should have similar prices.
We can certainly apply this theory to the United States and Europe. It’s known more appropriately as the Purchasing Power Parity (‘PPP’). From the OECD website, we can see that the PPP between Germany and France (Europe’s largest and 2nd largest economies) is at 82 compared to the US.
Table of Purchasing Price Parity US dollar Vs Euro (OECD)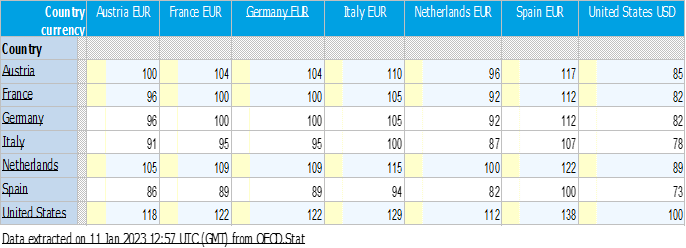
When PPP is even or at 100, it means a Big Mac in one country costs the same as in the other country, once the exchange rate is taken into account. So, we can see that the basket of goods covered by the OECD is 18% cheaper in Europe than in the US.
In other words, the difference in PPP implies that the exchange rate is undervalued by 18%. With the current exchange rate at 1.0750, that means it would need to rally to 1.2685 to achieve purchasing price parity.
EUR/USD Fundamentals
All currency pairs are governed by the same fundamentals. Or rather, the expectations held for GDP growth, inflation, and unemployment. And the comparison between the two countries’ data. As the Euro area has a historically higher unemployment rate than the US, the analysis is somewhat redundant.
I only consider GDP and Inflation. Inflation incorporates the central bank interest rate policy. As currencies are strongly affected in the short term by the difference between the two rates, they are also taken into account.
The OECD forecasts for GDP growth in the Euro area and the US are in the table below. We can see how after a dip in Q4 2022 and Q1 2023, the Euro area is expected to show positive growth again through to Q4 2024.
The GDP growth rate for the Euro area outperforms the US GDP growth rate from Q2 2023 to Q2 2024. After which it’s still positive but slightly lower than the US. This factor implies a strengthening Euro compared to the US dollar.
GDP Growth Forecast (OECD)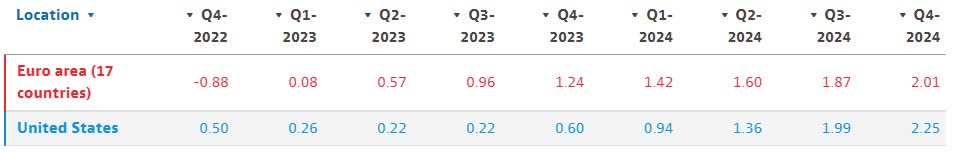
Looking at inflation, we can see from the forecast from the OECD that inflation is expected to trend lower and faster in the United States through 2023. We also see how the gap widens for 2023 until it closes toward the end of 2024.
High inflation in the long term will devalue a currency compared to the currency of a country with lower inflation. However, that is the long-term consequence. In the short-term, higher interest rates imposed in the country with higher inflation will most likely strengthen the currency.
Inflation forecast (OECD)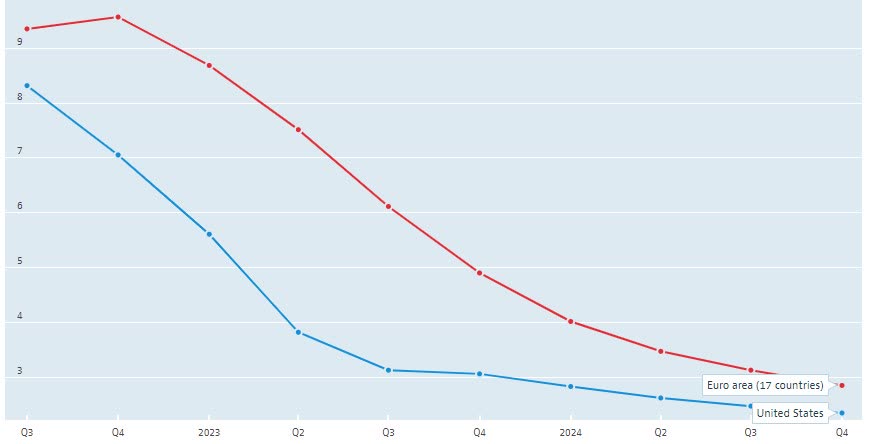
Those watching the FX markets closely will have noticed how the Fed’s tightening monetary policy sent the dollar higher. And how it particularly affected the Euro until the ECB started hiking interest rates enough to slow down the plunge in the Euro.
The Fed’s tightening cycle is likely to get closer to its top before the ECB does. Since the ECB started hiking later and still has further to go. So, we can expect the policies of the two central banks to favor the Euro. At least through to the end of 2024.
EUR/USD Technicals
Looking at the weekly chart for the EUR/USD, we can see that the current bullish trend started towards the end of October 2023. After breaking a major resistance line (black sloping line) the market continued to push up unabated.
Price action has now hit the Ichimoku cloud, and we can expect some resistance. Plus, the market has reached a previous resistance level (short blue line) creating more opposition to further highs. However, the RSI is very bullish and indicates strong upward momentum.
If the market clears this resistance level the next stop will be at the area of 1.10618. Which corresponds to a previous support area from March 2022. Clearing this level would see the next price target at 1.1478 as the market breaks through the cloud. And an extended target area of 1.2300, which is the high for 2021.
TradingView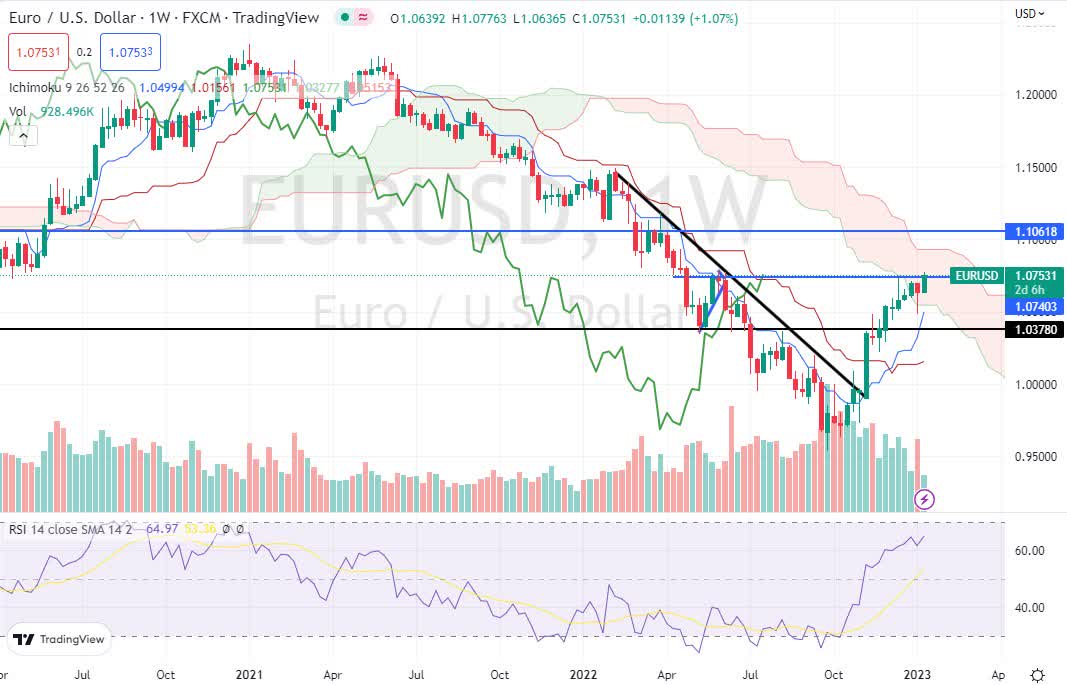
Conclusion
So, all things equal, the investment into European stocks is currently at a discount of 18% when we compare the PPP between the US and the Euro area. In my opinion, PPP eventually brings things into line. Although I have seen extended periods, in terms of years of PPP being out of equilibrium.
However, the fundamental analysis would lead us to believe that we are heading towards a higher exchange rate for the EUR/USD, and that could mean an extra return if or when the European stock market makes a comeback.
Other options exist for European ETFs, but they invest in a much wider selection of stocks. The largest two, Vanguard’s VGK and BlackRock’s EZU have 1,373 and 236 different stocks respectively. FEZ has 50, keeping the fund invested in the biggest companies in Europe.
Be the first to comment