

pabradyphoto
I’d like to think that last week’s post got the ball rolling, because the impulse for the 5.6% rally in the S&P 500 over the past three days looks to be declining expectations for Fed tightening. I thought it was inevitable: a super-strong dollar, collapsing housing and commodity prices, and a huge increase in real interest rates were all but shouting at the Fed to back off and give the economy some time to digest things.
The following charts highlight three major news items revealed today:
Chart #1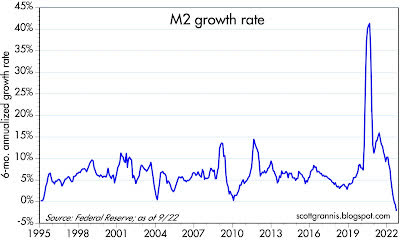
As I’ve been noting for well over a year, Chart #1 (growth of the M2 money supply) is the most important financial news that nobody (outside of a handful of economists) has been paying any attention to. As the chart shows, there was explosive growth (completely unprecedented!) in the money supply in 2020, driven almost entirely by the monetization of Covid stimulus payments in 2020-2021. This was the proximate cause of the inflation which has wracked the country for almost two years. Fortunately, with the cessation of Covid payments in mid-2021, M2 growth cooled dramatically: M2 has not increased meaningfully for the past 9 months, and it has in fact declined at a 2.2% annualized rate over the past 6 months, as we learned from this morning’s release of the September numbers. This all but guarantees a future decline in measured inflation.
If the Fed had been paying attention to the slowdown in M2, they would have toned down their tightening 4-5 months ago. And of course, if they had been paying attention to M2 18 months ago, they would have begun raising rates long before it became painfully obvious that we had an inflation problem.
Chart #2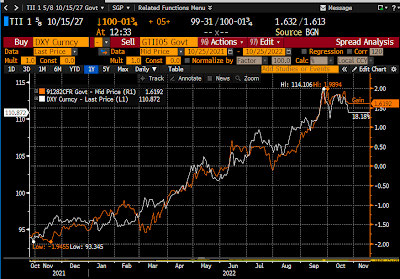
Chart #2 compares the value of the dollar (white line) with the level of real interest rates on 5-yr TIPS. Long-time readers will know that 5-yr real yields are the market’s expectation for what the real Fed funds rate will average over the next 5 years, and as such they are the best measure to watch for how much the Fed is expected to tighten. These two variables have been joined at the hip for at least the past year: rising real rates have tracked the increase in the dollar’s value on the forex markets. Declining real yields this month have closely tracked the decline in the dollar’s value. A weaker dollar has nearly everyone breathing a sigh of relief. Maybe the Fed won’t have to cause a recession after all… as I argued in a post last August.
Chart #3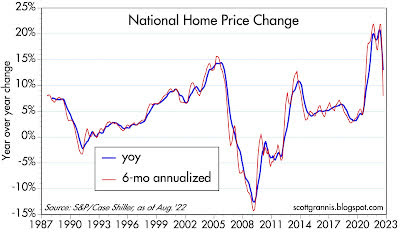
The other big piece of news this morning was the sharp decline in national home prices (Chart #3 shows the 12- and 6-month rates of growth of prices). It’s important to note that the August number is actually an average of prices over the 3 months ending in August, which means that prices today are almost certainly much lower than the chart suggests. This decline in prices was virtually assured, given the doubling of 30-yr mortgage rates this year and the huge decline in new mortgage originations that I highlighted last week (Chart #3 of this post). The last thing the Fed needs to do is kill the housing market yet again (remember 2008?).
The next FOMC meeting is scheduled for November 2nd, and it’s going to be very important. Not too long ago the market thought a 75 bps hike in the funds rate (to 4.25%) following that meeting was virtually assured. Now it’s questionable, while a 50 bps hike is beginning to look like a (remote) possibility.
Editor’s Note: The summary bullets for this article were chosen by Seeking Alpha editors.
Be the first to comment