

ISM Manufacturing & US Dollar Talking Points:
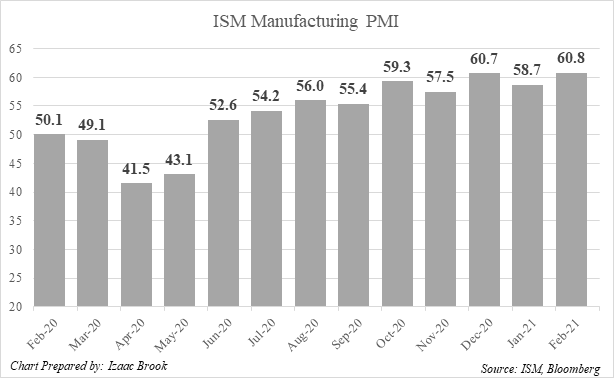
- ISM Manufacturing PMI for January prints at 60.8 versus forecast of 58.8
- Print is slightly higher than December’s, setting a new pandemic high
- DXY strength continues following late February’s Treasury yields volatility
February ISM Manufacturing PMI Hits a Pandemic High, USD Firms Above 91.00
US manufacturing activity in Februarybeat expectations as the ISM Manufacturing PMI printed at 60.8 versus a forecast of 58.8, hitting its highest level since 2018. While activity declined between December and January, February’s print shows continued strength from the manufacturing sector.
The accompanying ISM press release noted, among other details, that optimism across survey participants had increased and that the price index component rose to its highest level since May 2008 as labor shortages and supplier issues have driven input prices higher. Respondents cited continued absenteeism, short-term sanitization-driven shutdowns, and hiring difficulties as factors limiting further potential growth.
Manufacturing PMI serves as an important proxy for US GDP data, giving markets a closer and more timely look at an important component of the US economy. PMI prints above 50 denote an expansion and below 50 denote a contraction. Following the slump in spring 2020, manufacturing activity crossed back into expansionary territory in June and has remained there since.

Recommended by Izaac Brook
Trading Forex News: The Strategy
Recent US economic data shows the economic recovery proceeding as expected. Last Friday saw a number of important metrics for January print in line with their forecasts. For this week, markets are looking towards the February ISM Services print to get a closer look at the largest sector of the US economy and Friday’s February NFPs and Unemployment Rate prints.
Biden’s stimulus package cleared the House of Representatives early Saturday, advancing the bill to the Senate. Democrats hope to have the bill passed by March 14th, when jobless benefits are set to expire. The stimulus plan should be a large tailwind for the economic recovery.

Recommended by Izaac Brook
Get Your Free USD Forecast
After falling to a three-week low around 89.75 in late February, the US Dollar rebounded as longer-term yields moved sharply higher. On Monday morning, the DXY traded around the 91.00 level, its highest point since early February.
US Dollar Index Price Chart: 2 Hour Time Frame (December 1st, 2020 – March 1st, 2021)
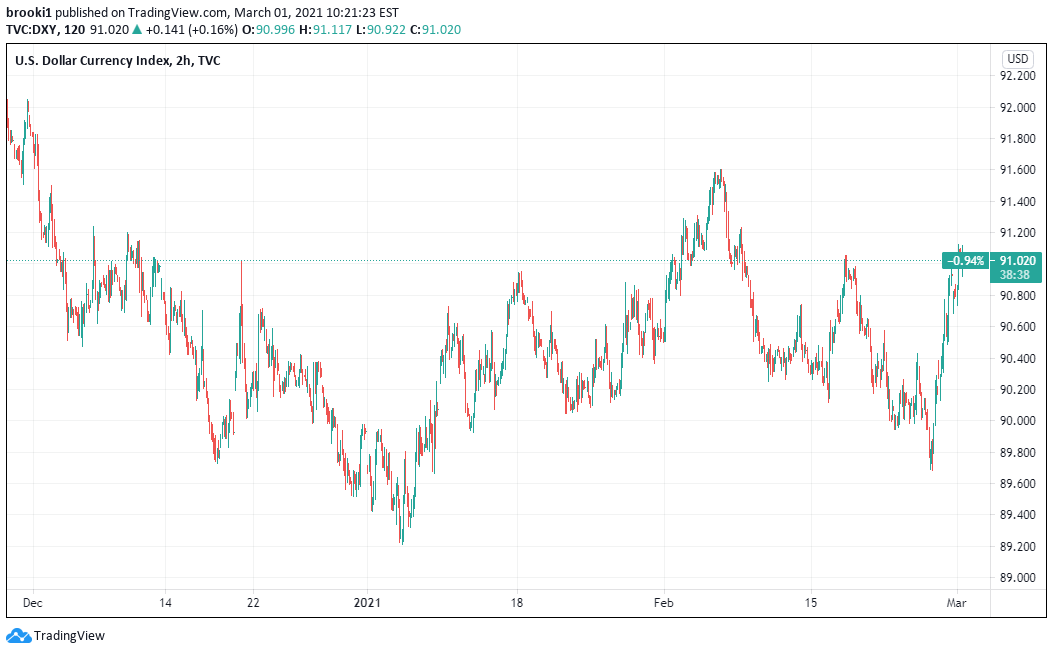
Chart Prepared by Izaac Brook, Source: TradingView
The DXY whipsawed in the aftermath of the February ISM Manufacturing print. The index rose from 91.05 to briefly test 91.10 before turning back downward, returning to trade around the 91.05 level.
US Dollar Index Price Chart: 1 Minute Time Frame (March 1st, 2021)
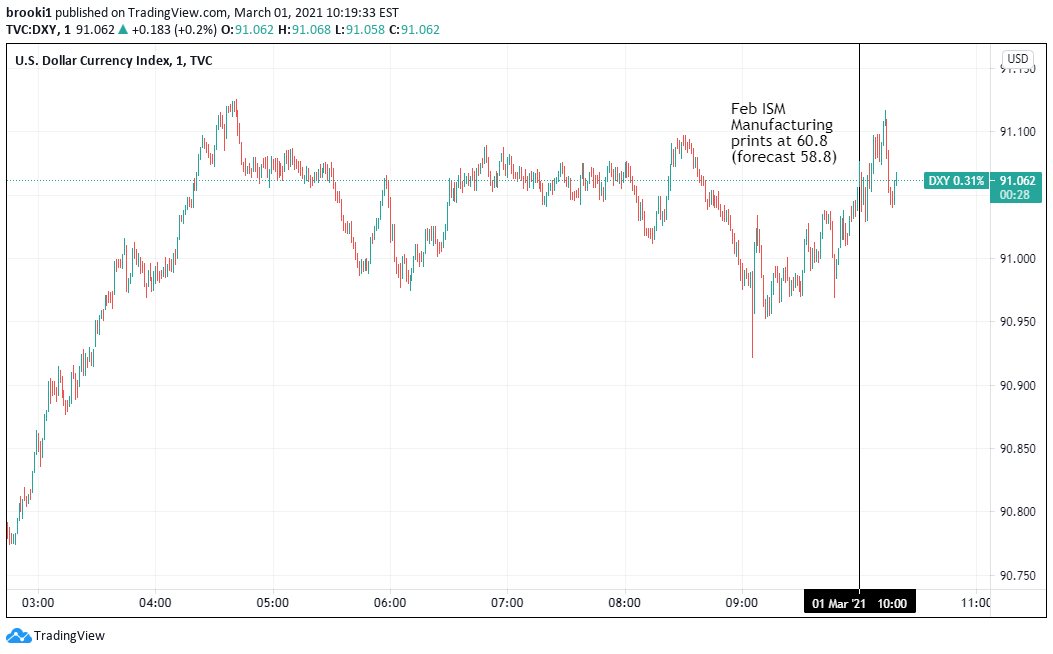
Chart Prepared by Izaac Brook, Source: TradingView
— Written by Izaac Brook, DailyFX Research Intern
Be the first to comment