

DNY59
Investment Thesis
Peak inflation? That was the question put forth by Hoya Capital on Friday, as key economic data rolled in suggesting the worst of our inflation woes are over. The cure for higher prices may indeed be higher prices after all, as the cost of crude oil now sits below $90 per barrel, and the Producer Price Index fell for the first time since April 2020.
Personally, I’m on the fence and trying to play both sides of the market from a fundamental perspective. However, for dividend investors more bullish on long-term treasuries, I want to introduce you to the Fidelity Dividend ETF For Rising Rates ETF (NYSEARCA:FDRR). FDRR holds approximately 125 North American dividend-paying stocks selected for their positive correlations with 10-Year U.S. Treasuries. This ETF has outperformed the SPDR S&P 500 ETF (SPY) by 3% YTD, but my fundamental analysis will reveal how many of its features are average at best. There are cheaper dividend ETFs that will accomplish the same objectives, and I look forward to contrasting them with FDRR in this article.
FDRR Overview
Strategy, Sector Exposures, and Top Holdings
FDRR tracks the proprietary Fidelity Dividend Index for Rising Rates, selecting large- and mid-cap dividend-paying companies with returns positively correlated to increasing 10-year U.S. Treasury yields and are expected to grow their dividends from now on. According to the fund’s prospectus, stocks are ranked within each sector and given a composite score based on four metrics:
- high dividend yield
- low dividend payout ratio
- high dividend growth
- positive correlation of returns to increasing 10-year U.S. Treasury yields
Composite scores are adjusted based on market capitalization, and stocks with the highest scores are selected. International stocks may comprise up to 10% of the Index, and the Index is rebalanced annually near the end of February to sector-neutral weightings based on the broader equity market. This last part ensures only mild active sector weighting throughout the year. The table below shows that FDRR’s sector exposures are nearly identical to SPY.
Morningstar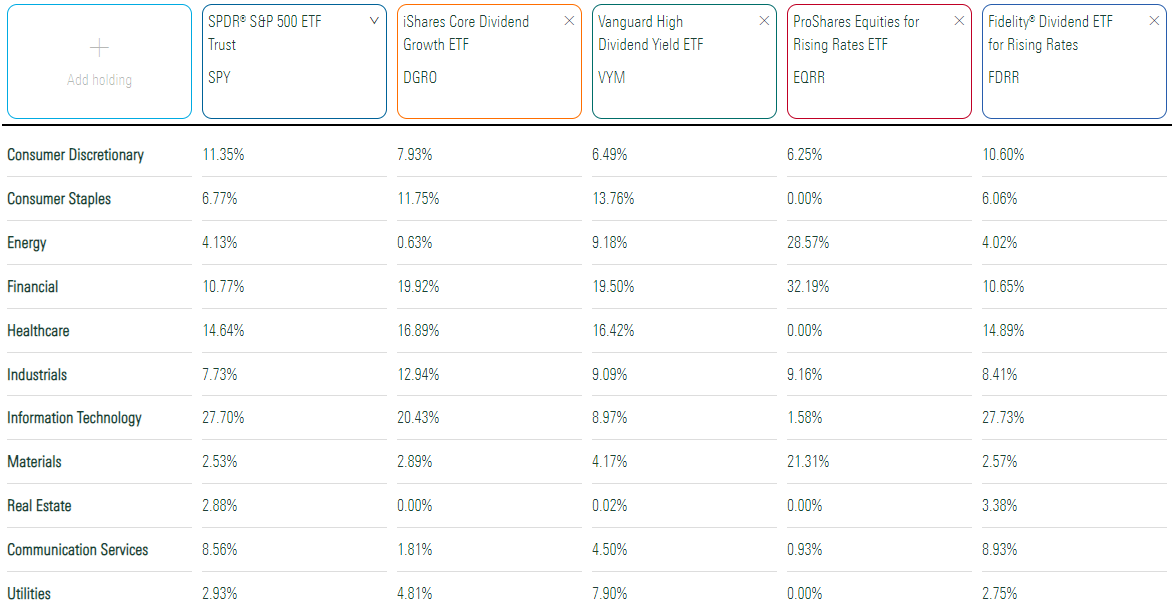
Technology stocks currently comprise 27.73% of the ETF, followed by Health Care (14.89%), Financials (10.65%), and Consumer Discretionary (10.60%). Included are sector exposures for the ProShares Equities For Rising Rates ETF (EQRR), covered here, which is dominant in Financials, Energy, and Materials. Finally, I’ve added the iShares Core Dividend Growth ETF (DGRO) and the Vanguard High Dividend Yield ETF (VYM) as potential low-cost alternatives.
FDRR’s top ten holdings and region exposures are below. Fidelity only provides this graphic quarterly as of June 30, 2022, so the weightings are slightly off. For example, according to the latest daily holdings report, Apple (AAPL) and Microsoft (MSFT) currently have 7.76% and 6.51% weightings.
Fidelity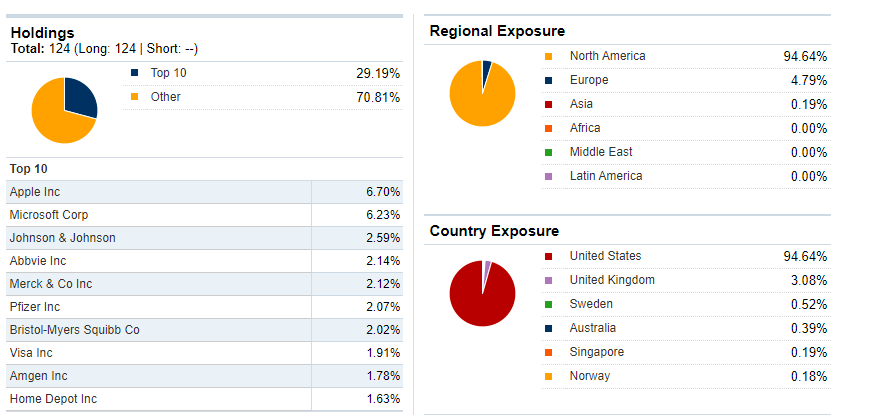
Only about 5% of securities are non-U.S. equities, so this is unlikely an advantage. Volvo (OTCPK:VLVLY) and British American Tobacco (BTI) are two names you’ll likely recognize.
Finally, other fund statistics worth noting include:
- Expense Ratio: 0.29%
- Assets Under Management: $586 million
- Dividend Yield (Trailing): 2.55%
- Three-Year Annualized Dividend Growth Rate: -0.37%
- Five-Year Annualized Dividend Growth Rate: 20.85%
- Dividend Frequency: Quarterly
- # Common Stock Holdings: 109
The dividend growth rates look odd, but that’s not uncommon for a relatively new fund. FDRR only launched on September 12, 2016, and as the ETF becomes more established, I think shareholders will start to see dividend payments stabilize. Quarterly payments look to be around $0.30 per share, but there was a large $0.41 per share payment in Q1 2020 as asset prices fell.
Seeking Alpha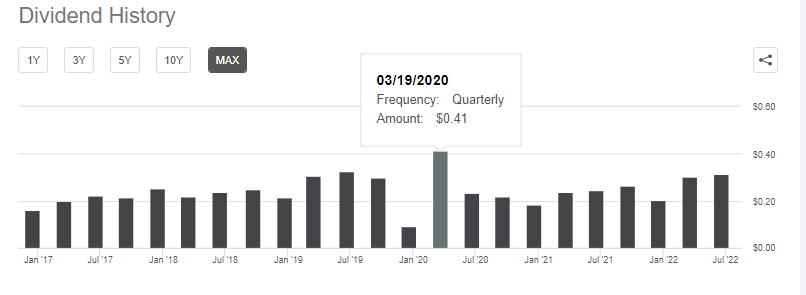
Performance History
The graph below compares FDRR’s performance against DGRO, VYM, and SPY since its inception. Overall, the results aren’t too bad, but they highlight the risks of investing in dividend- and value-oriented ETFs when those strategies aren’t in favor. Like VYM, FDRR substantially underperformed SPY by 2.34% per year, leading to a gap of over $2,500 on a $10,000 investment in less than six years.
Portfolio Visualizer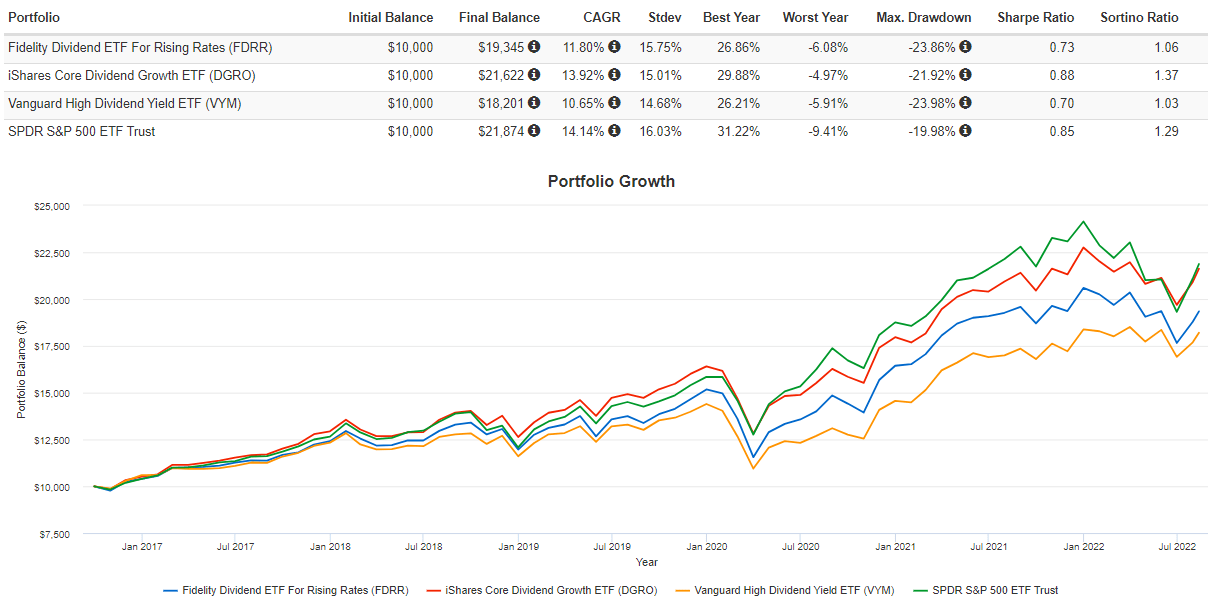
YTD, FDRR has clawed back over 3% relative to SPY, but DGRO and VYM have done better, with the latter nearly breaking even for the year. DGRO currently yields 2.00% with a 0.08% expense ratio. In comparison, VYM now pays 2.92% with a 0.06% expense ratio, so I want readers to consider these low-cost alternatives before thinking they need a novel strategy like FDRR.
Portfolio Visualizer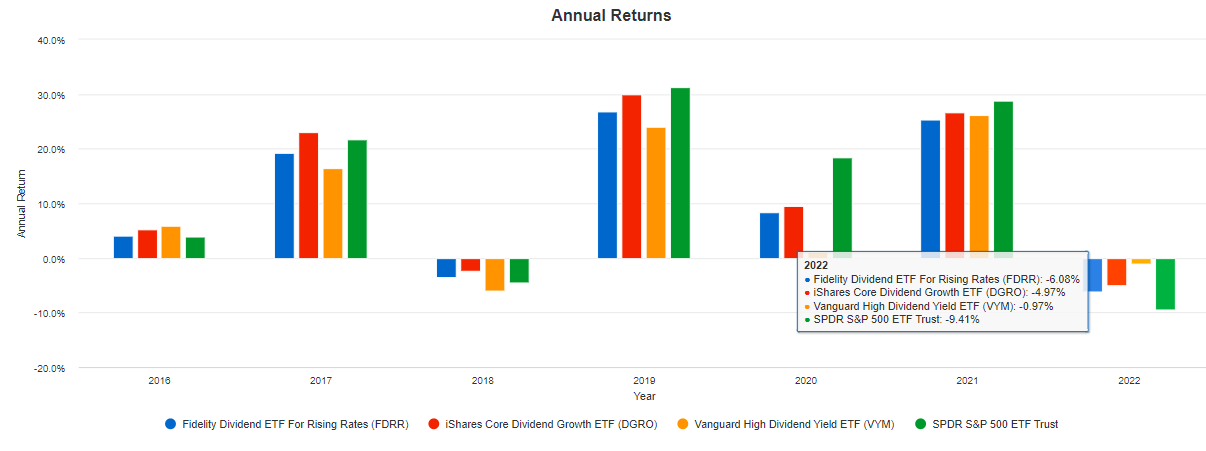
Against EQRR, we can see how much of an impact sector exposure differences can have. EQRR is undoubtedly much more volatile since it’s overweight the commodity-related Energy and Materials sectors, but arguably is a better choice for betting on rising interest rates. Higher inflation is often driven by energy costs, which leads to higher interest rates. FDRR’s sector-neutral strategy means it’s unlikely to have significant exposure to this sector in the foreseeable future, which is why I referred to it earlier as a moderately aggressive play on the direction of interest rates.
Portfolio Visualizer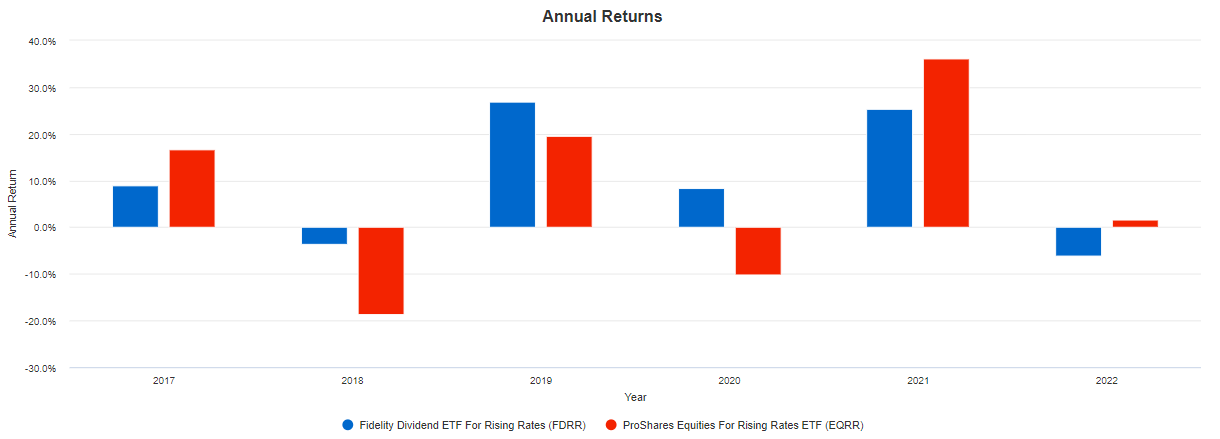
EQRR has been the better performer since 2021 as Energy costs rose, but it lagged from 2018-2020 as crude oil futures were between $50 and $70 most of the time. EQRR had a remarkable 50.66% drawdown from September 2018 to March 2020, while FDRR fell 23.86%, so the two have drastically different risk-return profiles despite seemingly having the same objective.
FDRR Analysis
Interpretation of Economic Data
Last week, investors received several key economic reports, including the Consumer Inflation Expectations report from the Federal Reserve Bank of New York, the Consumer Price Index, the Producer Price Index, and various Consumer Sentiment surveys from the University of Michigan. The table below, courtesy of Hoya Capital, summarizes the results nicely. Consumer Inflation Expectations came in slightly below forecast at 6.20% vs. 6.50%, as did CPI (8.50% vs. 8.70%). Also, the PPI fell 0.50% from June, its first month-over-month decrease since April 2020.
Hoya Capital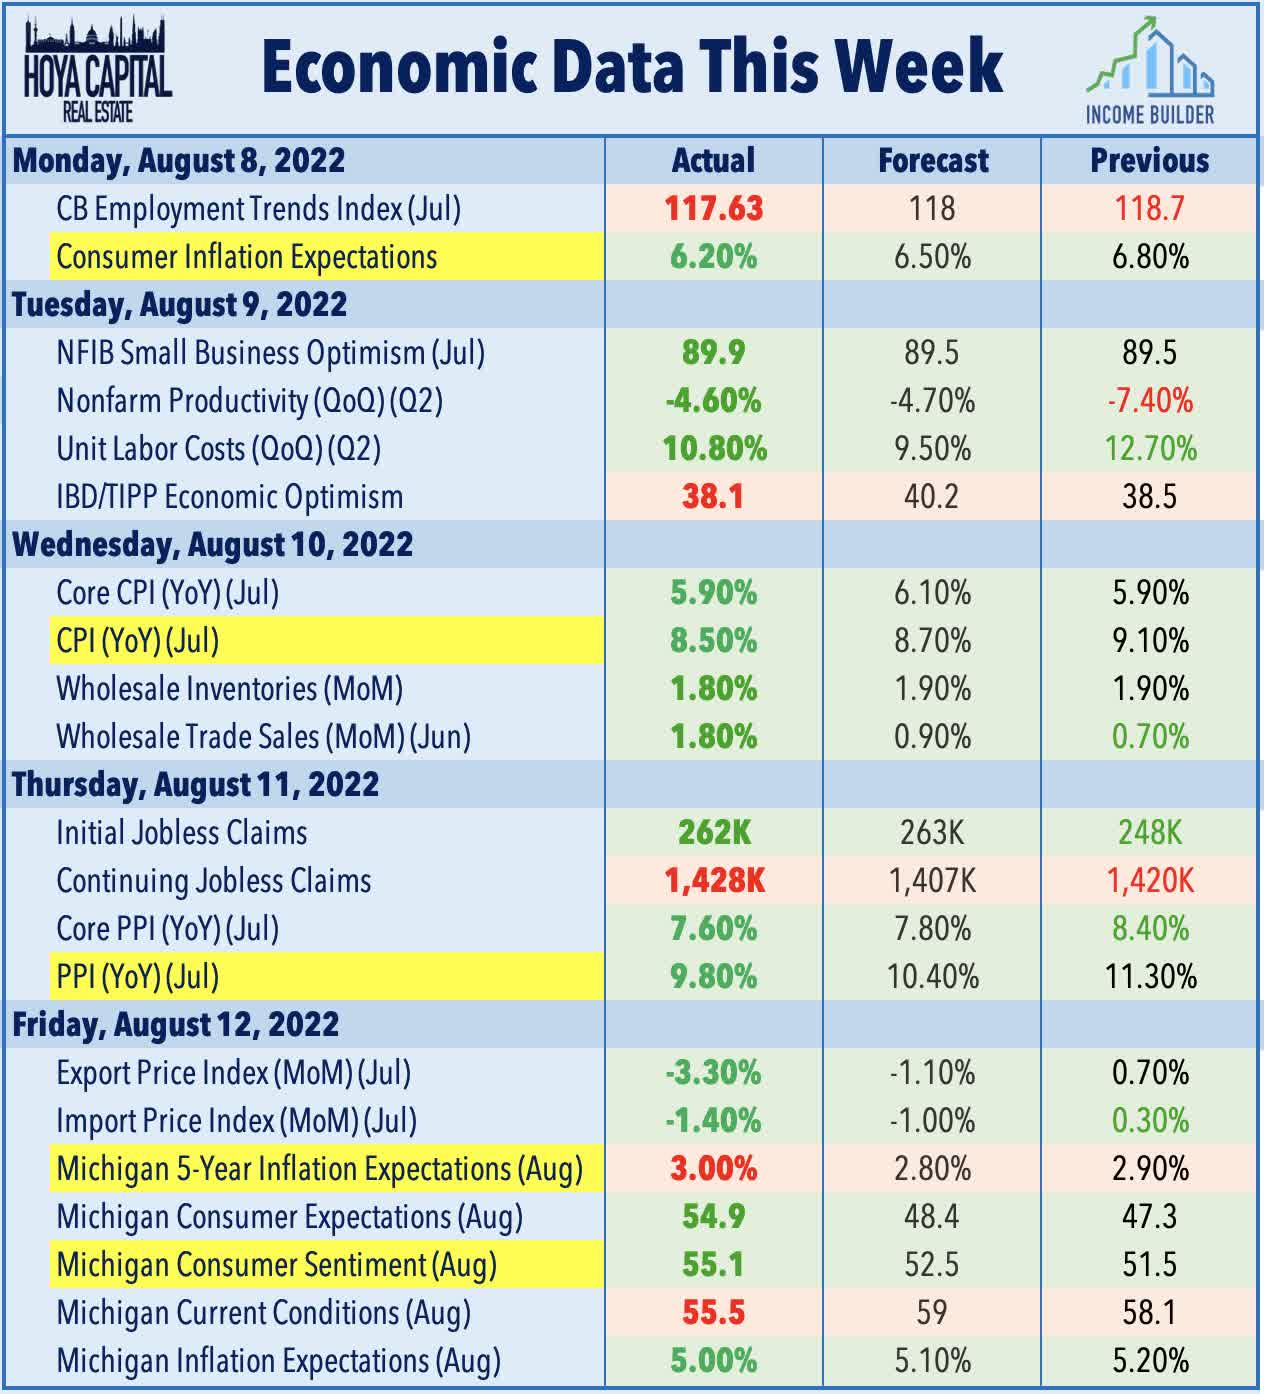
These results are not welcome news for ETFs like FDRR, as lower inflation puts less pressure on interest rates. However, the Michigan Consumer Sentiment Survey’s 55.1 August reading is an improvement from July’s 51.5 and the record low 50.0 reading in June. If consumers believe their financial situation will improve, they’re more likely to spend than save, fueling higher prices and interest rates. However, five-year inflation expectations ticked up to 3.00% from 2.90% last month, which may signal that higher rates are required.
Hoya Capital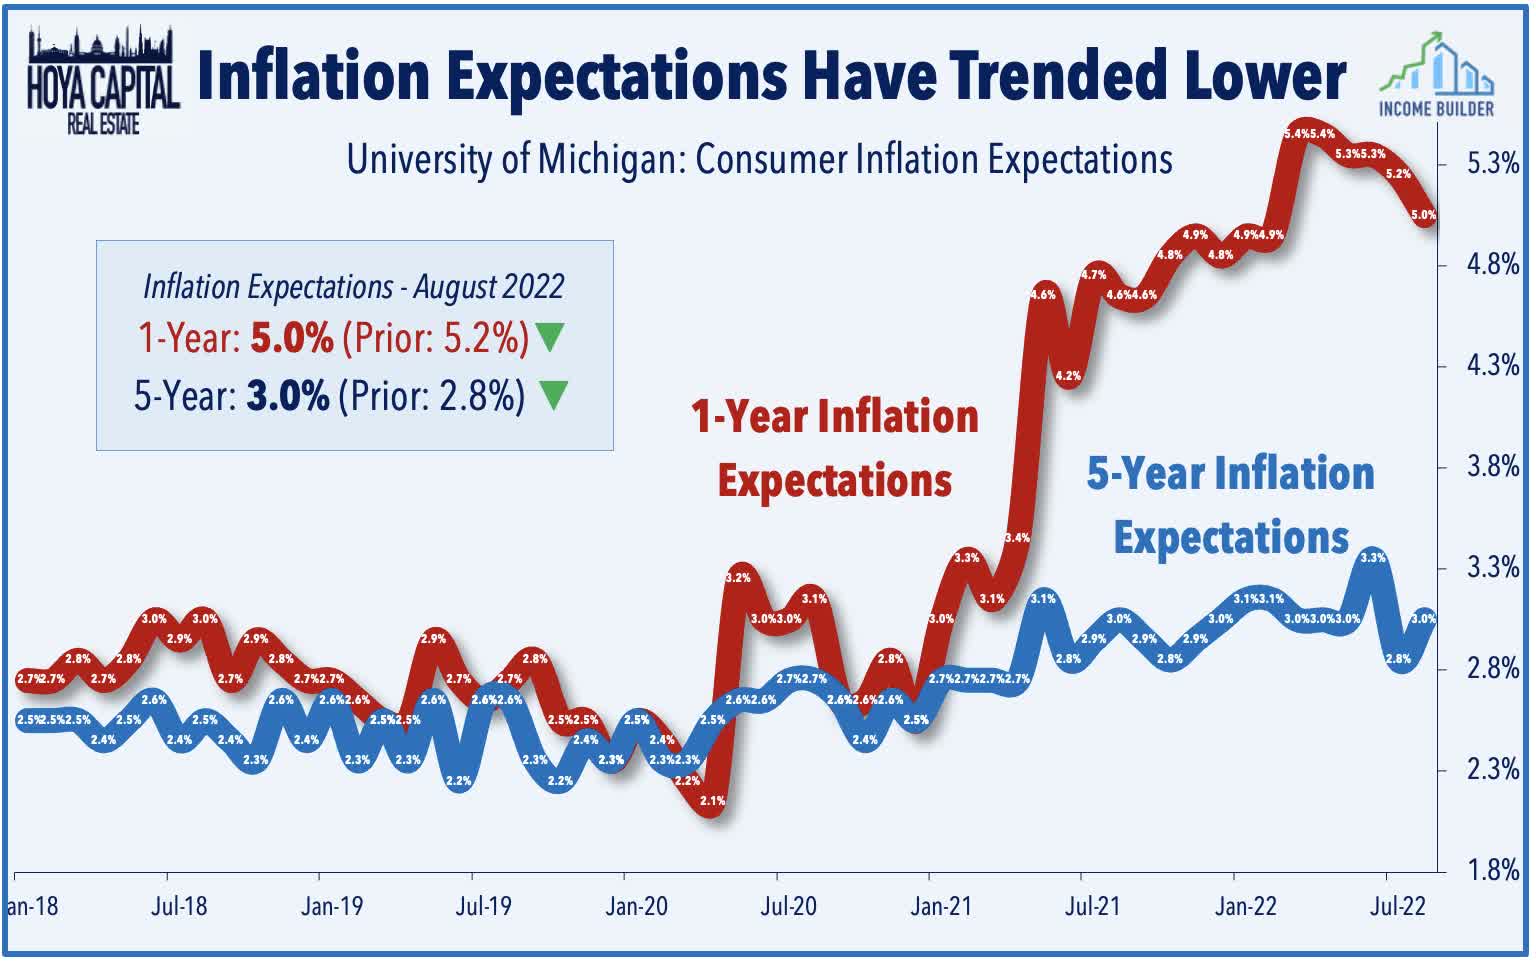
Fundamental Analysis By Industry
The table below highlights the fundamentals of FDRR’s top 20 industries. The last four bolded rows show the metrics for the entire fund alongside EQRR, DGRO, and VYM.
The Sunday Investor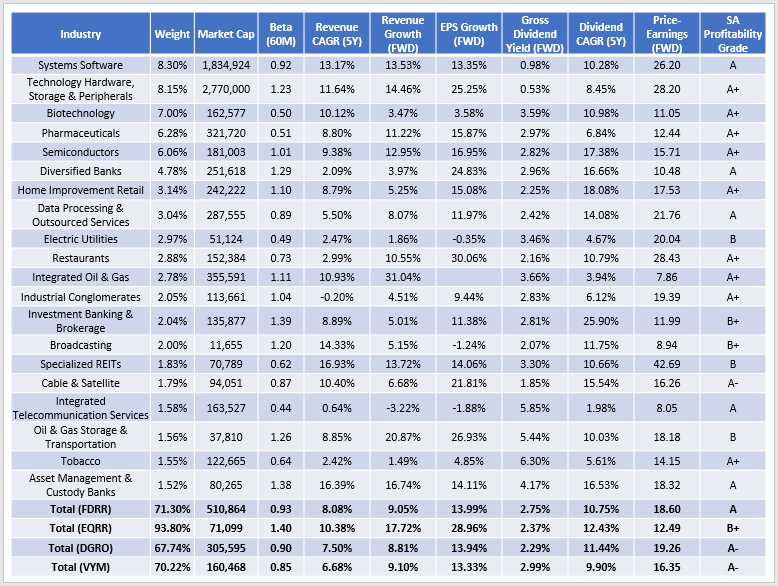
I want to highlight the following four points:
1. FDRR has a weighted-average market capitalization of nearly $511 billion, significantly higher than its peers. This figure results from its market-cap-weighting scheme and sector-neutral strategy, which ensures mega-caps Apple and Microsoft receive prominent weightings. These two Tech stocks are so large that excluding them and maintaining the requisite 28% exposure to the sector would be nearly impossible. DGRO is the closest due to its combined 6.31% exposure to these two companies.
2. FDRR’s five-year beta of 0.93 is about average for a dividend ETF, with DGRO slightly less volatile at 0.90 and VYM being the least volatile at 0.85. The low-volatility factor was prominent in the first half of the year, but there are signs of a reversal now, with riskier ETFs performing much better in July. In addition, you can quickly see how much riskier EQRR is with its 1.40 beta figure. As mentioned earlier, EQRR is a bet that commodity prices will continue to increase substantially. Still, based on my interpretation of economic data, it’s not something I would go all-in on now.
3. FDRR scores in line with DGRO and VYM on historical and forward sales and earnings per share metrics. The sales growth figures are a bit low for my liking, as I’ve targeted double-digit growth in the Active Equity ETF Model Portfolio I manage at Hoya Capital. However, the valuation is pretty solid at 18.60x forward earnings. That’s the 10th best out of 24 in the Large-Cap Dividend ETF Category, with DGRO comparable at 19.26x forward earnings.
4. FDRR’s gross dividend yield is 2.75%, or just under 2.50% net of fees. That’s better than DGRO’s 2.29% (2.21% net) but under VYM’s 2.99% (2.93% net). Current constituents have grown dividends at an annualized 10.75% rate over the last five years, placing it 33rd highest out of 65 dividend ETFs I track. Also not shown in the table above is FDRR’s weighted average 41.63% dividend payout ratio. Given that’s one of the screens, it’s not surprising to see FDRR in the top quartile on this metric. However, DGRO does just as well at 40.83%, so I find this a suitable low-cost alternative.
Investment Recommendation
FDRR is designed for a rising rate environment, but I have mixed feelings on whether rates will continue to increase at an accelerated pace over the short- and medium-term. Some economic signals suggest inflation has already peaked and that the cure for higher prices has indeed been higher prices. Others, like the latest Michigan 5-Year Inflation Expectations reading of 5%, indicate more work needs to be done in the form of higher rates. Given this uncertainty, I would recommend FDRR over the more aggressive EQRR.
Still, I think DGRO, VYM, or some combination of the two is better than buying FDRR. I feel more confident about their potential in case interest rates decline, and investors will still get many of the same features FDRR offers, including:
- a diversified portfolio (67-70% assets in top 20 industries)
- low volatility (0.85-0.90 five-year beta)
- solid forward sales and earnings per share growth (9% and 13-14%)
- similar net dividend yield (2-3%)
- reasonable valuation (16-19x forward earnings)
Plus, DGRO and VYM are low-cost ETFs with longer track records. That’s the path I’d recommend readers take right now. I don’t think you necessarily need some novel, higher-fee strategy to profit from higher interest rates. Look at the fundamentals an ETF offers, and given the sheer volume of funds on the market today, I’m confident you’ll be able to find a lower-cost alternative.
Be the first to comment