

Brandon Bell
Introduction
Exxon Mobil Corporation (NYSE:XOM) announced its earnings for the fourth quarter and full-year 2022 on January 31, 2022.
Note: This article is an update of my article published on October 31, 2022. I have followed XOM quarterly on Seeking Alpha since January 2017.
1 – 4Q22 and Full-year 2022 results snapshot
Exxon Mobil posted adjusted quarterly earnings of $3.40 per share, beating analysts’ expectations, compared to $2.05 per share last year.
Total revenues of $95.43 billion also beat expectations. They were up significantly from the year-earlier figure of $84.97 billion.
The solid earnings were due to higher realized commodity prices, albeit down significantly from 3Q22, oil-equivalent production of 3,822K Boep/d, and robust refining margins. The company said in the press release:
Refining throughput for the year was 4 million barrels per day, up 171,000 barrels from 2021 on a current refinery circuit basis, reflecting best-ever annual refining throughput in North America and the highest globally since 2012.
This quarter, Exxon Mobil announced that in 2023-2024, it would be repurchasing a cumulative of up to $35 billion of shares.
Finally, XOM declared a fourth-quarter dividend of $0.91 per share, an increase of $0.03 per share. The company repurchased approximately $15 billion in shares in FY22, consistent with the company’s plan to repurchase up to $30 billion of shares through 2023.
CEO Darren Woods said in the conference call:
our results clearly benefited from a favorable market but, to take full advantage of the undersupplied market, our work began years ago, well before the pandemic when we chose to invest counter-cyclically. We leaned in when others leaned out, bucking conventional wisdom. We continued with these investments through the pandemic and into today.
FY22 Highlights:
XOM 2022 Highlights (XOM Presentation)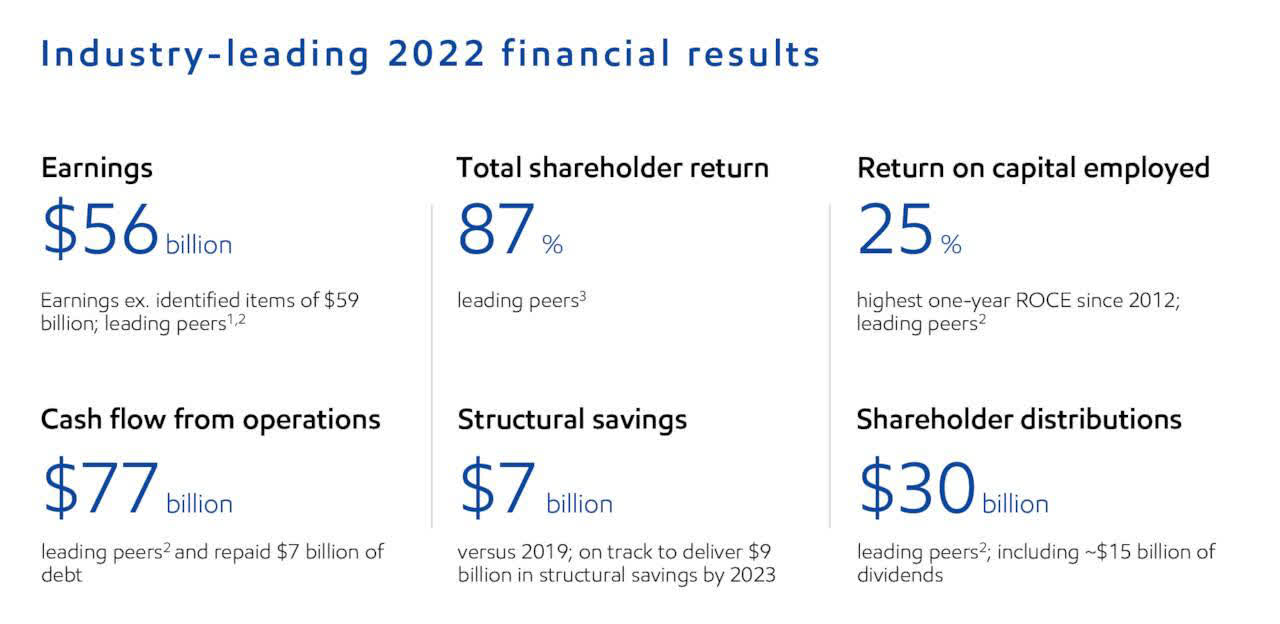
Below is shown the EPS since 1Q18.
XOM Quarterly EPS diluted history (Fun Trading)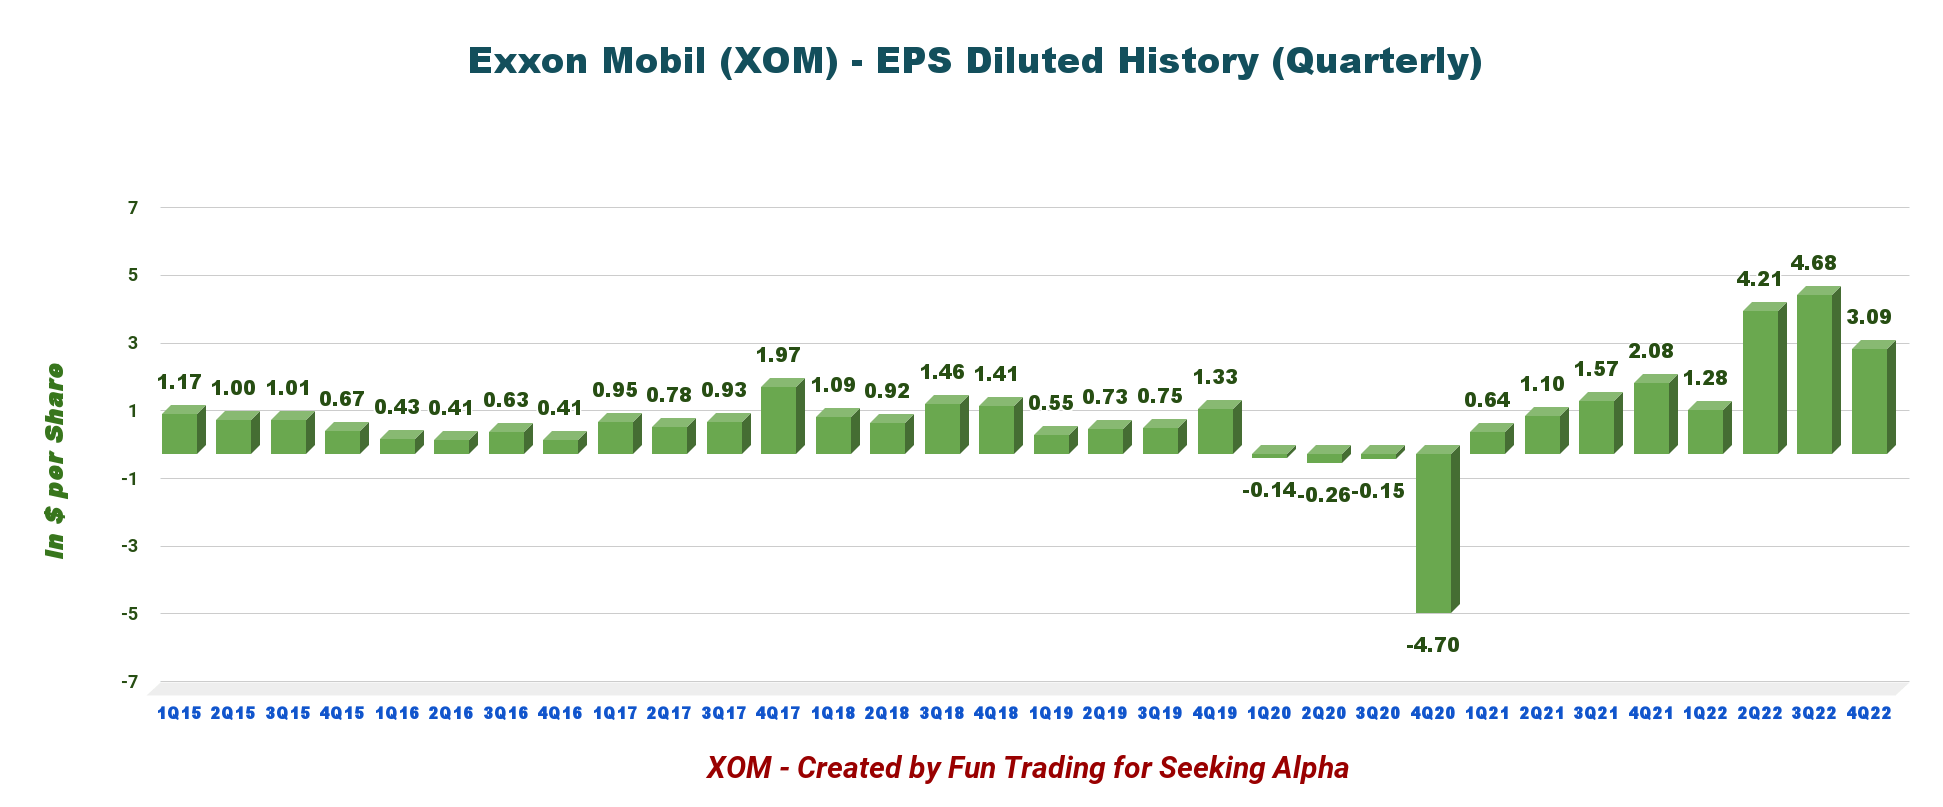
2 – Investment Thesis
Exxon Mobil is one of my favorite oil supermajors. I have owned it for many years and have no intention of selling my long position anytime soon. I like Exxon Mobil because it is the leading oil stock, and management focuses on delivering the best for shareholders.
Guyana is a significant catalyst on the growth side, but the Permian may have reached its limits. Undoubtedly, 2022 was an exceptional year for the oil and gas industry, with prices reaching multi-year records in June 2022.
However, 2023 will be a different story, with more volatility and uncertainty. Honestly, I do not see how XOM could maintain its frothy valuation in 2023. I believe a healthy retracement is in the cards, depending on the world economy and geopolitical turmoil.
We should expect more modest results due to oil and gas prices falling back to earth, even if China’s demand may help for a while longer. As shown in the chart below:
XOM Brent and NG prices 1-Year chart (Fun Trading StockCharts)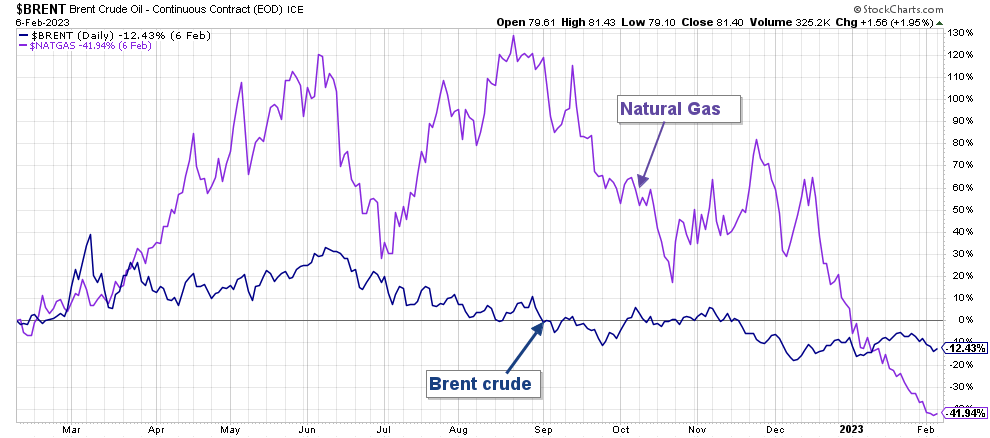
Note: XOM produces natural gas representing 35.6% of the total input indicated in the Upstream segment. Furthermore, Brent has been dropping continuously since its peak in June and is now down over 12% yearly.
Thus, the overall strategy that I usually promote in my marketplace, “The Gold and Oil Corner,” is to keep a medium core long-term position and use about 50%-60% to trade LIFO while holding your long-term position and collecting a steady dividend of 3.20%.
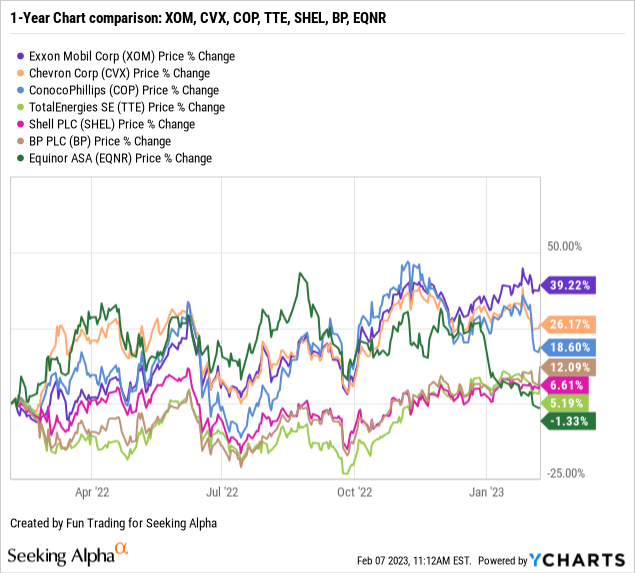
3 – Stock performance
XOM is up 39% on a one-year basis. The company is largely outperforming its peers.
4 – Upstream production
Oil and gas production in the third quarter was 3,822K Boep/d. The U.S. oil price composite was $82.14 this quarter.
Below is the company’s production per region between liquids (including NGL) and natural gas in 4Q22. The U.S. segment represents 31% of the total input.
XOM 4Q22 Production oil and NG per region (Fun Trading)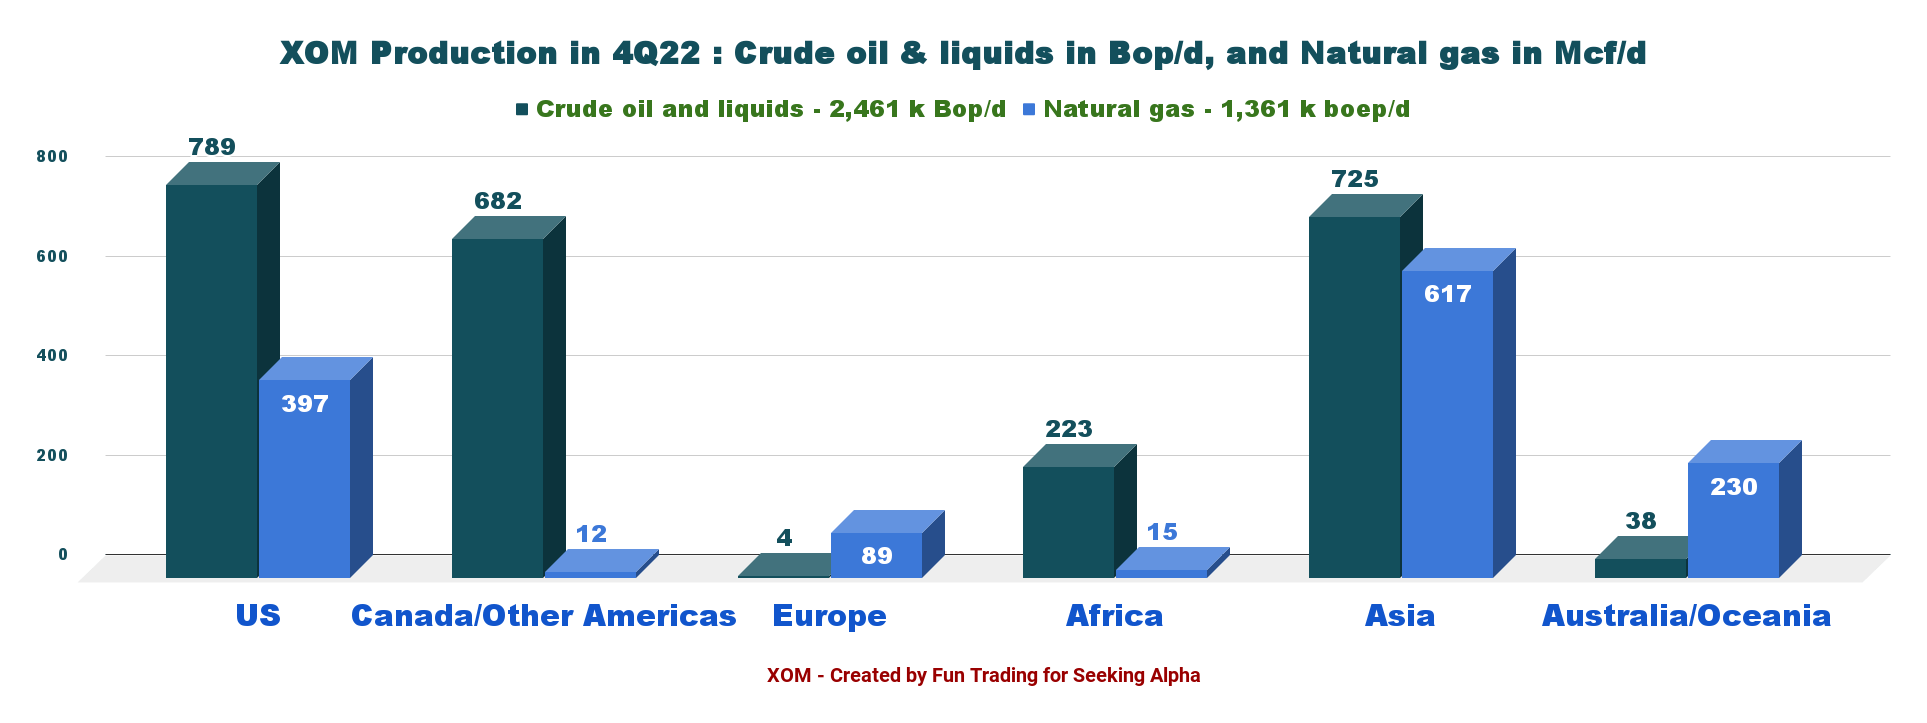
Exxon Mobil – Historical Financial Table ending 4Q22 and Upstream Production: The Raw Numbers
| Exxon Mobil | 4Q21 | 1Q22 | 2Q22 | 3Q22 | 4Q22 |
| Total Revenues and other Income in $ Billion | 84.97 | 90.50 | 115.68 | 112.07 | 95.43 |
| Net Income in $ Billion | 8.87 | 5.48 | 17.85 | 19.66 | 12.75 |
| EBITDA $ Billion | 17.61 | 17.63 | 29.58 | 31.27 | 24.11 |
| EPS diluted in $/share | 2.08 | 1.28 | 4.21 | 4.68 | 3.09 |
| Cash from operating activities in $ Billion | 17.12 | 14.79 | 19.96 | 24.43 | 17.62 |
| Capital Expenditures in $ Billion | 4.09 | 3.91 | 3.84 | 4.88 | 5.78 |
| Free Cash Flow in $ Billion | 13.04 | 10.88 | 16.13 | 19.55 | 11.84 |
| Total Cash $ Billion | 6.80 | 11.07 | 18.86 | 30.41 | 29.64 |
| Total Debt in $ Billion | 47.7 | 47.5 | 46.88 | 45.43 | 41.19 |
| Dividend per share in $ | 0.88 | 0.88 | 0.88 | 0.91 | 0.91 |
| Shares outstanding (diluted) in Billion | 4.275 | 4.266 | 4.276 | 4.185 | 1.138 |
| Oil Production | 4Q21 | 1Q22 | 2Q22 | 3Q22 | 4Q22 |
| Oil Eq Income Production in K Boepd | 3,816 | 3,675 | 3,732 | 3,716 | 3,822 |
| US Production in K Boepd | 1,222 | 1,216 | 1,227 | 1,175 | 1,186 |
| Permian Production in K Boepd | 460 | 640 | 550 | 560 | 600 |
| US Quarterly average Brent Eq. ($/b) | 73.62 | 93.51 | 107.78 | 91.69 | 82.14 |
| US Quarterly average NG ($/Kcf) | 4.96 | 4.80 | 6.49 | 8.38 | 6.62 |
Sources: Company filing and Fun Trading analysis.
Analysis: Revenues, Earnings Details, Free Cash Flow, and Upstream Cash Flow
1 – Quarterly revenues and other income were $95.43 billion in 4Q22
XOM Quarterly Revenues history (Fun Trading)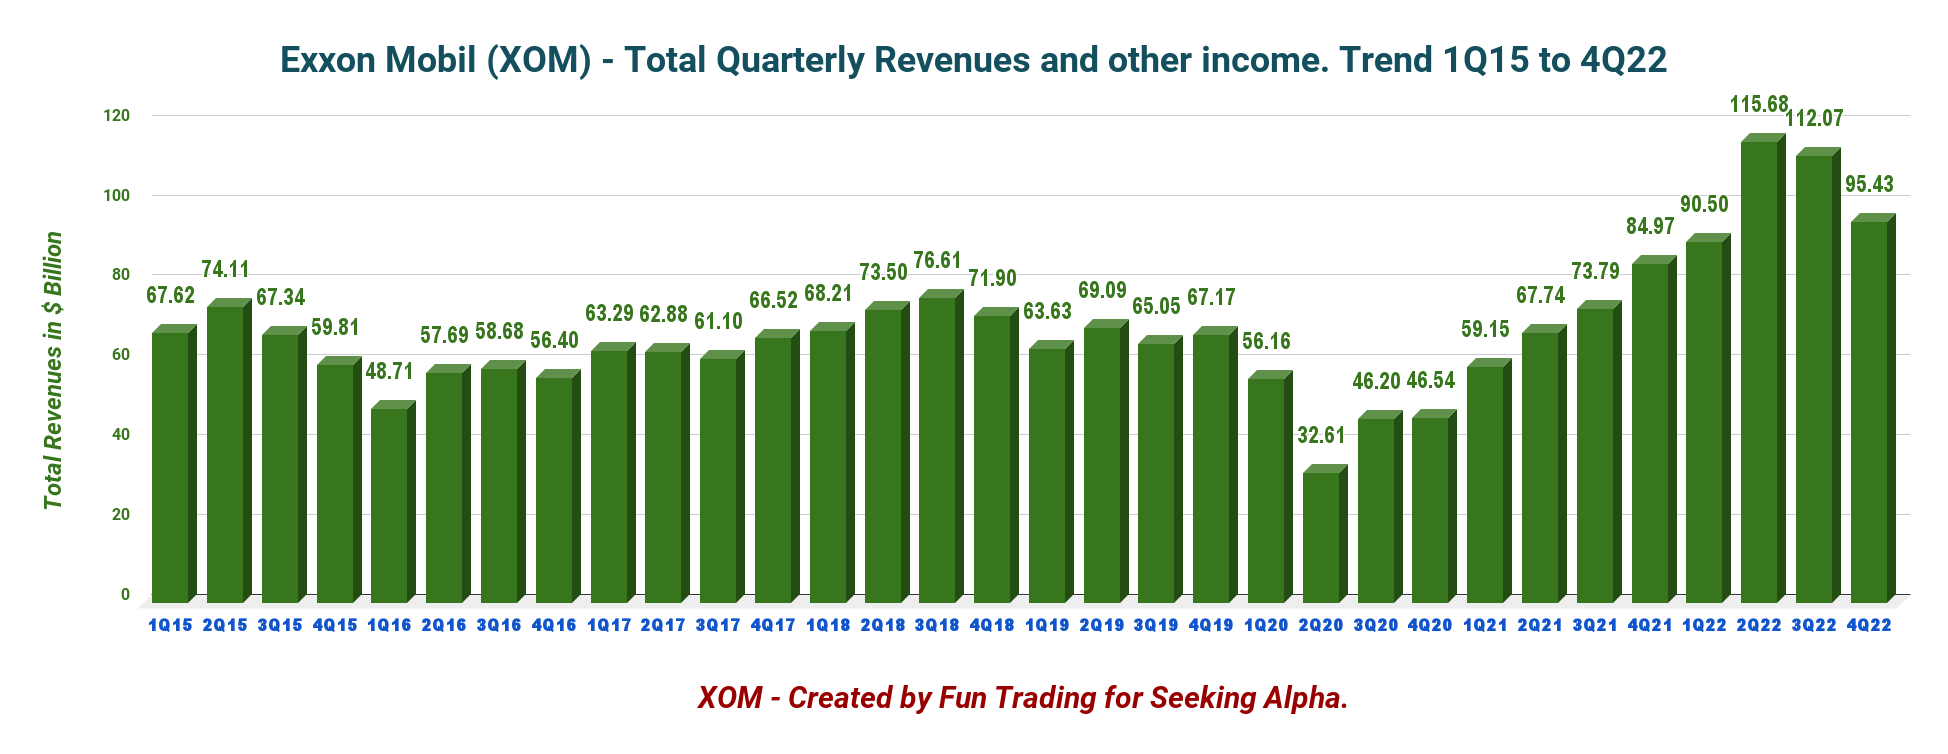
Revenues and other incomes came in at $95.429 billion in the fourth quarter of 2022, with $12.75 billion in net income. Earnings decreased mainly from lower prices, with crude and gas realizations down 15% and 13%, respectively, on higher global inventories.
The improvement was driven by a 46% increase in natural gas realizations and an increase of nearly 10% in crude realizations. Results benefited from $1.4 billion positive unsettled derivatives mark-to-market effects, which more than offset the impact of year-end inventory impacts and higher expenses.
1.1 – Earnings details in 4Q22
XOM Earnings detail per segment (Fun Trading)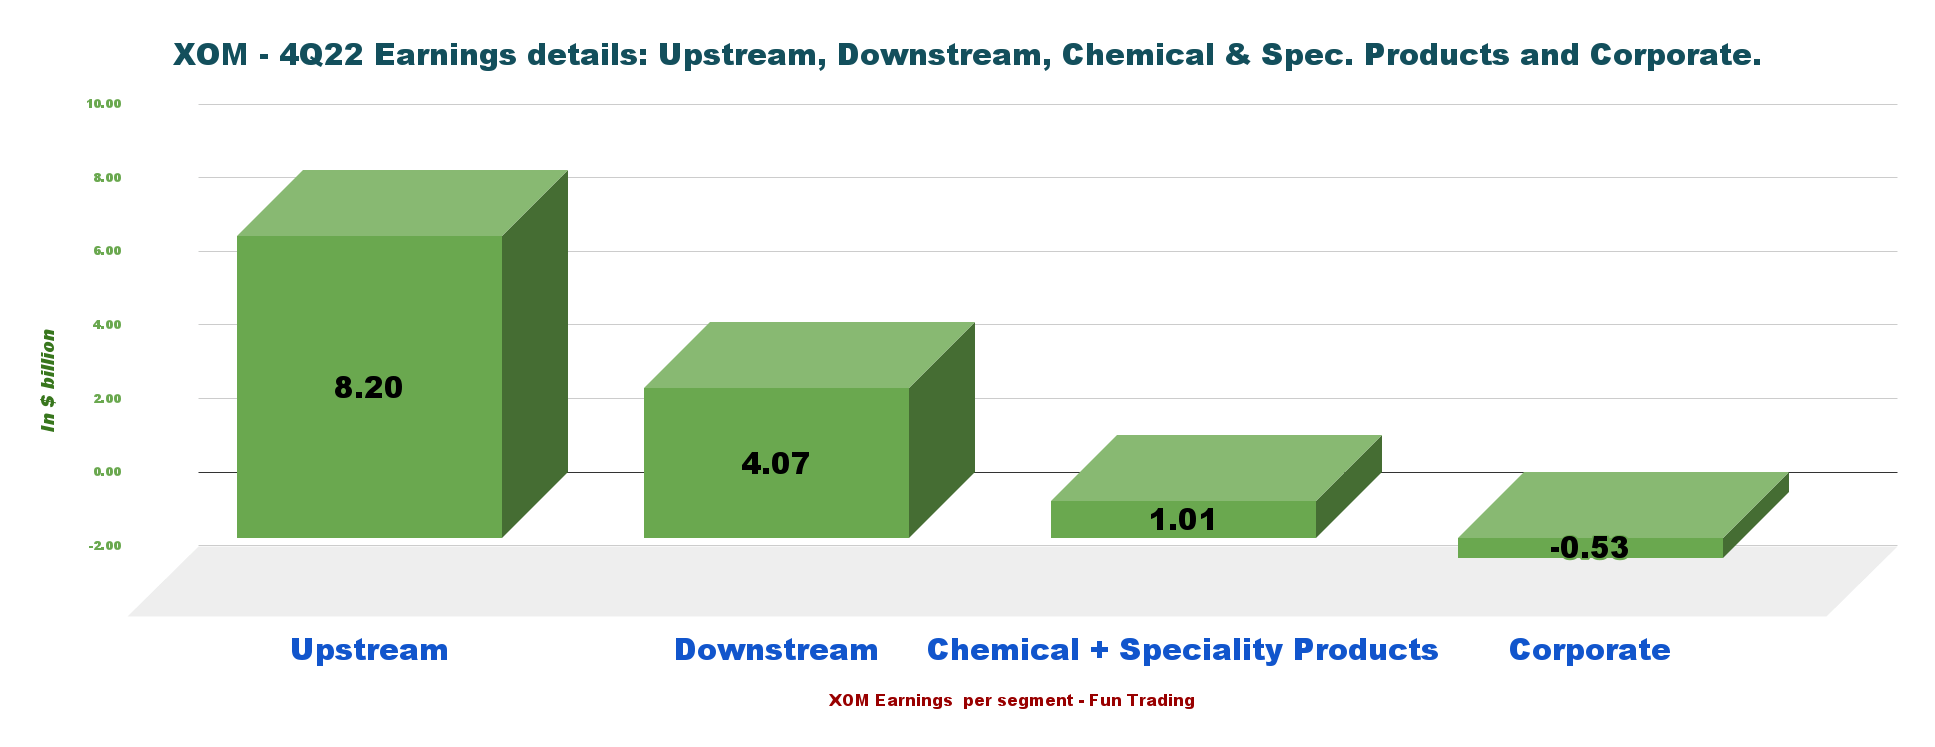
The fourth quarter was another excellent quarter. However, the company’s gas prices were retreating from their historical high, and oil prices were still above $90 per barrel. This situation will change in 1Q23, especially with gas prices decreasing to the low $2’s.
1.2 – XOM oil and gas prices history:
XOM Quarterly Crude and NG price history (Fun Trading)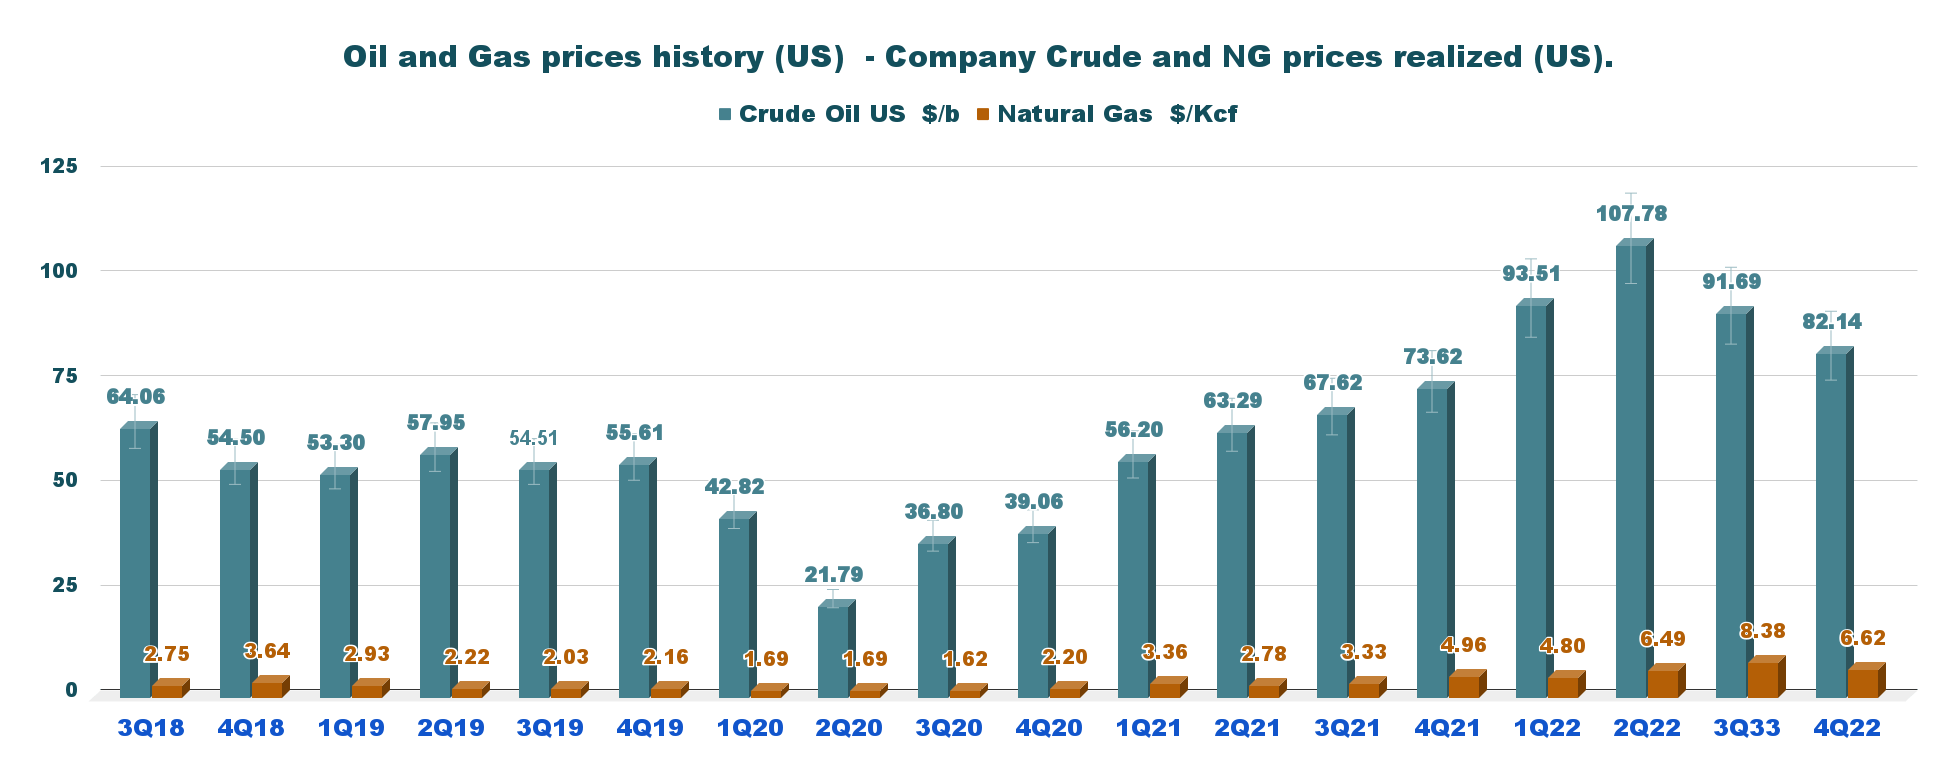
2 – Free Cash Flow (not including divestitures). The company posted $11.84 billion in 4Q22
XOM Quarterly Free cash flow history (Fun Trading ) Note: Generic free cash flow is cash from operating activities minus CapEx.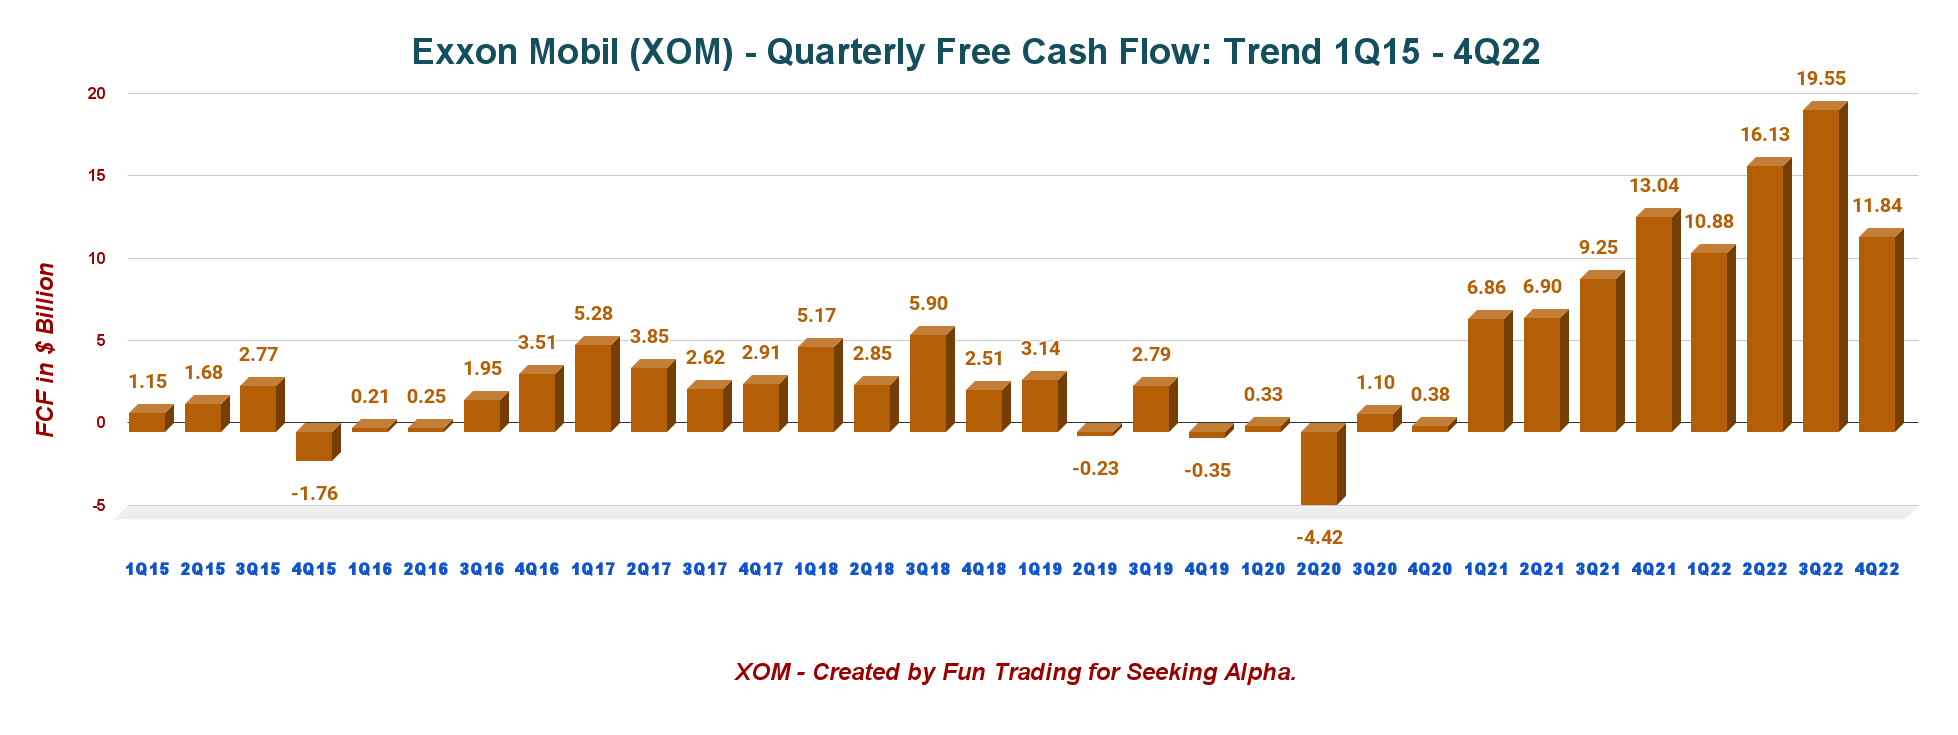
CapEx was at a record in 4Q22, reaching $5.78 billion, and cash from operating activities was $17.62 billion, up from $17.12 billion in 4Q21.
The fourth quarter’s free cash flow was $11.84 billion. The trailing 12-month FCF is $58.39 billion (not including divestitures). This high-level free cash flow in 2022 helped XOM to repurchase $15 billion worth of shares in 2022 and pay a great quarterly dividend now at $0.91 per share. CEO Darren Woods said in the conference call:
Additionally, we increased our share repurchase program twice during the year. In total, we returned $30 billion to shareholders in 2022, including about $15 billion in dividends, which also led peers. These actions reflect the confidence we have in our strategy, the performance we’ve seen across our businesses, and the strength of our company’s future.
3 – Oil production in K Boep/d
3.1 – Upstream segment
XOM Quarterly Oil equivalent Production history (Fun Trading)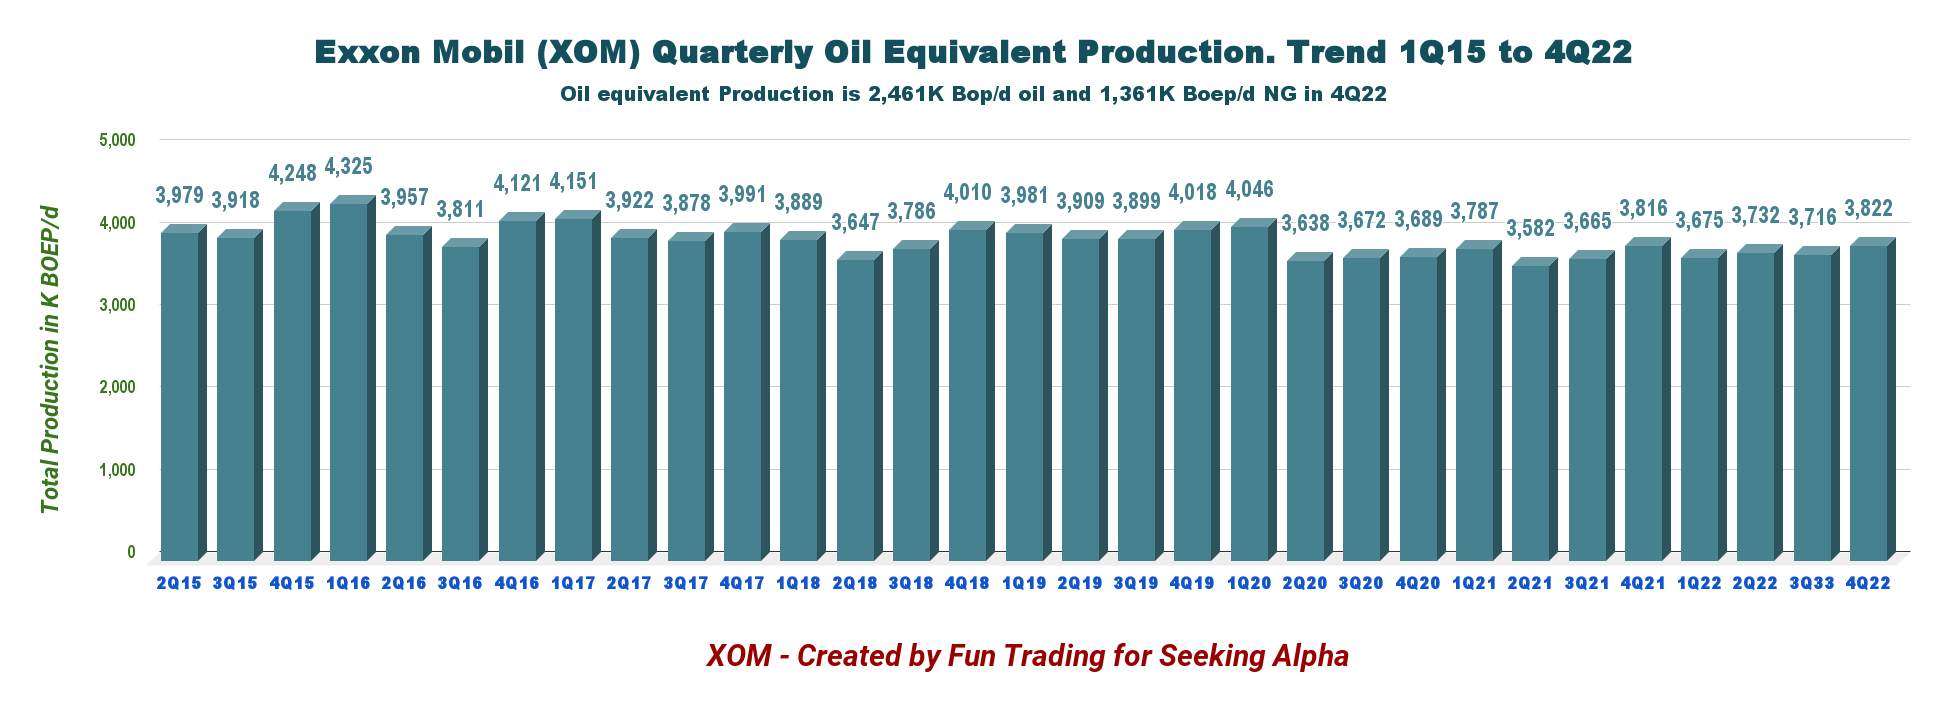
Combining oil and gas production, Exxon Mobil produced 3,822K Boep/d in 4Q22, unchanged yearly and up 2.9% sequentially (please see graph history above). The Permian delivered record production in the quarter of nearly 560K Boep/d, unchanged from 3Q22.
The Permian delivered record production in the quarter of more than 560,000 oil-equivalent barrels per day and the company also loaded the first LNG cargo from the Coral South LNG development in Mozambique.
Liquids represented 2,461K Boep/d or 64.4% of the total output. Total U.S. production represented 31% of the total output in 4Q22.
XOM Quarterly US Production history (Fun Trading)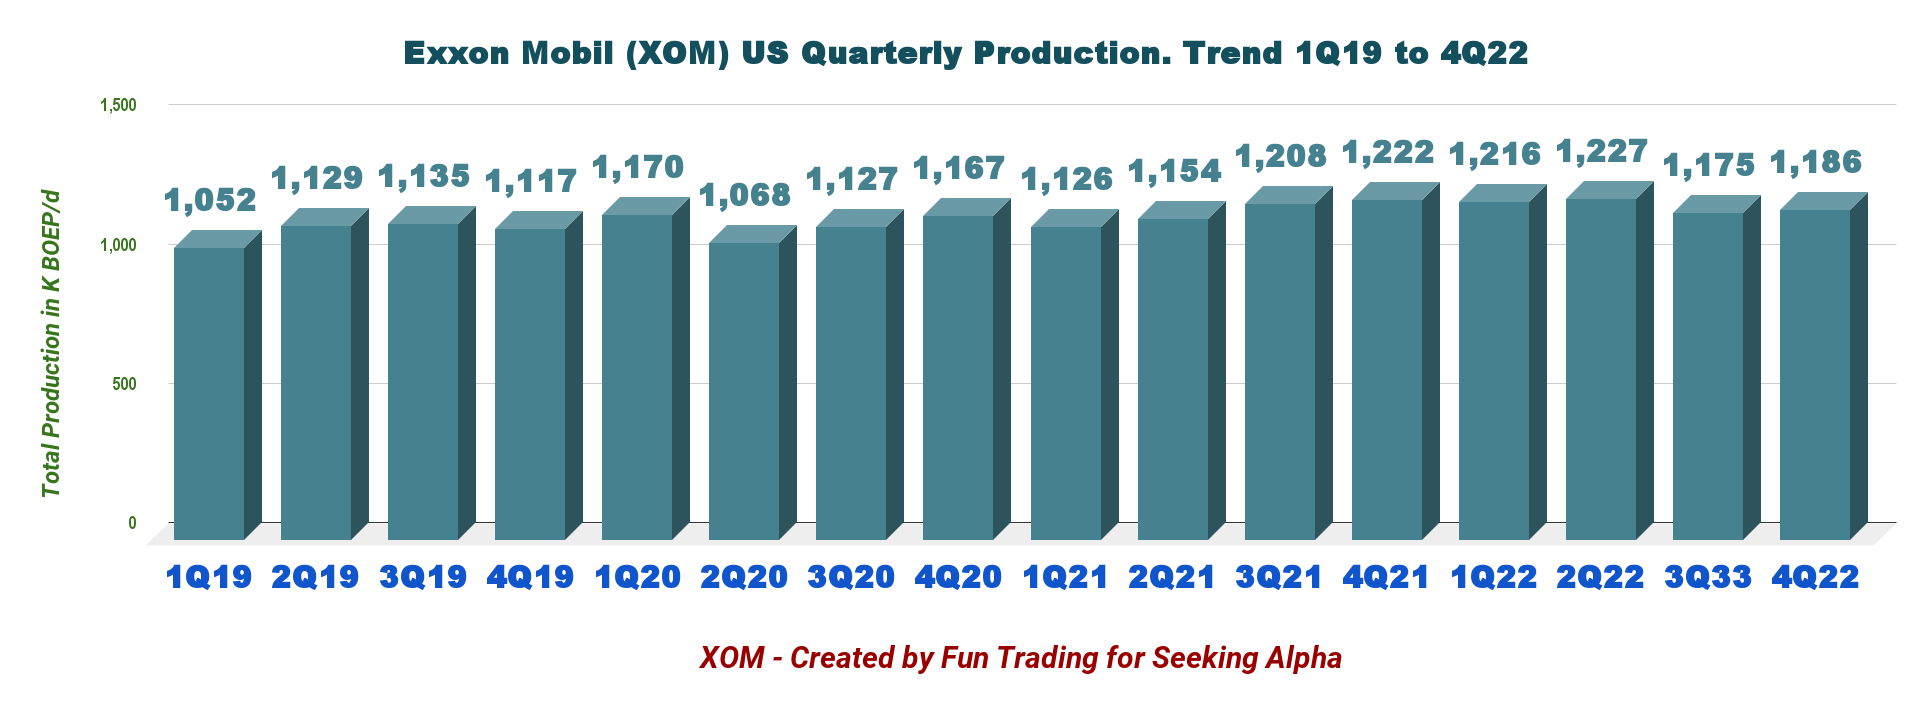
3.2 – Details of production for the USA:
XOM Quarterly US production details (Fun Trading)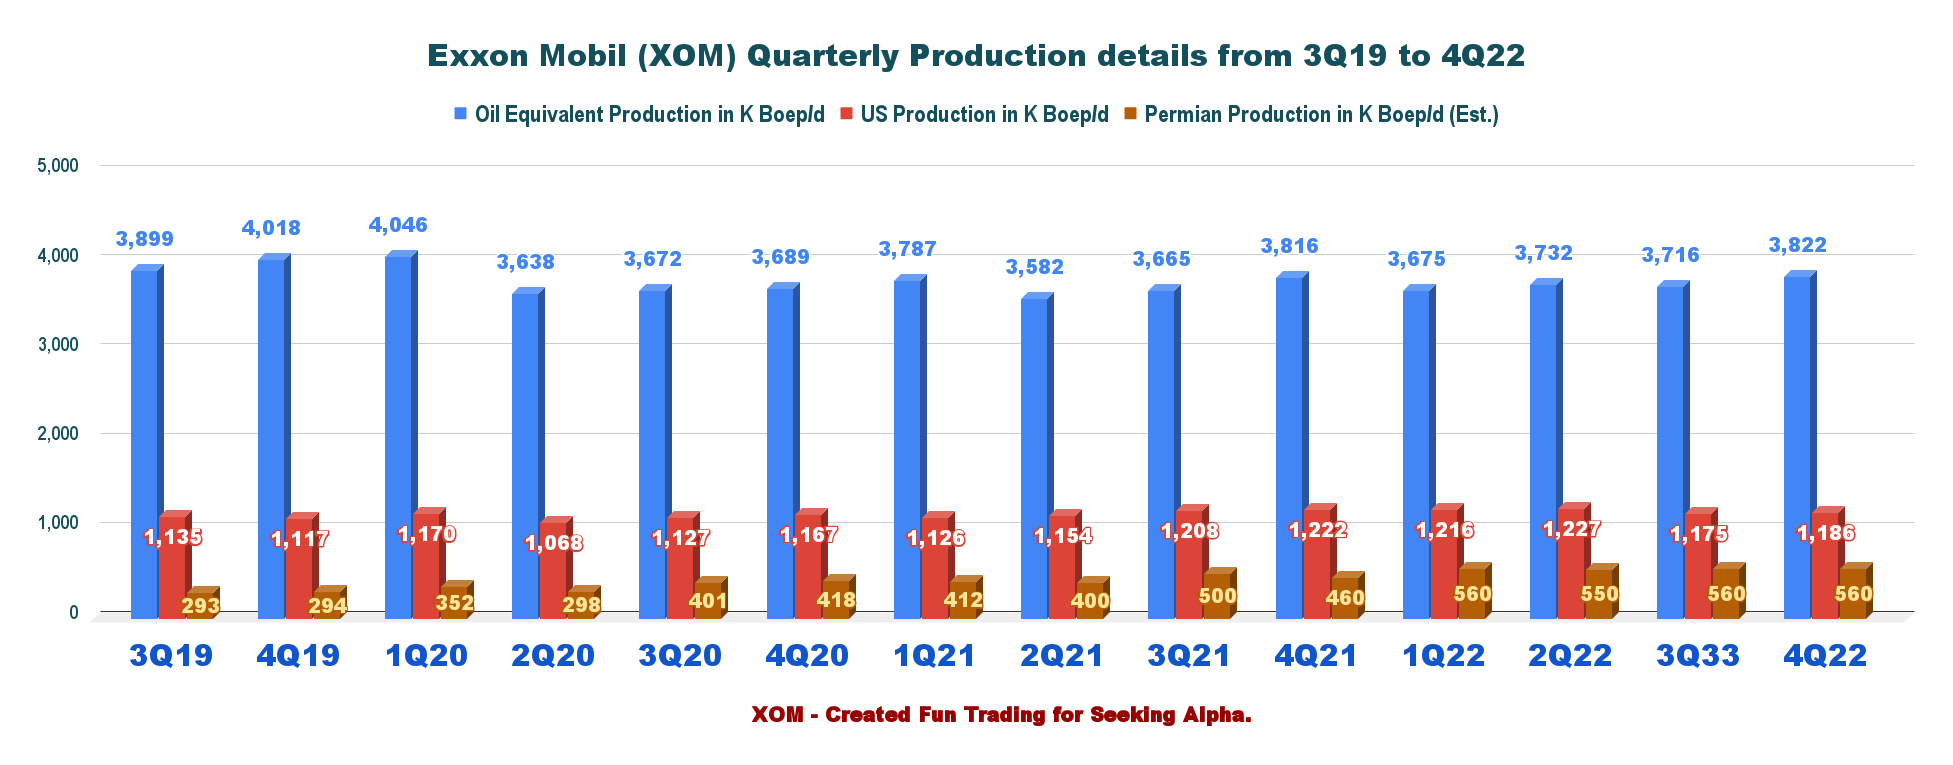
The Permian production has reached a plateau at around 560k Boep/d. Guyana is doing well, with production growing about 70K Boep/d, with Liza Phase 2 starting up ahead of schedule and Liza Phase 1 and 2 producing above the investment basis.
3.4 – Energy, chemical, and Specialty Products segments
The segment recorded a profit (excluding identified items) of $4,754 million, up from $901 million a year ago due to strong industry refining margins.
The segment recorded an $800 million profit (excluding identified items), up from earnings of $482 million last year, primarily due to higher margins.
Exxon Mobil posted $762 million in profit, down from $839 million in the year-ago quarter, primarily due to the higher feed cost environment.
4 – Net Debt is down to $11.55 billion in 4Q22
XOM Quarterly Cash versus Debt history (Fun Trading)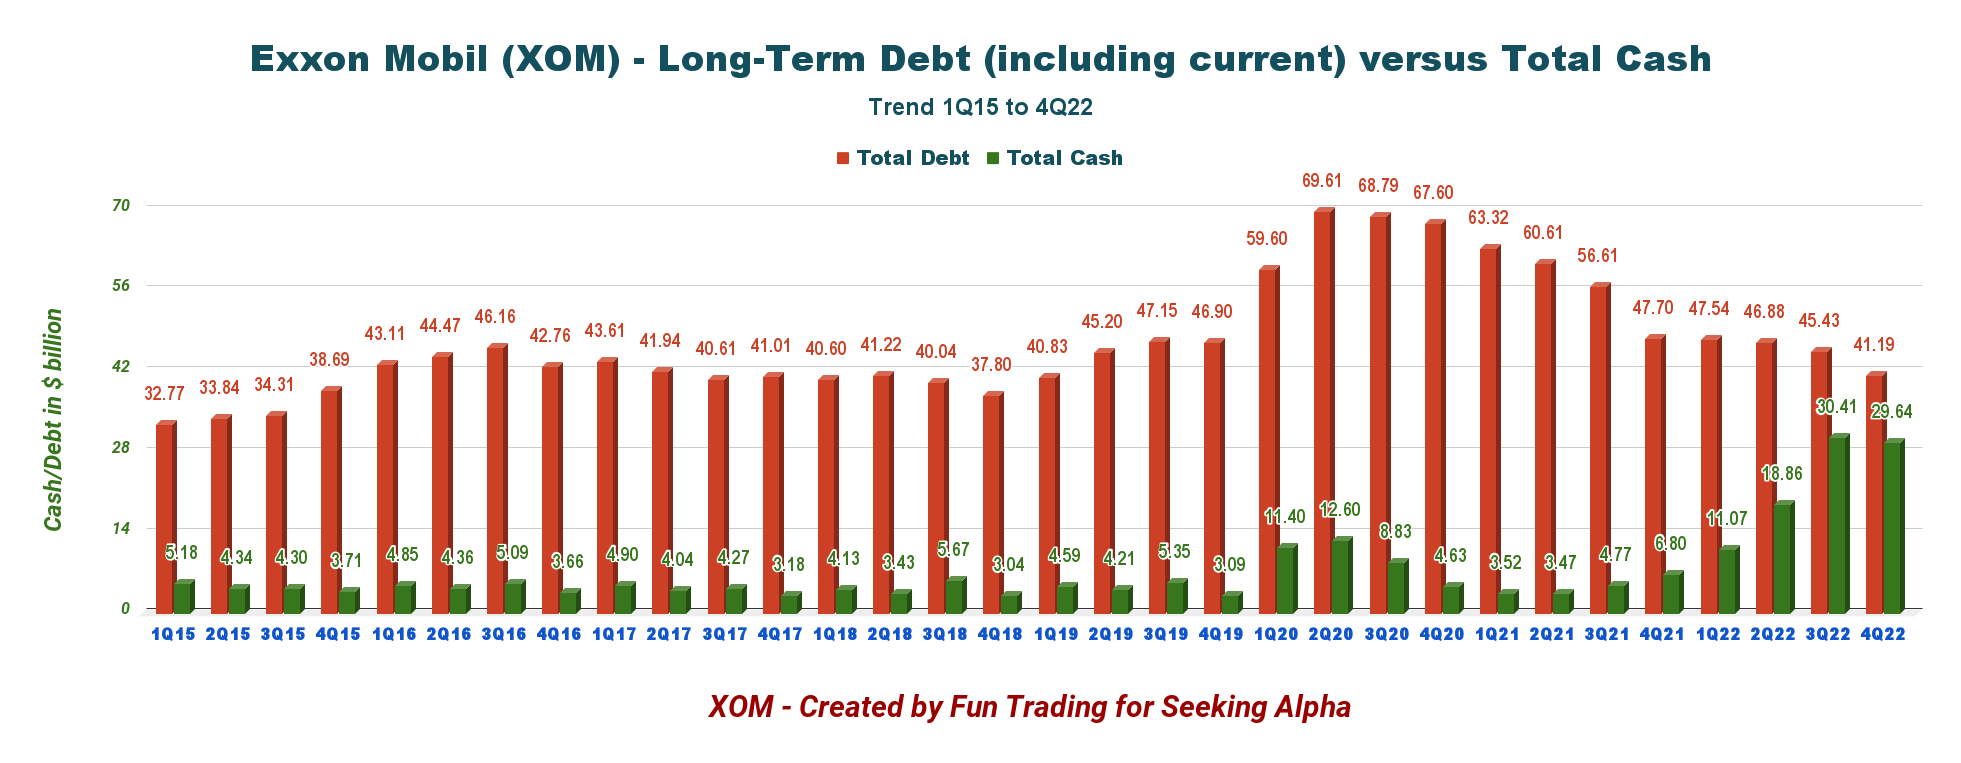
Exxon Mobil’s net debt is now $11.55 billion, with a Debt to EBITDA ratio of 0.1x. (Source: Fun Trading)
XOM Quarterly Debt to Ebitda ratio history (Fun Trading)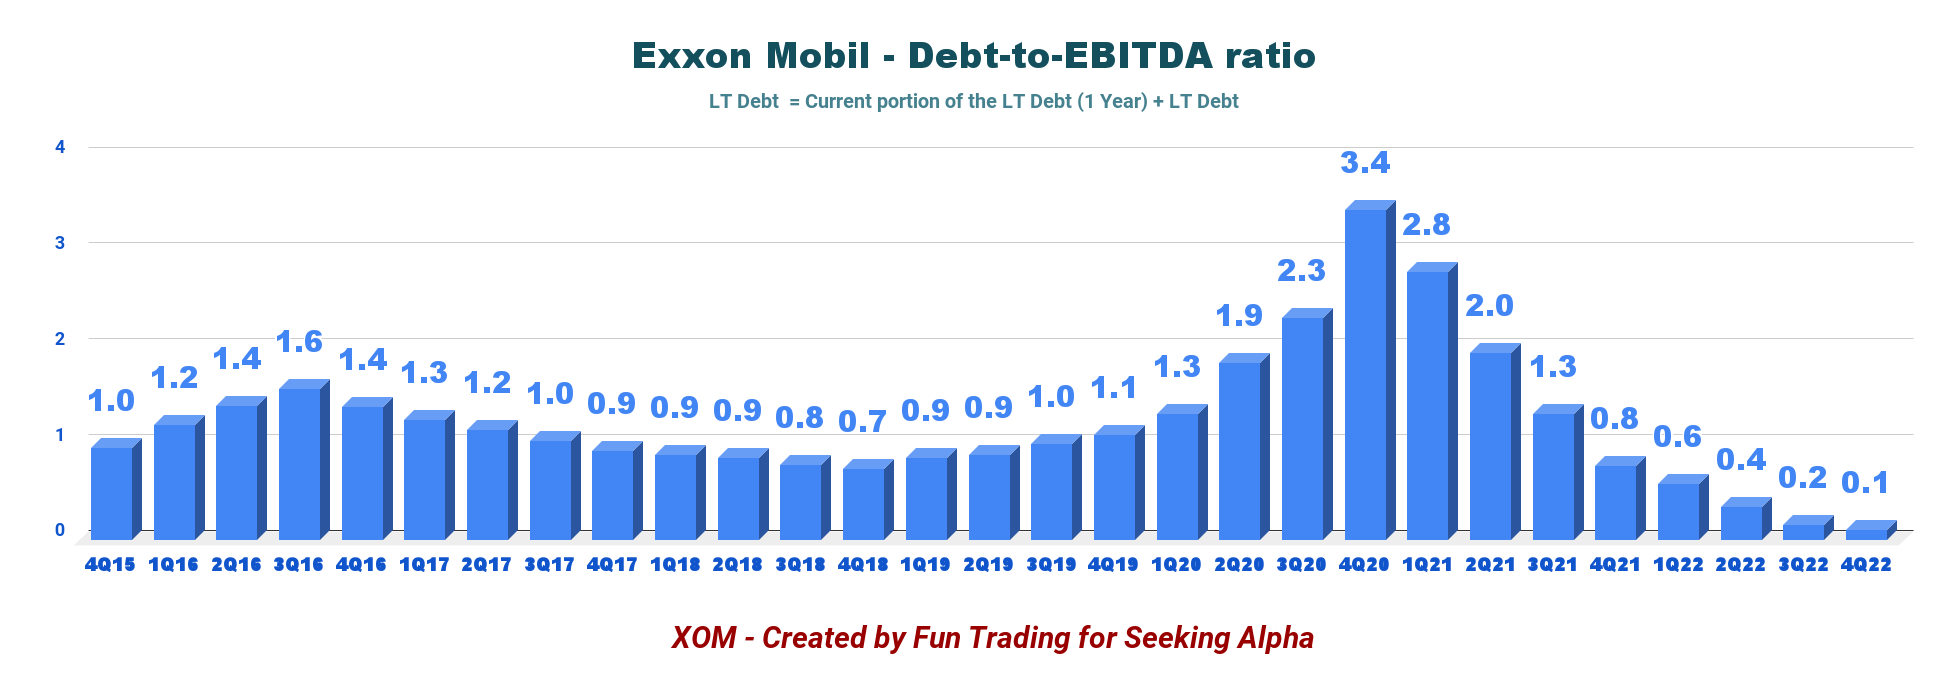
Exxon Mobil’s debt situation has improved significantly, as shown in my chart above
5 – Company’s 1Q23 outlook
The company expects production in 1Q23 comparable to what has been produced in 4Q22.
XOM: 1Q23 Outlook (XOM Presentation)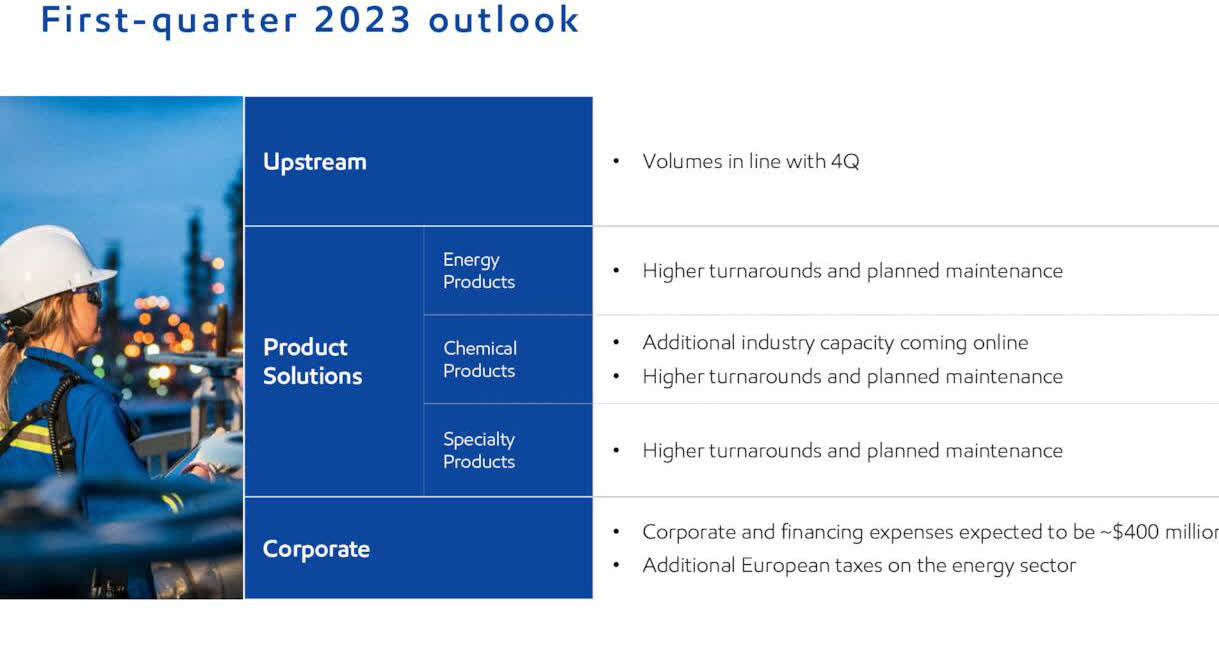
Technical Analysis and Commentary
XOM TA Chart short-term (Fun Trading StockCharts) Note: The chart is adjusted for dividends.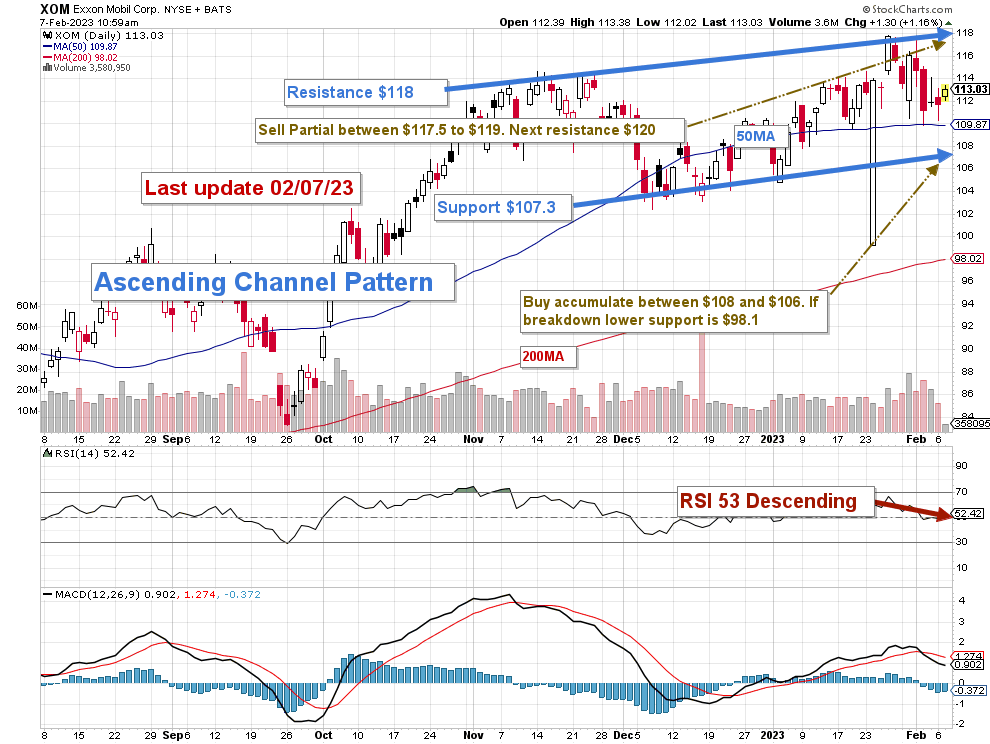
XOM forms an ascending channel pattern with resistance at $118 and support at $107.3.
Ascending channel patterns or rising channels are short-term bullish in that a stock moves higher within an ascending channel, but these patterns often form within longer-term downtrends as continuation patterns. The ascending channel pattern is often followed by lower prices, but only after a downside penetration of the lower trend line. The stock will continue channeling upward until it is able to break either the upper or lower trend line. – The Stock Bandit.
The short-term trading strategy is to take profits between $117.5 and $119 with possible higher resistance at $120 and accumulate between $106 and $108 with possible lower support at $98.1.
I recommend short-term trading LIFO for about 50-60% of your total position and keeping a core long-term holding for a much higher target.
Warning: The TA chart must be updated frequently to be relevant. It is what I am doing in my stock tracker. The chart above has a possible validity of about a week. Remember, the TA chart is a tool only to help you adopt the right strategy. It is not a way to foresee the future. No one and nothing can.
Author’s note: If you find value in this article and would like to encourage such continued efforts, please click the “Like” button below to vote of support. Thanks.
Be the first to comment