

Andrii Dodonov
(This article was co-produced with Hoya Capital Real Estate)
Introduction
The Inflation Reduction Act, if enacted, will mean the “rich” will owe more in Federal income taxes, thus the greater interest in sheltering some income from Uncle Sam. The bigger, more popular Municipal Bond funds are covered by numerous Seeking Alpha Contributors on a regular basis. While reviewing some Municipal Bond funds myself, I came across a set that had not been covered in years on Seeking Alpha. I picked the best two performers to cover here. They are the:
While tax avoidance can be part of one’s strategy, seldom is it that placing that goal first pays off in the long run. To that extent, I included data that compares how various bond strategies have done since 2001, along with equities data, too.
Eaton Vance Municipal Income review
Seeking Alpha describes this closed-end fund (“CEF”) as:
The Eaton Vance Municipal Income CEF invests primarily in investment grade municipal obligations of various sectors, such as cogeneration, education, electric utilities, general obligations, healthcare, hospital, housing, transportation, and nursing home. At least 80% of its total assets will be invested in debt obligations. At least 65% of its total assets will be invested in municipal obligations that are rated at least investment grade. Up to 35% of its total assets may be invested in municipal obligations rated below investment grade. Significant investments (initially around 10%) may be made in residual interest municipal bonds known as inverse floaters. Various kinds of financial futures contracts and related options may be purchased and sold to seek to hedge against changes in interest rates. Benchmark: Bloomberg Municipal TR USD. EVN started in 1998.
EVN has $463min assets under management (“AUM”), with a Forward yield of 4.9%. The last reported fee schedule was:
funds.eatonvance.com EVN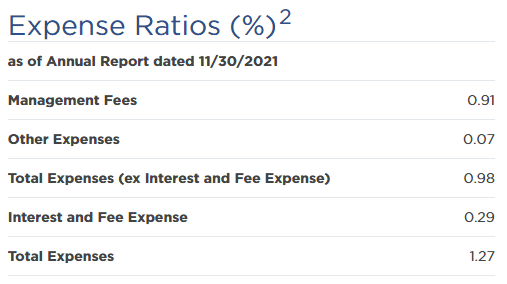
I would suspect that the Interest and Fee Expense amounts could be 10-15bps more now since interest rates have increased since last fall and similar moves have been seen in other leveraged funds.
Eaton Vance provide quarter-end portfolio statistics.
funds.eatonvance.com EVN PDF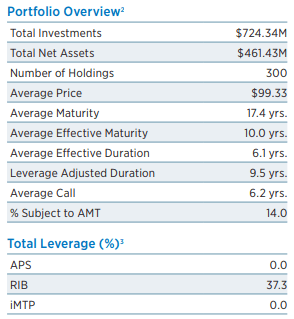
While not short, the duration and maturity levels are less than half of some Municipal Bond funds I have reviewed. Comparison-wise, this should help if interest rates continue to climb. The average bond held is selling for just under Par at the end of June, down from $104.46 at the end of the prior month.
CEFConnect.com EVN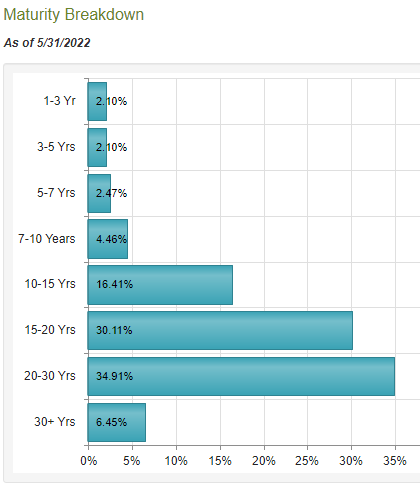
EVN has little opportunity to generate cash via maturities over the next three years, with only 2.1% of the portfolio maturing. Another 19% of the portfolio is subject to being called before 2025, but the chance of that happening decreases as rates rise.
If we are entering a recession, bond ratings take on more importance, though many states are running budget surpluses, which helps protect tax-revenue-backed bonds.
funds.eatonvance.com EVN PDF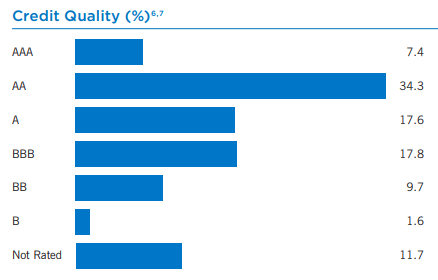
EVN has a high-quality bond portfolio, with over 40% in the upper ratings and only 11% rate below investment-grade. Morningstar gives the portfolio an “A” rating.
EVN has spread its allocation over multiple sectors of the muni bond market.
funds.eatonvance.com EVN PDF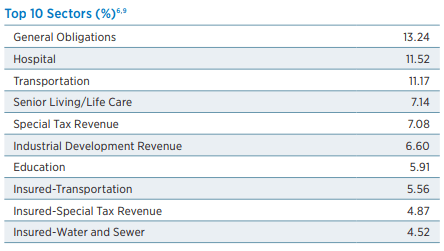
While many sectors are affected directly by economic activity, surprisingly little is tied to tax collections. At least 15% of the portfolio is insured against default risk. No single state is over 10% of the portfolio, which also helps diversify default risk.
CEFConnect.com EVN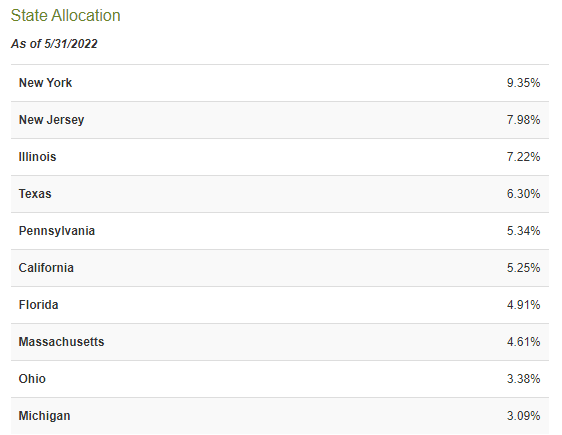
Top holdings
funds.eatonvance.com EVN PDF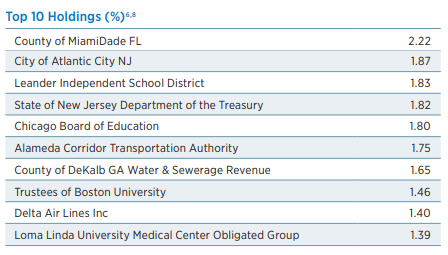
Out of the 300 positions, the Top 10 account for roughly 17%. Since the above data doesn’t include coupon or maturity data, I will include the next chart, even though its data is a month older.
funds.eatonvance.com EVN
While shown on multiple sites, I questioned the 8% WAC value, but after seeing the above and some other holdings, I see how that is possible. That calculation usually excludes Zero-coupon bonds.
EVN distribution review
seekingalpha.com EVN DVDs
As rates dropped, so did the payout from EVN, though it has stabilized since 2018. The 6/30/22 UNII report shows EVN not earning its payout and having the lowest coverage of the four National Muni CEFs managed by Eaton Vance.
Eaton Vance UNII report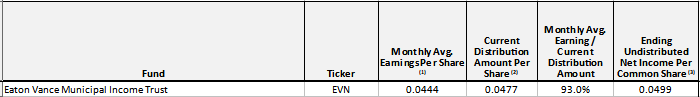
Also, despite its focus, 8.56% of the 2021 distributions were subject to Federal income taxes; 10.82% to the AMT. I saw no 19-a notices that would indicate some of the payouts were from ROC sources.
Price and NAV review
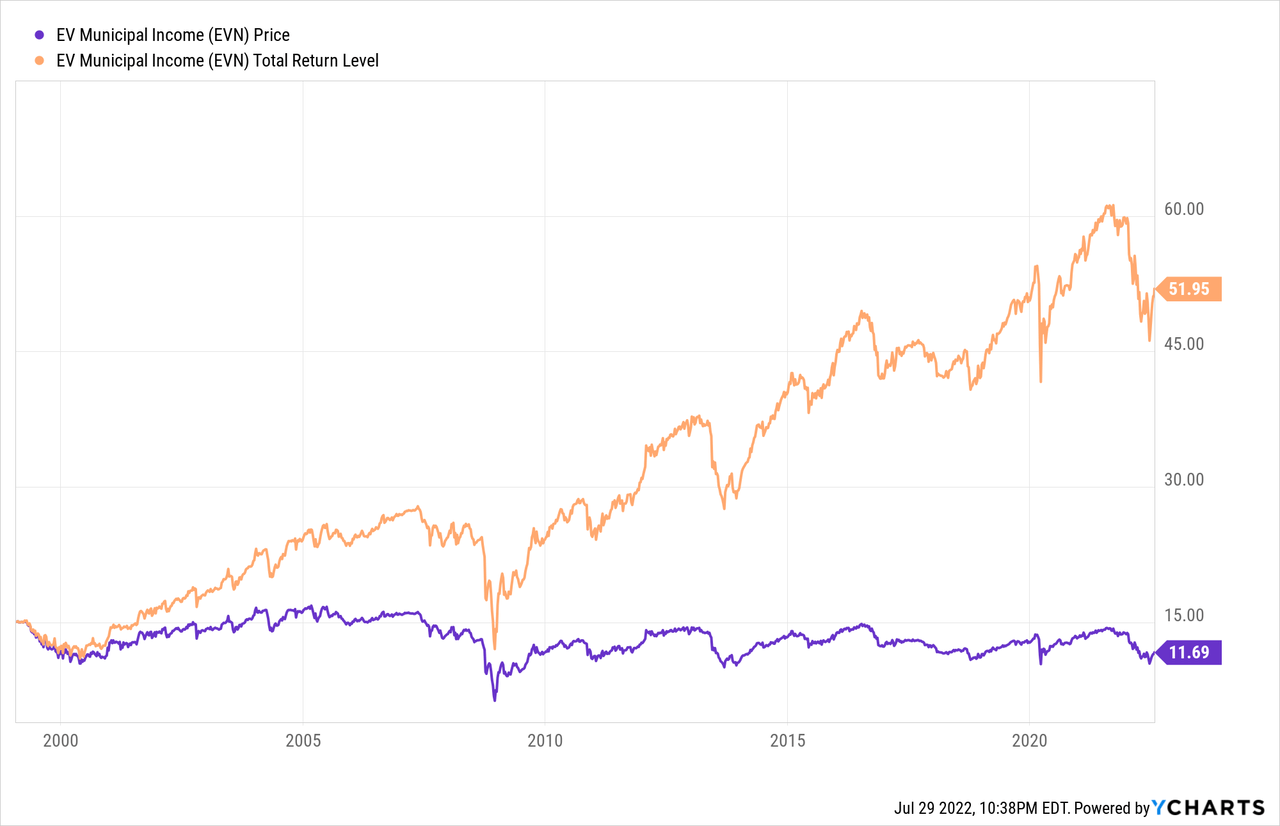
EVN’s price is down 22% since inception while the CEF has provided a 5.37% CAGR. For those who pocketed the payouts, the CAGR was just 3.16%. Since 2016, EVN has been available at a discount almost exclusively, with the current level at 3.31%. Investors in mid-June had the opportunity to “buy in” at a 9% discount, which shrink as the price rallied more than the NAV climbed.
CEFConnect.com EVN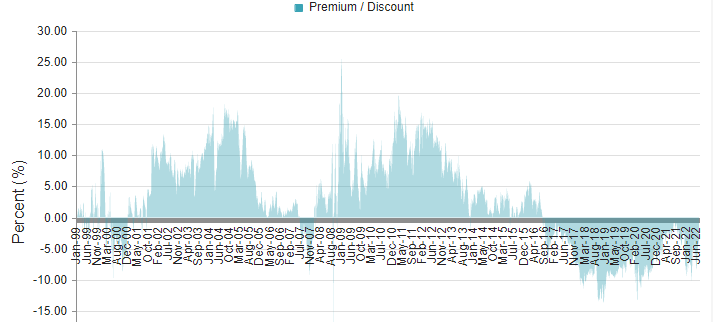
BlackRock Municipal Income Quality review
Seeking Alpha describes this CEF as:
The BlackRock Municipal Income Quality CEF primarily invests in investment grade municipal bonds exempt from federal income taxes, including the alternative minimum tax. Up to 20% of the assets may be invested in bonds rated below Aaa or AAA (but not lower than BBB or Baa). It may invest up to 10% of its assets in other investment companies that invest primarily in municipal bonds of the types in which the Trust may invest directly or in tax-exempt preferred shares that pay dividends exempt from regular Federal income tax. The Trust may enter into interest rate swaps, caps and floors, Futures contracts and Options on Futures contracts for risk management purposes. BYM started in 2002 and doesn’t use a benchmark.
BYM has $350m in AUM and provides a Forward yield of 5.25%, 35bps higher than EVN. The last reported fee schedule was:
blackrock.com BYM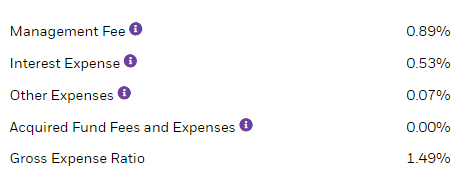
BlackRock provided some basic data about BYM’s portfolio.
blackrock.com BYM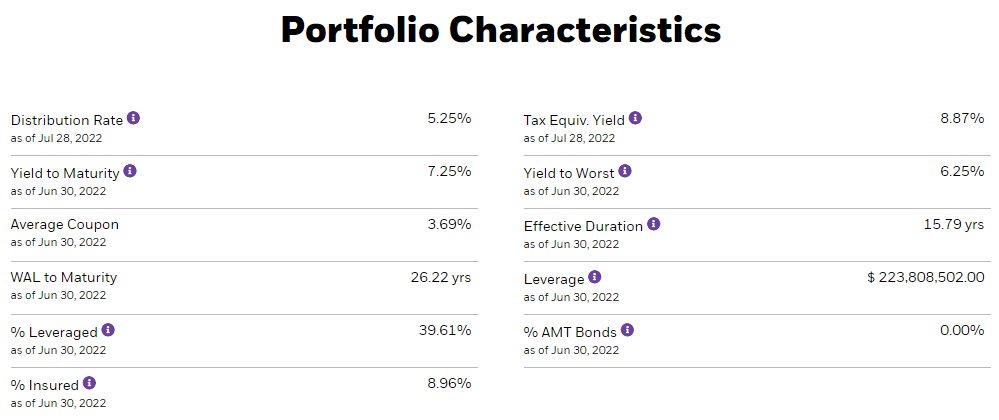
Here, the WAC is more in line with what I expected for a Municipal bond CEF, 3.69%. That said, the YTM is over 7%, implying the average bond price is below Par. BYM gives investors a true choice from EVN in terms of both duration (15.79 vs 6.1) and maturity (26.22 vs 10).
blackrock.com BYM
The longer average maturity is partially revealed in that BYM has almost 85% of its holdings with 15+ years left versus about 75% for EVN. Just under 20% can be called before 2025.
BYM, as one might expect based on its name, has a higher-rated portfolio according to Morningstar, with an “A+” overall rating.
blackrock.com BYM
BYM has almost 50% in the top 2 ratings, compared to only 40% for EVN. The sub-investment-grade bonds comprise half the weight of those held by EVN.
blackrock.com BYM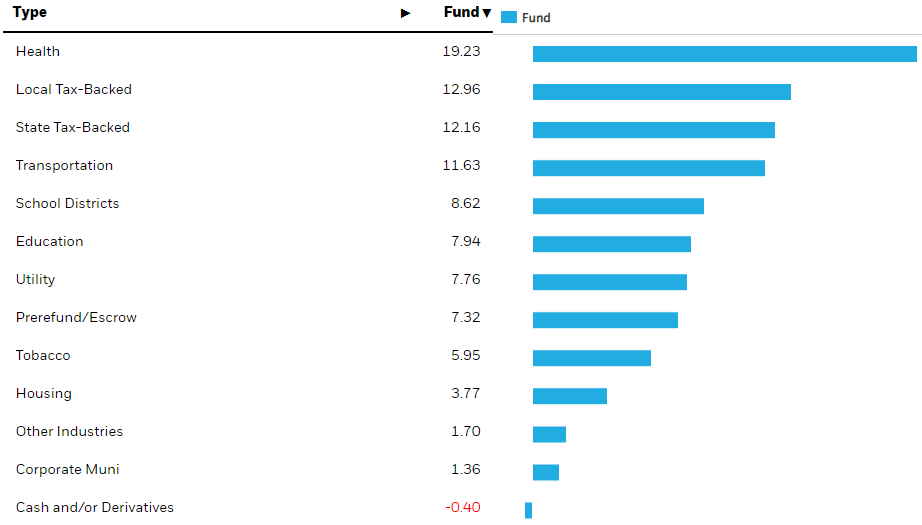
BYM has 25% of its portfolio dependent on either state or local tax revenue, a higher percent than EVN. About 9% of the bonds are insured against default risk. The state allocations are as follows:
blackrock.com BYM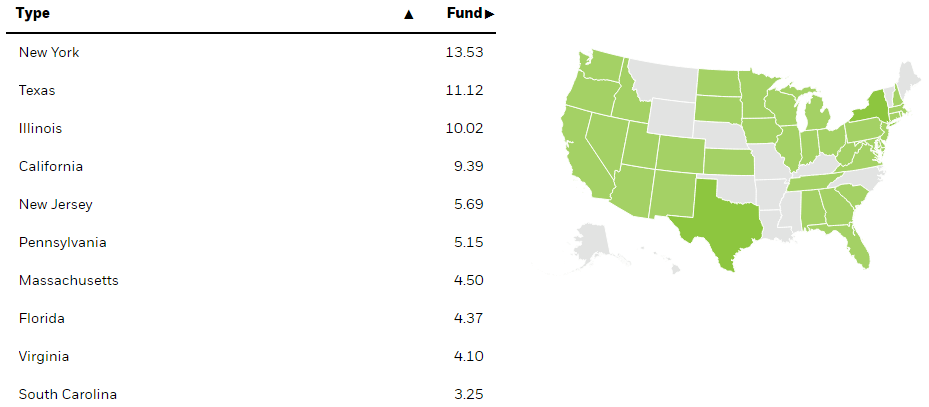
Unlike EVN, BYM has three states with over a 10% exposure. Overall, 36 states are represented.
Top holdings
blackrock.com BYM
About 17% of the portfolio is in the Top 10; overall BYM holds 300 bonds. I had to go back to 3/31/22 to find a holdings list that included both coupons and maturity dates.
morningstar.com BYM
Notice the top holding is no longer in the Top 10 after apparently initiating the position during the first quarter.
BYM distribution review
seekingalpha.com BYM DVDs
BYM also had to reduce its payouts as interests fell but the boost in late 2020 puts the current level to just under the ones in 2018. The UNII report shows BYM earning 92% of the payout over the prior quarter. Unlike EVN, no income is subject to the AMT process.
BYM price and NAV review
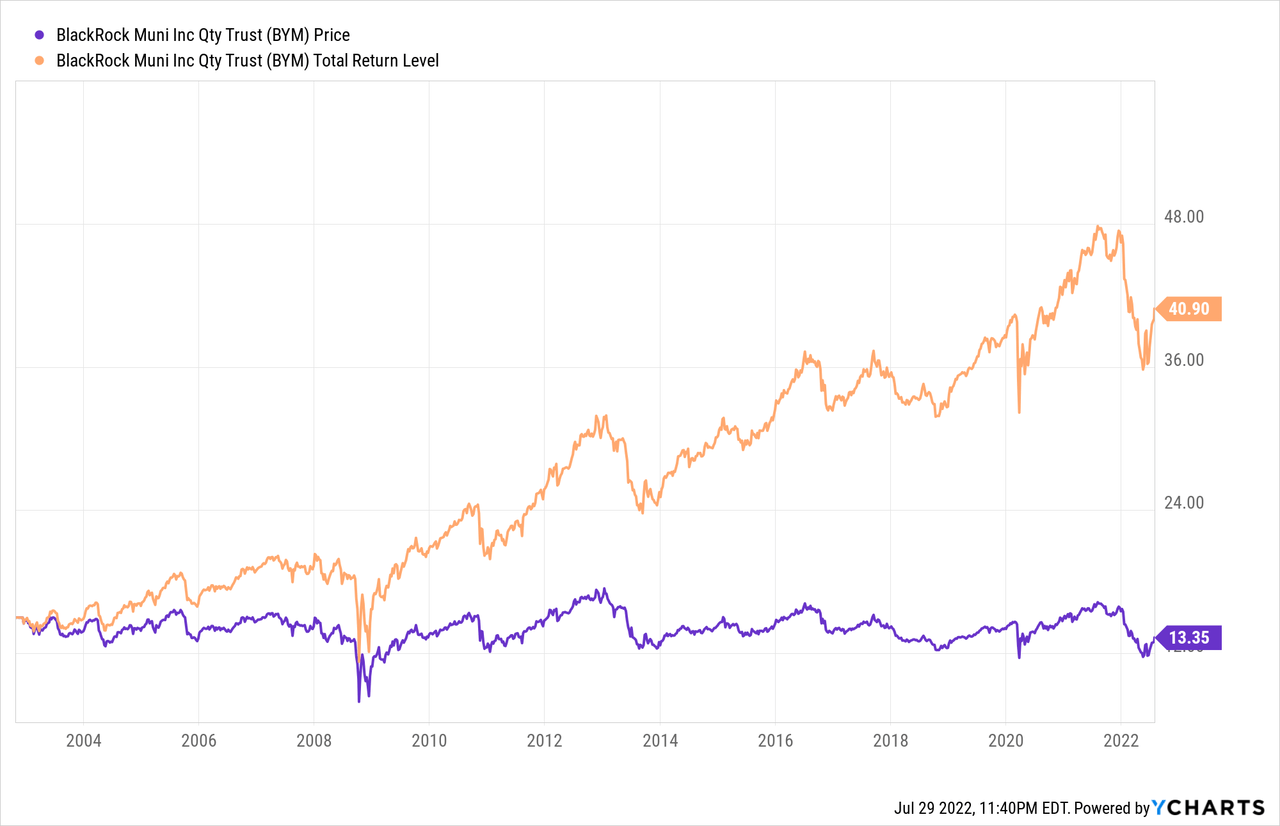
BYM’s price is down 11% since inception, with the CEF providing a 5.2% CAGR for re-investors; 3.4% for those who took the payouts.
CEFConnect.com BYM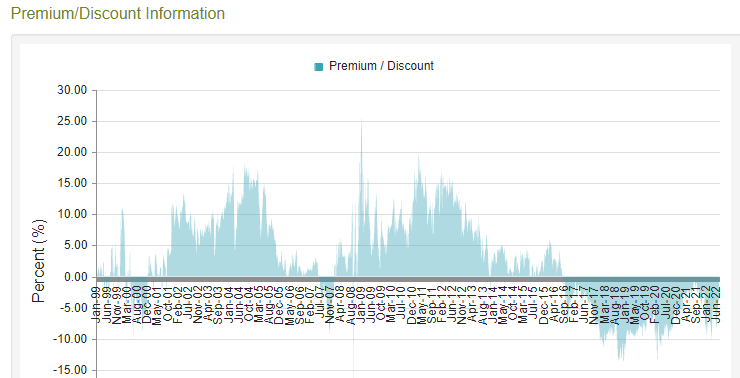
While it’s been five years, unlike EVN, BYM had a history of selling at a premium, topping 15% several times. Currently, BYM is at a 3.31% discount, down from over 8% in mid-June. Like EVN, the shrinkage was due to the price climbing faster than the NAV did.
Portfolio strategy
One popular closed-end funds site lists 74 funds that focus on all or part of the Municipal bond market. Another 40 invest in one of 12 individual states. Seeking Alpha’s exchange-traded fund (“ETF”) screener option lists 66 such funds so investors can get funds without leverage too. To see how our two lightly uncovered funds compare to some popular CEFs, I added these funds to this part.
- Nuveen Quality Municipal Income Fund (NAD) for its quality focus.
- Pioneer Municipal High Income Trust (MHI) for its large discount.
PortfolioVisualizer.com
This is what I take from the above results.
- Except for MHI, since 2003 the other three funds have stayed in sync most of the time. BYM recently moved into the lead in CAGR.
- While EVN has the highest StdDev, it and MHI had best year, worse year, and max drawdowns wider than the other two funds.
- For BYM and NAD, their Sharpe ratios are superior to the other two. For the Sortino ratio, only MHI lags behind the others.
PortfolioVisualizer.com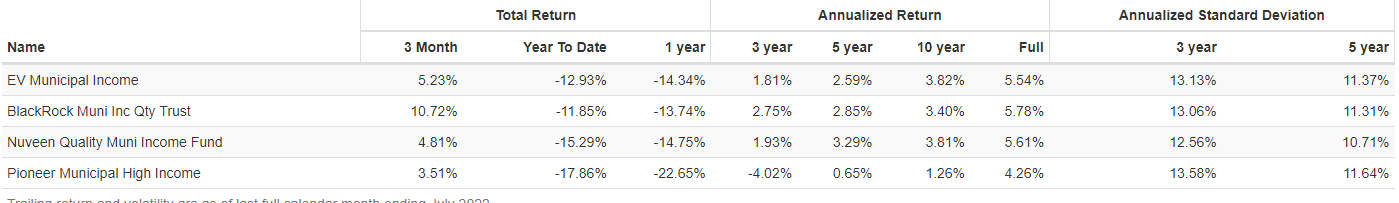
Time frames matter and when you examine StdDev data over the last 3- and 5-year periods, the differences are much less than since 2003. It also reveals that BYM is the best performer over the last three months and MHI has been a disaster for investors over the past year and places 4th over the last 3 months.
Bonds & inflation
Not a good combination, since the standard remedy to fight inflation is rising interest rates. Since bond prices are inversely related to rates, the level being influenced by its duration/maturity, that is where the harm comes in. The next chart shows the connection between changes in the CPI and 10-yr annualized real returns for municipal bonds.
alliancebernstein.com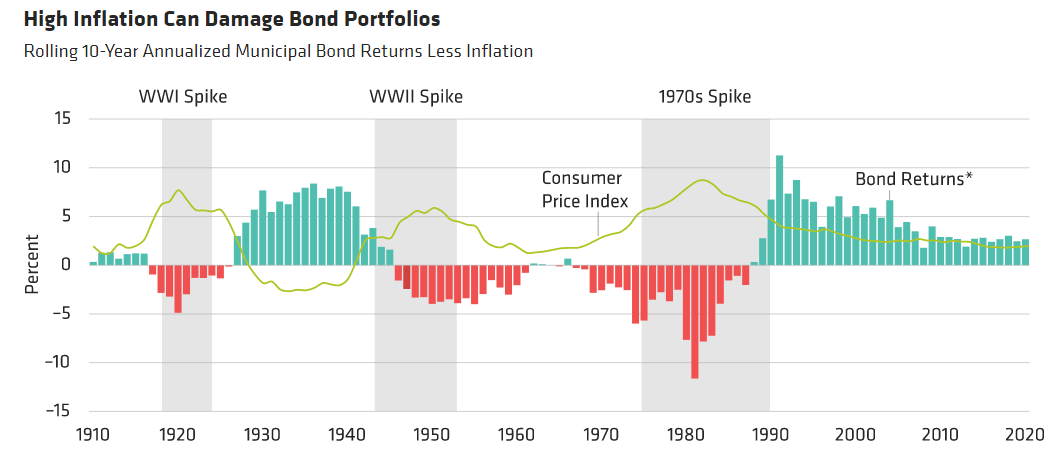
To get an idea which bonds might do best when inflation is high, I looked to PortfolioVisualizer.com for data, which starts in 2001 when TIPS results were available.
PortfolioVisualizer.com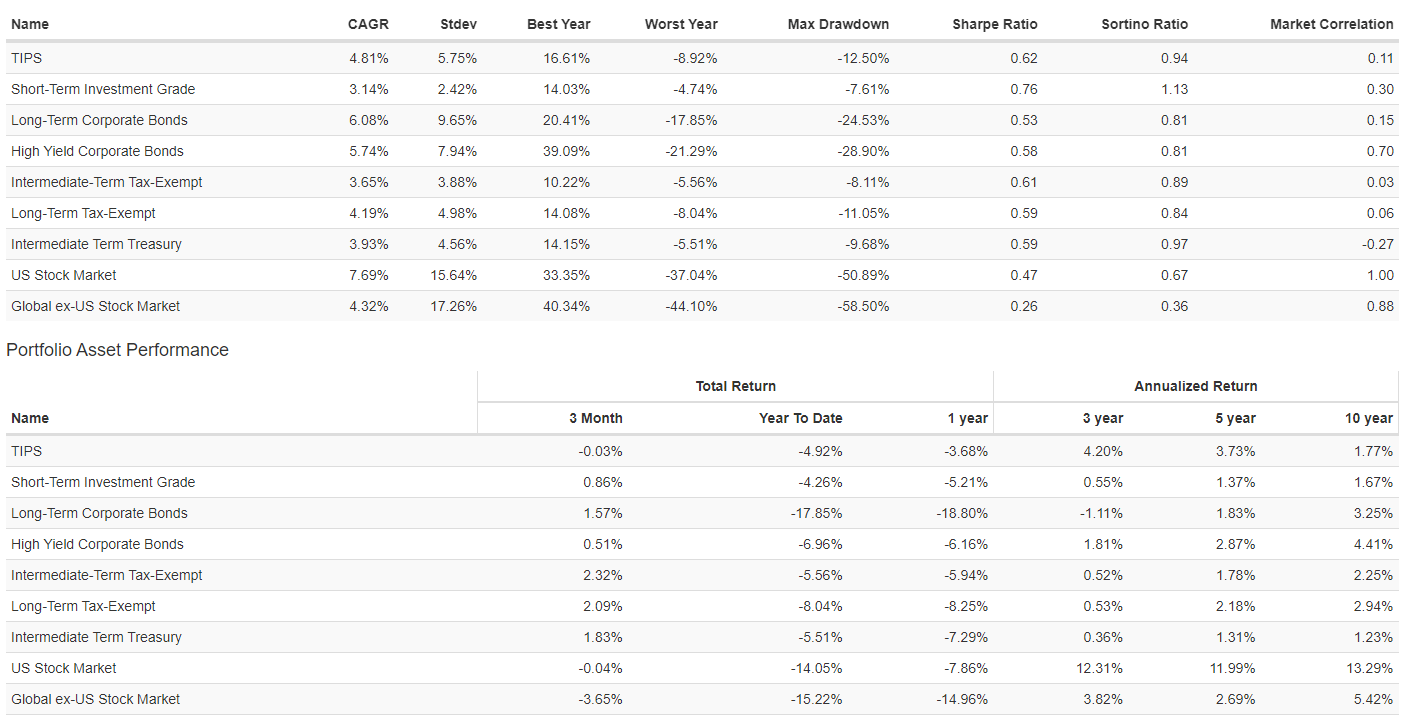
When reviewing the CAGR data, one has to remember the income from taxable bonds and stocks are taxed at different rates and municipals escape the regular Federal income tax system, but could come into play elsewhere. With that caveat, ignoring U.S. stocks, which had the best CAGR but not risk ratios since 2001, corporate bonds placed first (HY) and second (Int term). During this period of falling interest rates, long-term Municipals outperformed Intermediate ones. Overall, Municipals were also behind TIPS and International stocks. UST Intermediates competed well against their tax-exempt cousins. For investors wanting to add less risky fixed income assets, both sets of Municipal bonds placed near the top in best StdDev drawdowns, and risk ratios.
While both Municipal bond funds are in the middle for 1-year CAGRs, they have performed the best over the past three months, even better than TIPS, who, apparently, were hurt more by the rapid increase in rates than benefiting from the rapid jump in inflation.
Status-focused funds available
For those investors who pay high state income taxes, it is worth exploring funds that focus on municipal bonds issued by that state to avoid those income taxes. Nuveen offers, by far, the widest lineup with 11 states offered. iShares offers 4 of those states in ETF format. I recently reviewed two CEFs from each of these states:
Final thought
While as one saying goes, “Don’t let the tax tail wag your investment dog!”, taxes need to be considered, as does the risk level you want to achieve so you can sleep at night. Each type of bond fund presented has their own combination of both. This is where each investor’s own due diligence comes in.
Be the first to comment