

Travel_Motion/iStock via Getty Images
Introduction
The capitalization rates of European residential real estate have been very low in the past few quarters. German residential real estate giant Vonovia (OTCPK:VONOY) got away with using a sub-3% capitalization rate and even Canadian REIT European Residential Real Estate (TSX:ERE.UN:CA) has been using pretty low capitalization rates (currently at 3.38%) for its portfolio of Dutch residential real estate. While the REIT is attractive from an AFFO multiple point of view and dividend yield perspective, I wanted to check how the balance sheet would be impacted by higher capitalization rates and how the AFFO will be impacted by increasing interest rates.
European Residential Real Estate (‘ERE’) is trading on the TSX with ERE.UN or ERE-UN as ticker symbol. The average daily volume is approximately 115,000 shares per day. There are currently 89.6M units outstanding with an additional 142M Class B LP units which can be converted into common shares. For the FFO and AFFO calculation purposes, I’m using a total unit count of 231.6M as the interest on the Class B LP Units is equal to the distribution on the common units.

ERE Investor Relations
All financial results and data used in this article can be retrieved from the SEDAR website.
The first half of the year was strong
As the purpose of this article is to see how ERE holds up when the capitalization rates start to increase and as its cost of debt is increasing as well, I will be pretty brief about the current financial results. The REIT will report its Q3 results pretty soon but I didn’t want to wait for those results to complete an assessment of the impact of the higher market interest rate on the financial results.
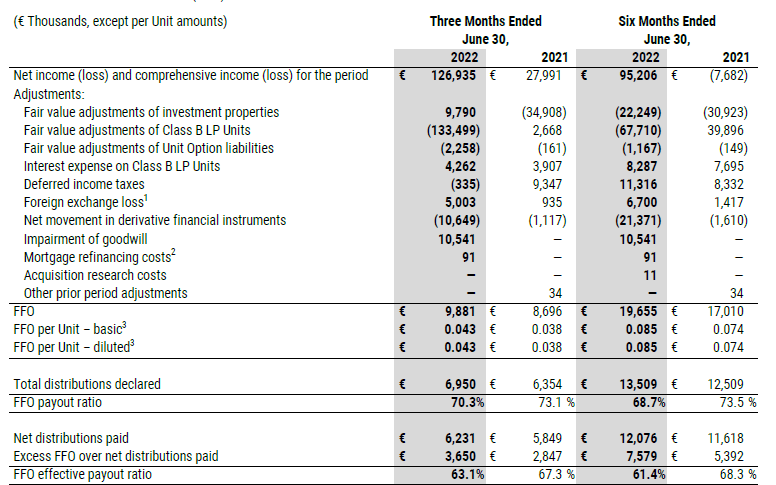
During the second quarter of the year, European Residential Real Estate generated just under 9.9M EUR in FFO as you can see below.
ERE Investor Relations
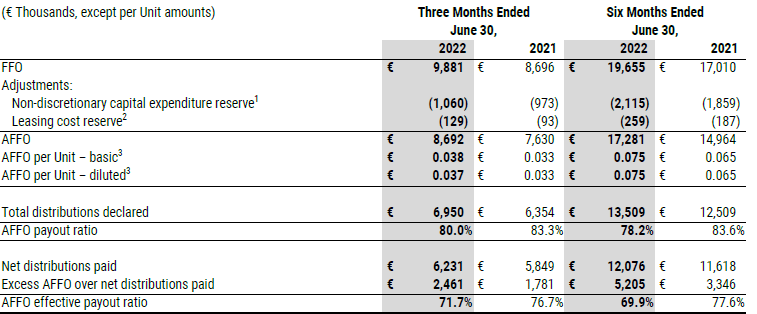
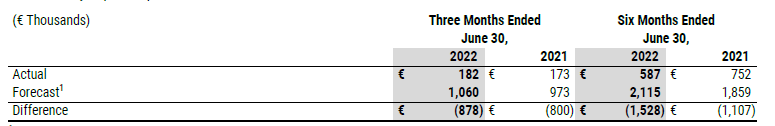
Perhaps even more interesting than the FFO is the AFFO in this case. As you can see below, EE recorded about 1.06M EUR in capital expenditures that are “non-discretionary” and should thus be seen as regularly occurring sustaining capex. The AFFO was 8.7M EUR or 0.038 EUR per share. On an annualized basis, this means ERE is generating approximately 0.15 EUR per share in AFFO. That’s just over C$0.20 which makes the current share price of just over C$2.80 pretty appealing for a residential REIT focusing on a first world country.
ERE Investor Relations
I find it intriguing the REIT is using the forecasted sustaining capex as that helps ERE to gradually include these expenses in the AFFO rather than suddenly having to record a high level of investments. As you can see below, only 182,000 EUR in sustaining capex was actually incurred and 1.06M EUR represents the forecasted sustaining capex requirements.
ERE Investor Relations
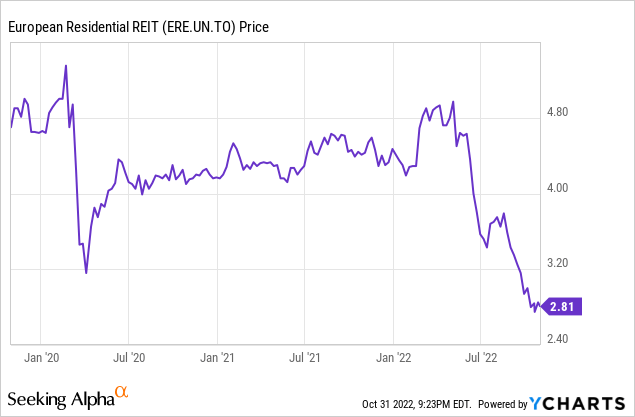
The share price has been sliding due to valuation concerns
Although the H1 results were strong and I anticipate the REIT to post a similar performance in the third quarter, the market has sold off European Residential REIT along with the rest of the market. There are two major concerns here that contribute to the selloff. The higher interest rates spark the fear for higher capitalization rates while the cost of debt obviously increases as well.
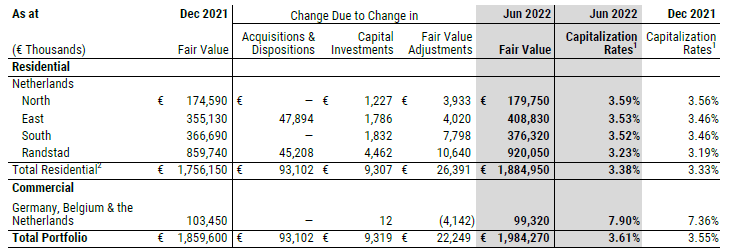
Let’s tackle the capitalization rate first. The image below shows the capitalization rates used to determine the fair value of the assets stood at an average of 3.38%, an increase from the 3.33% in December of last year.
ERE Investor Relations
That’s pretty low and will for sure start to increase. I think it makes sense to compare the capitalization rate with the 10-year Dutch government bond yield and as you can see below, that bond yield has increased by 240 base points since Dec. 31 and although there won’t be a 1:1 correlation in increased capitalization rates, I don’t expect a 3.38% capitalization rate to remain feasible. Ten months ago, the real estate was valued at a mark-up of approximately 335 bp over the risk-free interest rate. Right now, the 3.38% capitalization rate used for the Dutch real estate represents a mark-up of less than 100 base points.

Marketwatch.com
Fortunately ERE also provided a table with a sensitivity analysis for the fair value of the assets. As you can see below, a 0.50% increase in the capitalization rate will reduce in a 239M EUR decrease in the fair value of the assets. However, the inflation rate will likely also result in an increase of the NOI and the combination of a 5% NOI increase with a 0.50% capitalization rate increase would result in a fair value decrease of almost 156M EUR. That would reduce the total portfolio value from 1.985B EUR to 1.83B EUR. If you would assume a 10% NOI increase in the 2022-2023 time frame and a 125 base point increase in the capitalization rate to an average of 4.65% in the residential portfolio would result in a net decrease of the fair value by 408M EUR to approximately 1.58B EUR.
After deducting the 972M EUR in net debt, the NAV would decrease to approximately 610M EUR or 2.63 EUR per share. At an EUR/CAD exchange rate of 1.35, this represents a NAV of C$3.55 per share.
So even if you would increase the capitalization rates to close to 5%, the stock is still trading at a discount to NAV. That’s not the issue. The main issue at that point will be the LTV ratio as applying the 948M EUR in net debt to the 1.58B EUR in fair value of the assets would result in an LTV ratio of 60%. That’s uncomfortably close to the 65% upper limit of the debt to gross book value limits and it could potentially exceed the debt to market value limit of 60% if nothing happens.
This doesn’t have to be a reason to panic as ERE will retain some of its earnings as equity as well. The current monthly dividend has been established at 0.01 EUR per share. That’s 0.03 EUR per quarter and as ERE is generating approximately 8.7M EUR in AFFO in Q2, this basically means 1.75M EUR per quarter is being hoarded in undistributed AFFO. Additionally, ERE has a dividend reinvestment plan in place and in Q2 it was able to retain just under 2.5M EUR in AFFO by issuing new shares in lieu of a cash payment to some of its shareholders. Based on the Q2 performance, ERE will be able to retain at least 15M EUR (and likely more) in AFFO on its balance sheet, which will have a positive impact of 95 base points on the LTV ratio. Of course I do expect an NOI growth as rents will be hiked but even in a status quo situation, ERE will be somewhat able to offset the impact of higher capitalization rates on its debt ratio.
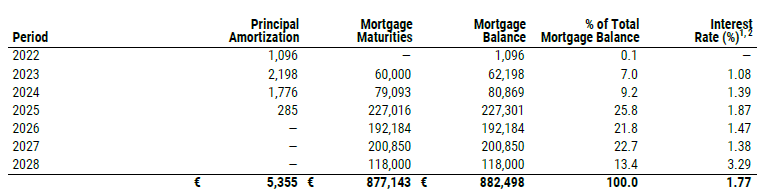
There’s one caveat here: The impact of higher interest rates on the FFO and AFFO may actually put those results under pressure. But let me start with this: ERE has the advantage of time. All of its debt has a fixed interest rate (either because the rate was fixed when it entered into the loans, or because it entered into interest rate swap agreements). This was a brilliant move by the CFO of ERE as this allowed the REIT to fully take advantage of the ultra-low mortgage rates we saw in Western Europe in the past few years. This results in an average interest rate of just 1.77% on the mortgages despite recently having entered into a more expensive mortgage with a 3.29% cost of debt (and it looks like ERE will soon have to pay an interest rate on its debt that’s higher than the current capitalization rate of the assets).
ERE Investor Relations
While there’s little refinancing risk in 2023 and 2024, we should be prepared to see a very substantial increase in the interest rates. The total debt position on the balance sheet (predominantly consisting of the mortgages as shown above) stands at 963M EUR and a 150 base point interest increase would cost the REIT an additional 14.4M EUR in annual interest expenses. This means the interest payments would double which would cause the AFFO per share to decrease by over 40%.
And as the risk-free interest rate has increased further since June, the month the new (expensive) mortgage was completed in June and the Dutch 10-year government bond is slightly more expensive now.
Fortunately ERE has some time as rent hikes will boost the NOI which will make interest rate increases more palatable. But that may not be sufficient. Even if ERE is able to hike its NOI (on the current asset basis, so excluding the sale or acquisition of additional assets) by 7% in 2023 and 5% in 2024, the quarterly AFFO would still “only” increase by 1.9M EUR per quarter which would not be sufficient to offset the interest increases in the longer run.
Investment thesis
While I think the current capitalization ratio of 3.38% for Dutch residential real estate is too low given the current market circumstances and the evolution of the risk-free interest rate, I think ERE is in a good position to mitigate the impact of increasing cap rates (which won’t suddenly jump by 100 or 125 base points overnight anyway, so ERE has some time to make its balance sheet even more robust).
While ERE isn’t perfect, I like the balance sheet much better than larger German competitor Vonovia where the LTV ratio could come under severe pressure in the next few quarters and years. ERE’s distribution is currently well-covered but going forward, it will be important for ERE to hike the rent it charges its tenants while it will have to renegotiate maturing mortgages to get the best possible interest rate out of the deal. Not the NAV or LTV ratio are the issue here, but the impact of the rapidly increasing mortgage interest rates.
I’m getting quite interested in ERE.UN but don’t have a long position yet. I hope upcoming rent hikes will pre-emptively solve the looming refinancings, which will be more expensive than the current mortgages.
Be the first to comment