

Miro Nenchev
EuroDry (NASDAQ:EDRY) is the owner and renter of a fleet of 11 dry bulk ships. The company is the sister of Euroseas (ESEA), a company I covered recently, that owns a fleet of container ships. EuroDry has seen its price soar the past two years moved by a tremendous increase in dry bulk rates.
As I covered for Euroseas, the shipping industry has bad characteristics from a competitive standpoint: it is commoditized, prone to oversupply and fierce price competition.
However, different from Euroseas, EuroDry seems to be priced with more reasonable expectations, that do not differ significantly from what has been seen in the previous decade. Not only this, but EuroDry’s dry bulk market rates have better perspectives, mostly based on a much lower ship orderbook than is the case for container ships.
For that reason I believe EuroDry to be a better consideration to its sister Euroseas and to be adequately priced on its own, albeit being part of a not very desirable market.
Note: Unless otherwise indicated, all information has been obtained from EDRY’s filings with the SEC.
The dry bulk shipping industry
For the most part, the dry bulk shipping industry is not very different from the container shipping industry, which I covered in detail in my article on Euroseas. In this article, I will summarize the main points, adding some differences with the container shipping industry.
The main characteristics of the industry are heavy fixed capital investments and costs, extreme rivalry and commoditization, each leading to the below dynamics.
Ships are expensive assets that have important lead times of up to two years. The bulk of a ship owner’s cost is sunk (not literally) once the ship is purchased. Other operating costs like the crew and docking are also semi-fixed in nature.
Already committed investments and fixed costs lead to fierce price rivalry. For a ship’s owner, anything that can be obtained from the ship is better than having it still in a port.
Finally, rivalry and a completely undifferentiated product lead to commoditization. The most distinguished aspect of a commoditized market is centralized exchange. Shipping has its most important exchange in the Baltic Exchange in London, which publishes the Baltic Dry Index (BDIY:IND), together with specialized indexes for particular types of ship sizes and routes.
Usually, investors do not want to participate in commoditized industries because basic economics teach that competition leads to lower profitability. This of course is relative to price in public markets.
My understanding is also that shipping suffers from long term cycles of slowly decreasing offer, generated by low prices and net divestments (in the form of scrapping), followed by sudden supply constraints that cause price squeezes, which in turn lead to overinvestment, and finally to long term over supply and depressed prices again.
What has been commented is true for dry bulk shipping and container shipping. I believe there are a few differences between dry bulk and container shipping as well.
One difference is demand price elasticity of the products carried. While containers carry finished goods, mostly from industrialized to industrialized countries (those that have both the factories and the income to purchase things), dry bulk carriers move raw materials from usually less industrialized to industrialized countries. In my understanding, container cargo is more cyclical than dry bulk cargo, which is more defensive. A country may import less iPhones, but it will be much more difficult to import less fuel, iron, coal, etc. (in relative terms). This is also important from the perspective of a new conflict prone, trade averse world order. While Chinese and Americans may fight over iPhones, it seems difficult that they will fight on rare earths. The same is true for Chinese and Australians with iron or coal, and can be seen patently between Russians and their Western counterparts.
Future supply in the dry bulk market
Another important difference between containerized and dry bulk shipping markets is the expected supply conditions in the next few years.
In the article on Euroseas, I explained that order books for container ships are at several years highs, which will put future pressure on prices a few years in the future, when supply is abundant. Some readers also commented counter trends in this sense, mostly nuances between order for different ship sizes (feeder vs interoceanic) and the effect of new environmental regulations decreasing the speed older ships can operate at.
However, the dry bulk market is in a different demand and supply balance today, with different perspectives in the future.
To begin with, while the container ship markets are very close to record levels almost five times as high as previous levels (expressed in the new Contex index), the prices for dry bulk cargo are high but have already receded and the difference between their peak and valley is much less pronounced.
The Baltic Dry Index measures a weighted average time chart rate index. It is constructed by averaging 22 routes for 3 different ship sizes (capesize, panamax and supramax) based on daily time charter rates. This means that if the BDI is at 1,500 then an average daily rate for an average size ship is $15 thousand. Other more specific indexes exist for each size (BACI, BPNI and BSIS for the three mentioned previously).
As can be seen in the chart below, current dry bulk rates are not that dissimilar from the prices seen for much of the previous decade. The previous peak was also not that tremendous.
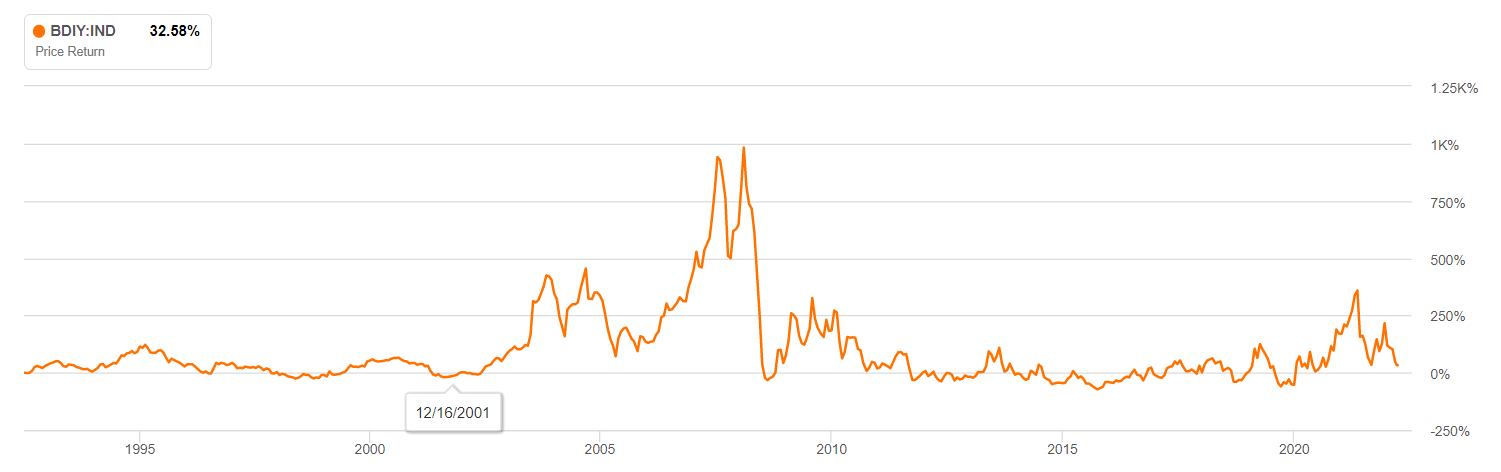
Baltic Dry Index Futures (Seeking Alpha)
Most importantly, the dry bulk market is not going to increase its supply in the next few years at least, because orderbooks are not in record levels. A report from Hellenic Shipping News from May 2022 cites that the current order book is at 6% of worldwide capacity, against 30% for container ships. Considering an average ship life of 25 years, that means a little bit above replacement. The same is reported by Lloyd’s and Breakwave Advisors.
Ships take 18 to 24 months to be delivered after placing an order, which means that if supply is not ordered today, it will not be in the market at least until 2H24. This provides more certainty regarding future charter prices.
EuroDry in particular
Management, costs and financing
EuroDry is also owned and managed by the Pittas family, through a management agreement with an affiliate called Eurobulk. It brokers its ships through another affiliate called Eurochart.
The prices paid for that management are the same for EuroDry and Euroseas, about $700 per day per vessel. EuroDry pays a $1.25 million yearly fixed rate, while Euroseas pays a $2 million fixed rate.
In the article about Euroseas, I presented my concerns regarding governance. The management affiliates, belonging to the Pittas family, receive more than 10% of revenues in the form of commissions, but Marshallese law, where both companies are registered, does not require an independent party audit of those transactions.
In terms of other costs, just like Euroseas, EuroDry’s structure is mostly fixed across time, moving only with the number of vessels operated. We calculate an operating breakeven TCE of about $9 thousand per day per vessel. The calculations below are based on the company’s 20-F reports for 2021 and 2019.
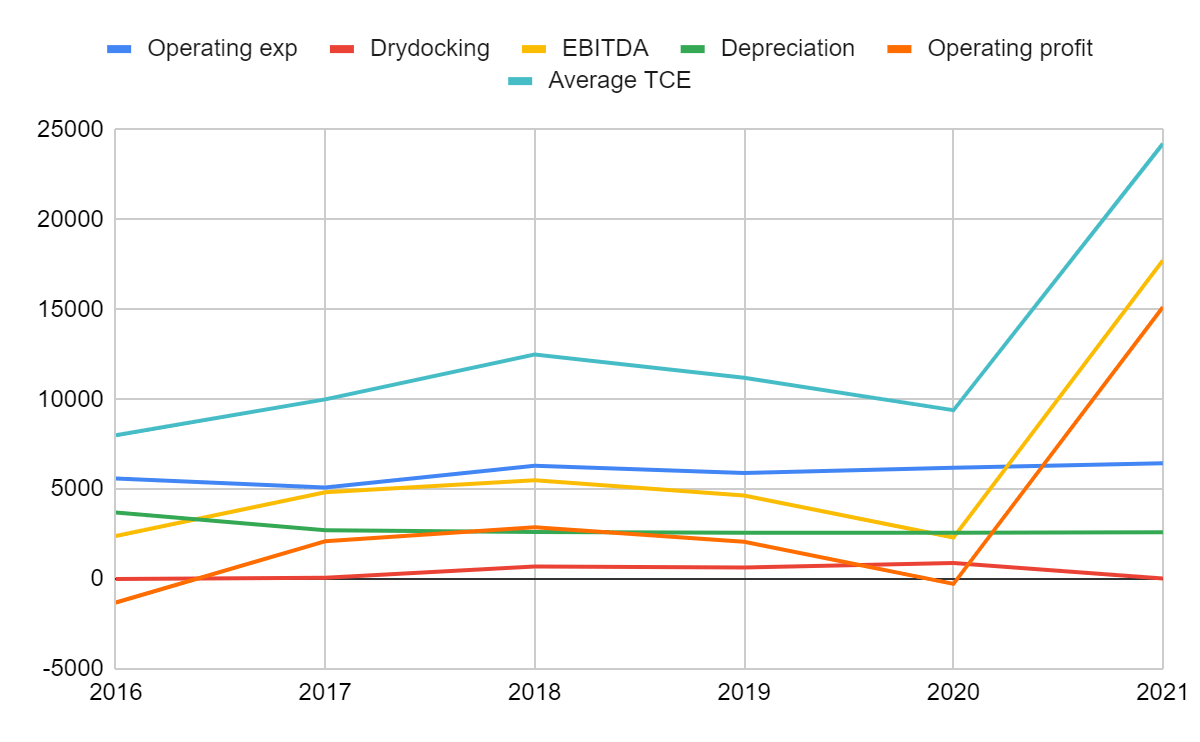
EDRY’s cost structure per vessel (Own based on EDRY’s 20-F reports)
As of 2Q22, the company has about $75 million in debts, paying 2.7% to 3.6% + LIBOR, which would yield currently about 7%. Only $25 million are fixed through swaps. This means approximate interest expenses of $5 million yearly. Maturities are somewhat concentrated in the next three years, with $50 million maturing until 2024.
To counteract these maturities, the company has about $5 million in cash after paying for certain vessel acquisitions (more below). With $20 million generated in operating cash flows in 1H22, maturities for this years should not be a problem.
The company also announced a $10 million share repurchase program, which should reduce the amount of stock by 15%, considering an average market cap of $60 million.
Assets and future rates
EuroDry has acquired only one ship this year and has no ships on its orderbook. This means the company has some flexibility to apply future profitability to debt repayment, share repurchases or dividend payments.
Its total fleet as of 1H22 is 11 ships, six Panamax, two Kamsarmax, two Ultramax and one Supermax. The ships are relatively new, with only two dating from the year 2000, which means none of them is in the average scrapping age.
In contrast with Euroseas, as of December 2021, none of EDRY’s ships were chartered with maturities beyond 2022. The picture started changing this year, with two Kamsarmax chartered until 2023 and 2024, unfortunately at variable rates based on Baltic indexes.
As can be seen from the chart below, from the announcement of 2Q22 results, plenty of charters with fixed prices are maturing in August, September and October. Watching the development of those prices will be very important. Will they receive fixed payments in better terms?
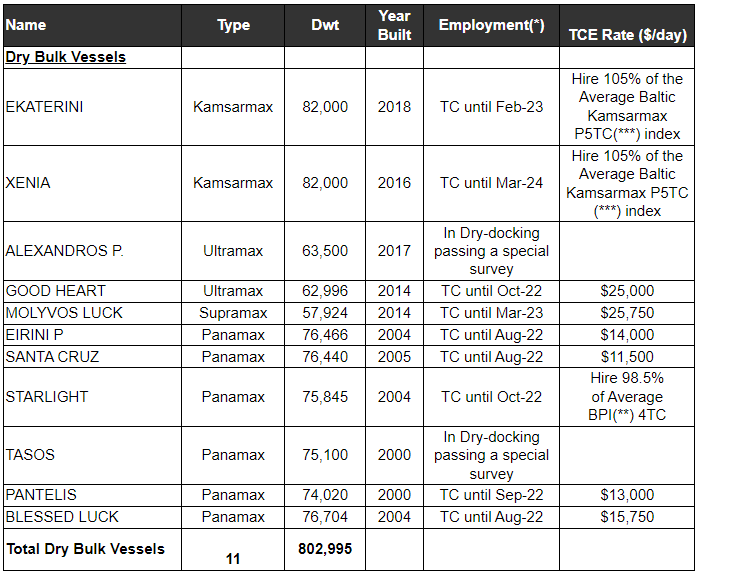
EuroDry’s fleet and employment (2Q22 results announcement)
Future profitability calculations and implied prices
Unfortunately, without fixed chart rates for the foreseeable future for most of the fleet, it is difficult now to consider two or three year excess profitability as we did for Euroseas. Not even 2H22 profitability is assured without renovation of charter rates.
However, it is probable that it will be relatively higher, the reason is that current BPNI stands at about 1900, or a daily charter rate of $19 thousand, compared with EDRY’s Panamaxes rates of about $14 thousand. This will be counteracted by Supramax rates at about $16 thousand against EDRY’s rates of $25 thousand.
So let’s say that EDRY generates $20 million in operating cash flows in 2H22 as it did on 1H21, and it uses $10 million to repurchase shares as it announced and $10 million to pay back debt. Let’s also assume that the company can refinance the remaining debt at the same variable spread of about 3% + LIBOR.
That means future interest payments of about $4.5 million ($65 million by 7% rate). We also need about $4 million in net income to justify an $18.2 price per share for 2.1 million shares remaining after repurchases (15% of the current stock base repurchased with $10 million). This is equivalent to net earnings of $1.8 per share.
The average charter rate needed for that profitability, considering fixed operating costs of $9 thousand per day per vessel, commissions of 5% on charter revenues, $4.5 million in interest expenses and no income taxes (because of shipping industry treatment in the US and company location in Marshall Islands), is about $12 thousand per day per vessel.
That would represent a Baltic Panamax Index of about 1,200 points. The chart below includes a 1,200 points line, showing that it is not inconsistent with last decade levels.
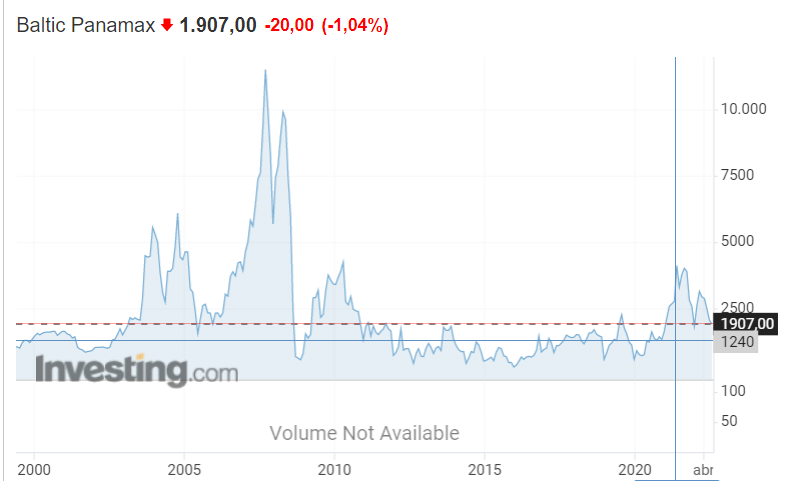
Baltic Panamax Index (Investing.com)
Conclusions and micro cap risks
In general, shipping is not a great industry, because it is so commoditized that the companies operating in the industry have very little moat. An industry like this is better for someone speculating from a top-down approach rather than a fundamentally conservative bottom-up approach like the one shown in this article.
Taking that into account, EDRY is much more reasonably priced than its sister ESEA, in terms of the rates that would justify the profitability implied in stock prices. From a very simple supply demand approach, the dry bulk market is more protected because prices are not as high and because supply is not going to increase as much as in the container ship index.
EDRY also has risks associated with its size, being a microcap against ESEA which is more of a small cap. Trading is probably lower, spreads bigger, and institutional involvement lower. These are probably sources of less efficient pricing but also of liquidity risks.
With data from the 3Q22, showing new charter rates for the charters maturing in August and October will also provide more certainty regarding 2022 and 2023 profitability.
Personally, I would not invest on EDRY based on the undesirable competitive characteristics of its industry. However, if I were to speculatively invest in the industry, I would prefer EDRY to ESEA.
Be the first to comment