

EUR/USD is attempting an upside correction above 1.0800. USD/JPY rallied above 128.50 and traded to a new 20-year high.
Important Takeaways for EUR/USD and USD/JPY
· The Euro started an upside correction from the 1.0760 zone.
· There was a break above a key bearish trend line with resistance near 1.0805 on the hourly chart of EUR/USD.
· USD/JPY extended rally above 128.00 and traded to a new 20-year high.
· There is a major bullish trend line forming with support near 127.75 on the hourly chart.
EUR/USD Technical Analysis
This past week, the Euro started saw bearish moves below the 1.0950 level against the US Dollar. The EUR/USD pair declined heavily below the 1.0900 support zone.
The pair even broke the 1.0850 level and settled below the 50 hourly simple moving average. A low was formed near 1.0757 on FXOpen and the pair is now correcting higher. There was a move above the 1.0800 resistance level.
Besides, there was a break above a key bearish trend line with resistance near 1.0805 on the hourly chart of EUR/USD. The pair climbed above the 1.0810 zone and the 50 hourly simple moving average.
It tested the 38.2% Fib retracement level of the key decline from the 1.0923 swing high to 1.0757 low. An immediate resistance on the upside is near the 1.0825 level. The next major resistance is near the 1.0840 level.
The 50% Fib retracement level of the key decline from the 1.0923 swing high to 1.0757 low is also near the 1.0840 level. The main resistance is near the 1.0850 level. An upside break above 1.0850 could set the pace for a steady increase.
If not, the pair might drop and test the 1.0800 support. The next major support is near 1.0790 or the 50 hourly simple moving average, , below which the pair could drop to 1.0760 in the near term.
USD/JPY Technical Analysis
The US Dollar started a major increase after it broke the 125.00 resistance zone against the Japanese Yen. The USD/JPY pair broke the 126.50 level and extended rally.
The pair even traded above the 128.50 level and the 50 hourly simple moving average. It traded to a new 20-year high above 19.20 and is currently correcting gains. There was a move below the 23.6% Fib retracement level of the upward move from the 125.08 swing low to 129.40 high.
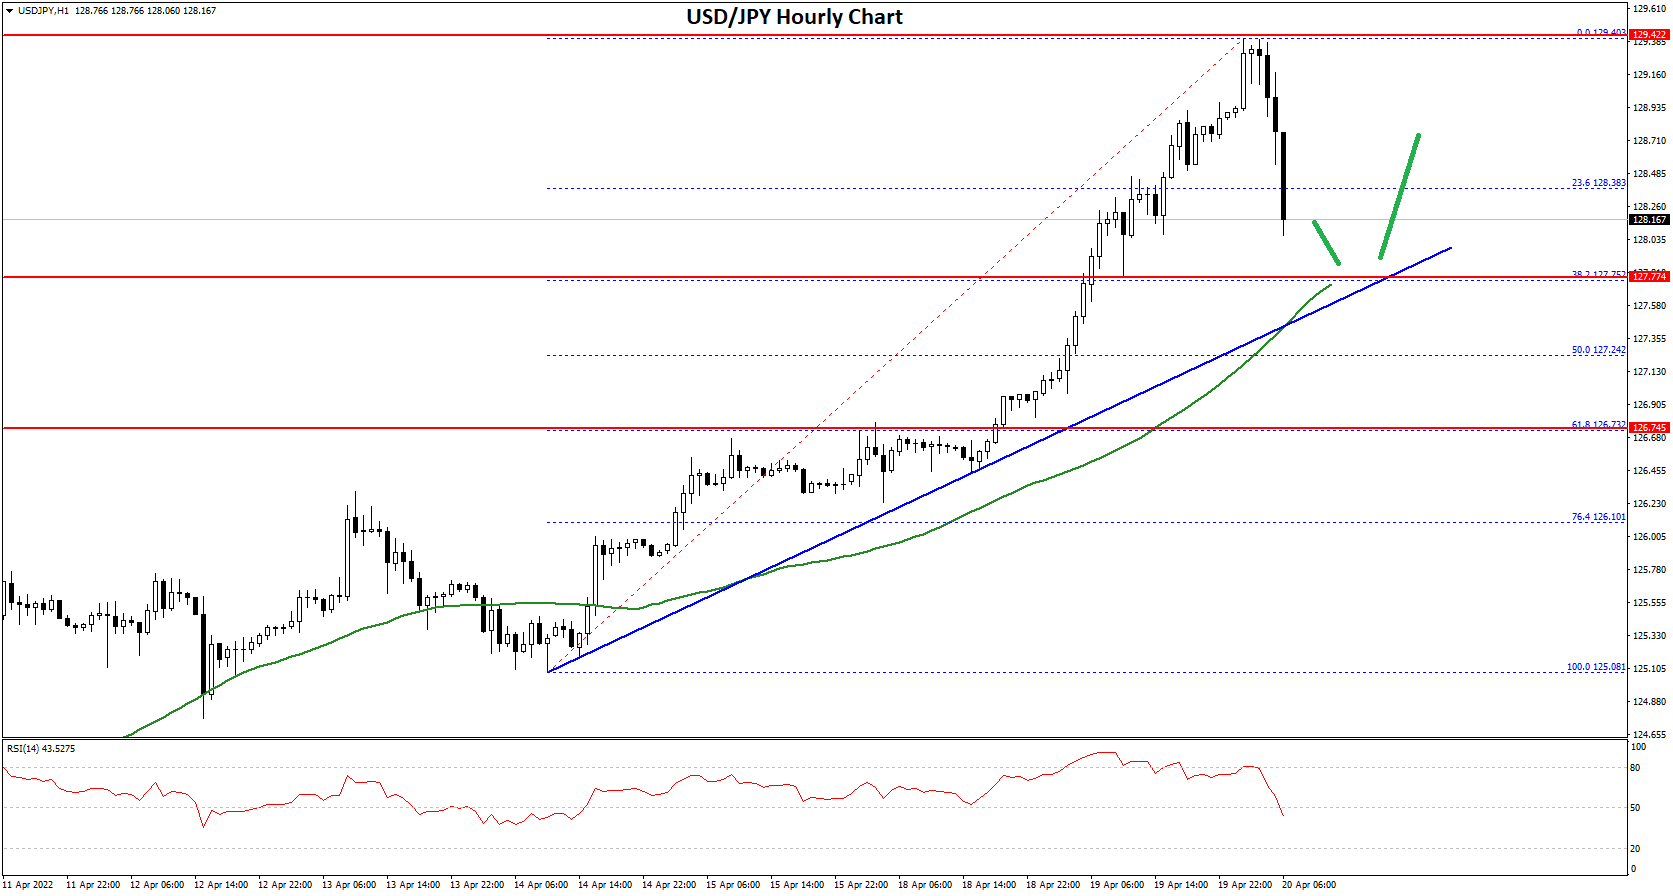
An initial support on the downside is near the 127.75 level. There is also a major bullish trend line forming with support near 127.75 on the hourly chart.
The next major support is near the 127.25 level. It is near the 50% Fib retracement level of the upward move from the 125.08 swing low to 129.40 high. Any more downsides might lead the pair towards the 126.75 support zone, below which the bears might aim a test of the 126.10 support zone and the 50 hourly simple moving average in the near term.
On the upside, an initial resistance is near the 129.00 level. The next major resistance is near the 129.40. Any more gains could send the pair towards the 129.80 level. The next key hurdle is near the 130.00 level.
This forecast represents FXOpen Markets Limited opinion only, it should not be construed as an offer, invitation or recommendation in respect to FXOpen Markets Limited products and services or as financial advice.

Be the first to comment