

EUR/USD Rate Talking Points
EUR/USD trades to a fresh monthly low (1.1867) as it extends the series of lower highs and lows following the Federal Open Market Committee (FOMC) interest rate decision, and recent developments in the Relative Strength Index (RSI) warn of a further decline in the exchange rate as the indicator pushes into oversold territory for the first time since February 2020.
EUR/USD Faces First Oversold RSI Reading Since February 2020
EUR/USD trades below the 200-Day SMA (1.1992) for the first time since April as Federal Reserve officials forecast two rate hikes for 2023, and speculation for a looming shift in Fed policy may keep the exchange rate under pressure as Chairman Jerome Powell and Co. continue to boost their outlook for the US economy.
In contrast, the European Central Bank (ECB) appears to be in no rush to switch gears as “the Governing Council expects net purchases under the PEPP (pandemic emergency purchase programme) over the coming quarter to continue to be conducted at a significantly higher pace than during the first months of the year,” and it seems as though the ECB will support the Euro Area throughout the remainder of the year as Chief Economist Philip Lane insists that the central bank is “not ready to go anywhere near tapering or anything like that at the moment.”
In a recent interview with Bloomberg TV, Lane emphasized that “where the United States is today and where the euro area is are so different, both in terms of the stage in the pandemic recovery,” with the Governing Council member delivering a dovish forward guidance amid “the fact that the inflation outlook remains quite subdued.”
It seems as though the ECB is on a preset course as Lane argues that it will be “a multi-year challenge” to achieve its one and only mandate for price stability, and the deviating paths for monetary policy casts a bearish outlook for EUR/USD as the FOMC pledges to “give advance notice before announcing the decision to taper.”
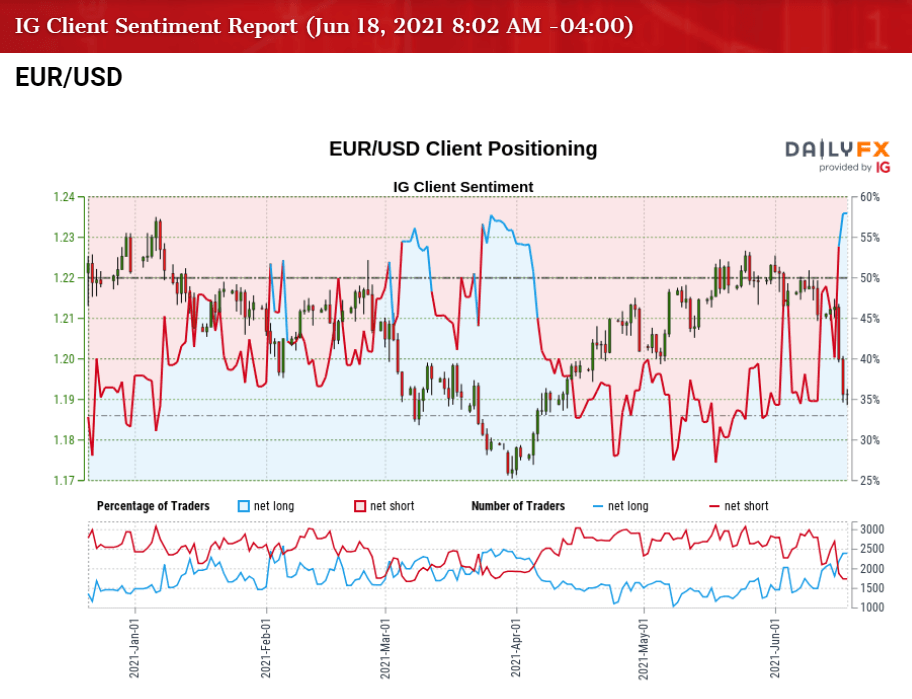
However, the recent selloff in EUR/USD has spurred shift in retail sentiment, which mimics the price action from earlier this year, with the IG Client Sentiment report showing 57.24% of traders currently net-long the pair as the ratio of traders long to short stands at 1.34 to 1.
The number of traders net-long is 8.57% higher than yesterday and 58.65% higher from last week, while the number of traders net-short is 6.13% lower than yesterday and 34.86% lower from last week. The jump in net-long position has generated a flip in retail sentiment as 39.98% of traders were net-long EUR/USD ahead of the FOMC rate decision, while the decline in net-short interest could be a function of profit-taking behavior as the exchange rate bounces back from a fresh monthly low (1.1885).
With that said, it remains to be seen if the decline from the January high (1.2350) will turn out to be a correction in the broader trend rather than a change in market behavior as EUR/USD trades below the 200-Day SMA (1.1992) for the first time since April, but the shift in retail sentiment may coincide with a further decline in the exchange rate like the behavior seen earlier this year.
At the same time, looming developments in the Relative Strength Index (RSI) may also cast a bearish outlook for EUR/USD if the indicator breaks below 30 and pushes into oversold territory for the first time since February 2020.
EUR/USD Rate Daily Chart
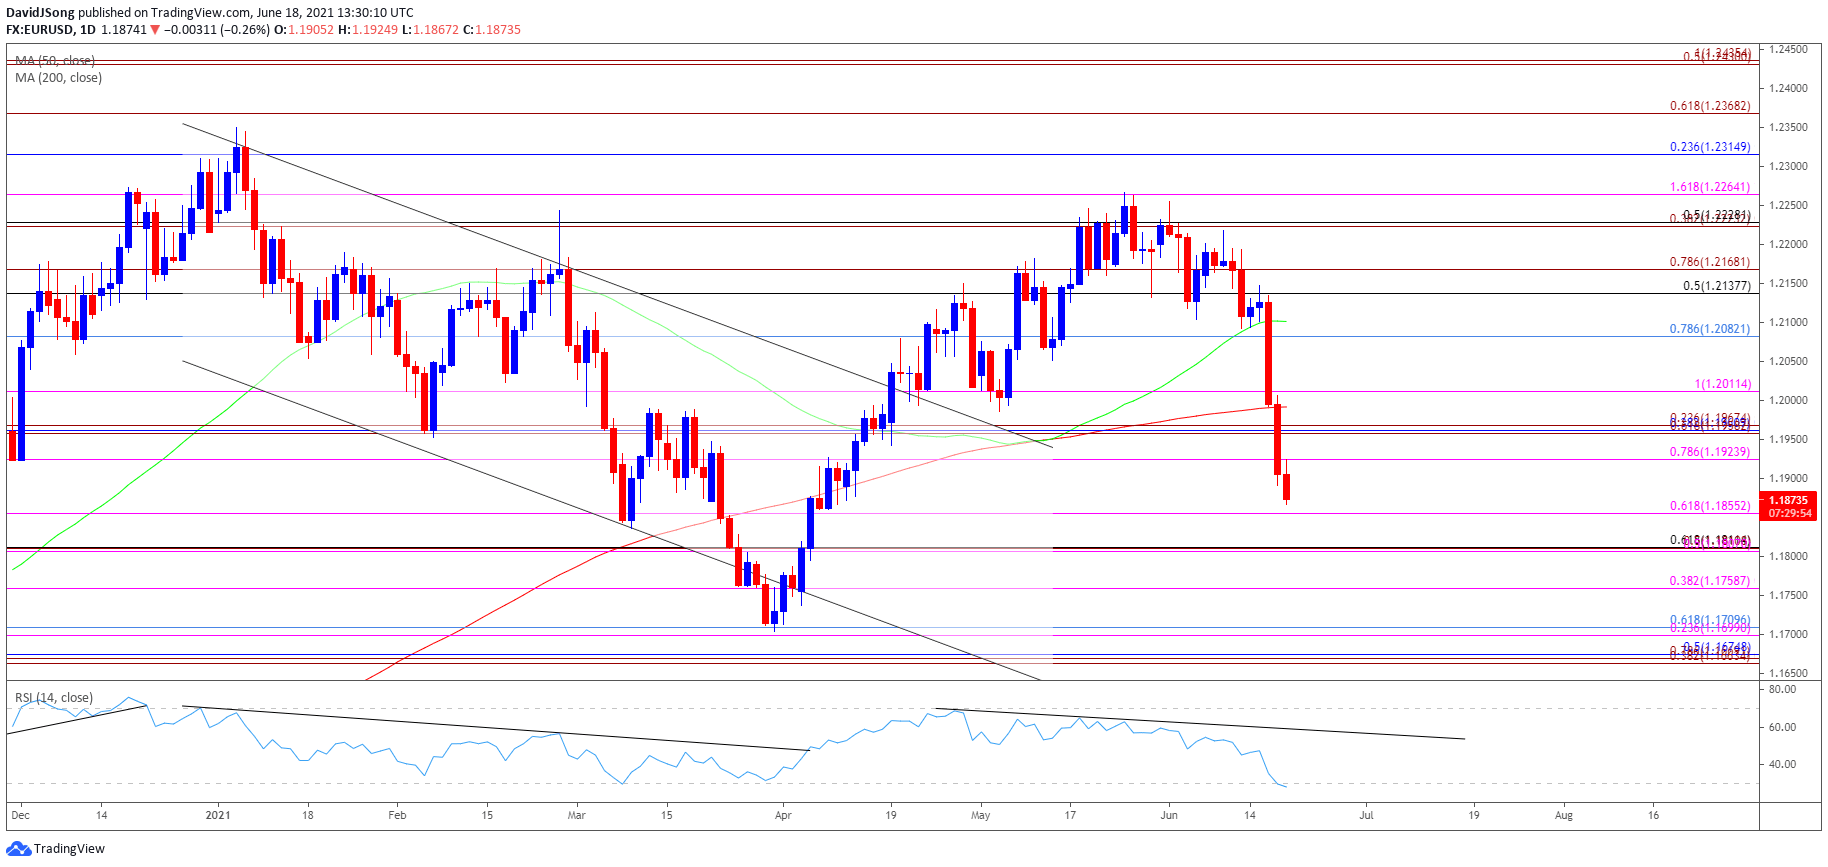
Source: Trading View
- EUR/USD remains under pressure after snapping the opening range for June, with the exchange rate trading below the 200-Day SMA (1.1992) for the first time since April.
- The Relative Strength Index (RSI) highlights a similar dynamic as it continues to track the downward trend from late April, with recent developments in the indicator offering a bearish outlook for EUR/USD as it breaks below 30 and pushes into oversold territory for the first time since February 2020.
- The break/close below 1.1920 (78.6% expansion) brings the 1.1860 (61.8% expansion) area on the radar, with the next region of interest coming in around 1.1810 (61.8% retracement).
- The 1.1700 (23.6% expansion) to 1.1710 (61.8% retracement) zone comes next, which largely lines up with the March low (1.1704), followed by the Fibonacci overlap around 1.1660 (38.2% expansion) to 1.1680 (50% retracement).
— Written by David Song, Currency Strategist
Follow me on Twitter at @DavidJSong
Be the first to comment