

EUR/USD started a fresh decline and traded below 1.0350. EUR/JPY is also diving and remains at a risk of more losses below 138.50.
Important Takeaways for EUR/USD and EUR/JPY
· The Euro started a major decline from the 1.0500 and 1.0480 resistance levels.
· There is a key bearish trend line forming with resistance near 1.0400 on the hourly chart.
· EUR/JPY also started a major decline below the 140.50 and 140.00 support levels.
· There is a major bearish trend line forming with resistance near 141.50 on the hourly chart.
EUR/USD Technical Analysis
The Euro failed to clear the 1.0500 resistance against the US Dollar. The EUR/USD pair started a major decline below the 1.0450 and 1.0350 support levels.
There was a clear move below the 1.0320 level and the 50 hourly simple moving average. The pair even settled below the 1.0280 level. A low was formed near 1.0235 on FXOpen and the pair is now consolidating losses.
On the upside, the pair is facing resistance near the 1.0290 level. It is near the 23.6% Fib retracement level of the downward move from the 1.0462 swing high to 1.0235 low.
The next major resistance is near the 1.0350 level. It is near the 50% Fib retracement level of the downward move from the 1.0462 swing high to 1.0235 low. Besides, there is a key bearish trend line forming with resistance near 1.0400 on the hourly chart.
A clear break above the 1.0400 resistance could push EUR/USD towards 1.0500. If the bulls remain in action, the pair could revisit the 1.0550 resistance zone in the near term.
On the downside, the pair might find support near the 1.0235 level. The next major support sits near the 1.0200 level. If there is a downside break below the 1.0200 support, the pair might accelerate lower in the coming sessions.
EUR/JPY Technical Analysis
The Euro also started a fresh decline from the 142.40 resistance against the Japanese Yen. The EUR/JPY pair gained pace and traded below the 142.00 support level.
The pair even broke the 140.00 level and the 50 hourly simple moving average. It traded as low as 138.65 and is currently correcting losses. An immediate resistance on the upside is near the 139.50 level. It is near the 23.6% Fib retracement level of the downward move from the 142.36 swing high to 138.65 low.
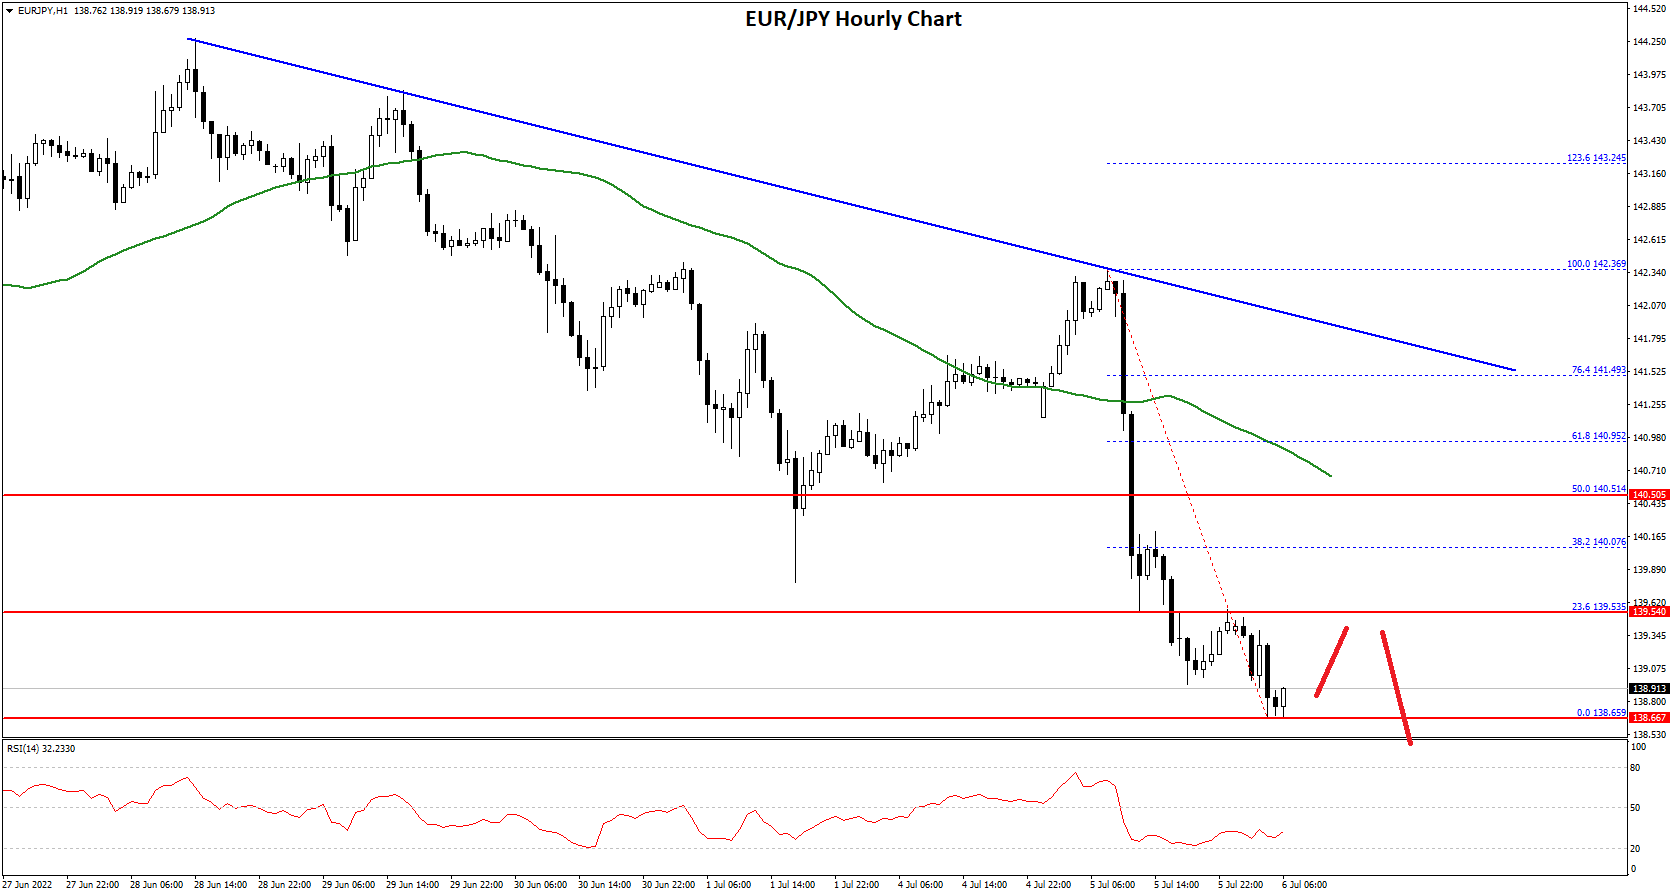
The next major resistance could be near the 140.50 level. It is near the 50% Fib retracement level of the downward move from the 142.36 swing high to 138.65 low.
There is also a major bearish trend line forming with resistance near 141.50 on the hourly chart. If there is an upside break above the 141.50 resistance, the pair could test the 142.50 resistance. Any more gains might send the pair towards the 142.50 level.
If not, the pair could start a fresh decline below the 138.65 support. The next major support is near the 138.00 level. The main support sits near the 137.40 level. Any more losses could lead the pair towards the 135.00 support level in the near term.
This forecast represents FXOpen Markets Limited opinion only, it should not be construed as an offer, invitation or recommendation in respect to FXOpen Markets Limited products and services or as financial advice.

Be the first to comment