

ETHUSD: Bullish Engulfing Pattern Above $4000
Ethereum is moving in a strong bullish momentum after clearing the psychological resistance level of $4000. The price of ETHUSD touched an intraday high of $4241 in the Asian trading session and is now preparing for its next rally towards the $5000 handle.
ETH is now trading above its pivot level of $4157 and Fibonacci resistance level of $4169. The price of Ethereum is surging continuously today and is about to break its classic resistance level of $4206.
Ether is expected to maintain the bullish tone this week and continue towards the $4500 mark as the bulls take over. All the major technical indicators are giving a BUY signal.
ETH is now moving above both the 100 hourly and 200 hourly simple moving averages. Bullish engulfing pattern above $4000 suggests that we could witness a fresh rally towards $5000 soon.
- Ethereum continues to remain above the psychological level of $4000
- Short-term to medium-term outlooks remain bullish for ETHUSD
- All the moving averages are giving a STRONG BUY signal
- The pair is expected to touch $4500 in the US trading session today
Ether’s Rally Towards $5000 Confirmed
ETHUSD is consolidating its gains above $4000 and is now preparing for its next upwards move against the US dollar. ETH is now facing its next major resistance levels of $4240 and $4320, after which the path towards $4500 will get cleared.
After surging above $4000, Ethereum’s volatility is low, suggesting that now investors are waiting to enter the market anticipating a major bullish move.
ETH has gained 8.79% with a price change of +$339.35 in the past 24hrs and has a trading volume of 24.516 billion USD.
Ethereum ETF
The total market capitalization of Ethereum continues to increase, and at present is valued at 455 billion USD. The investors are eagerly waiting for the launch of Ethereum ETF in the US markets, which would bring a larger number of investors into its domain.
Grayscale has announced its plans to launch an ETF based on Ethereum. At the moment, 4 Ethereum ETFs are trading in Canadian securities exchange, and plans are on to launch in the US market.
Some crypto analysts believe that with the Ethereum ETFs, more institutional investors will come in, leading to its higher demand and a surge in the price well above $6000.
The Week Ahead
Ethereum dips remain well supported, and an increased buying pressure is seen above the $4000 mark. The bullish trend continues from last week. Any bearish corrections will serve as a buying opportunity for long-term traders.
This week we may witness Ethereum touching the levels of $4500 — and then extending its rally towards the $5000 handle in the opening of the next week.
As the price of ETHUSD remains above its 100 hourly exponential moving average, a breakout above $4400 is expected this week.
Technical Indicators:
Average directional change (14-day): at 48.125 indicating a BUY
Bull/Bear power (13-day): at 47.63 indicating a BUY
Rate of price change: at 1.148 indicating a BUY
Moving averages convergence divergence (12,26): at 66.36 indicating a BUY
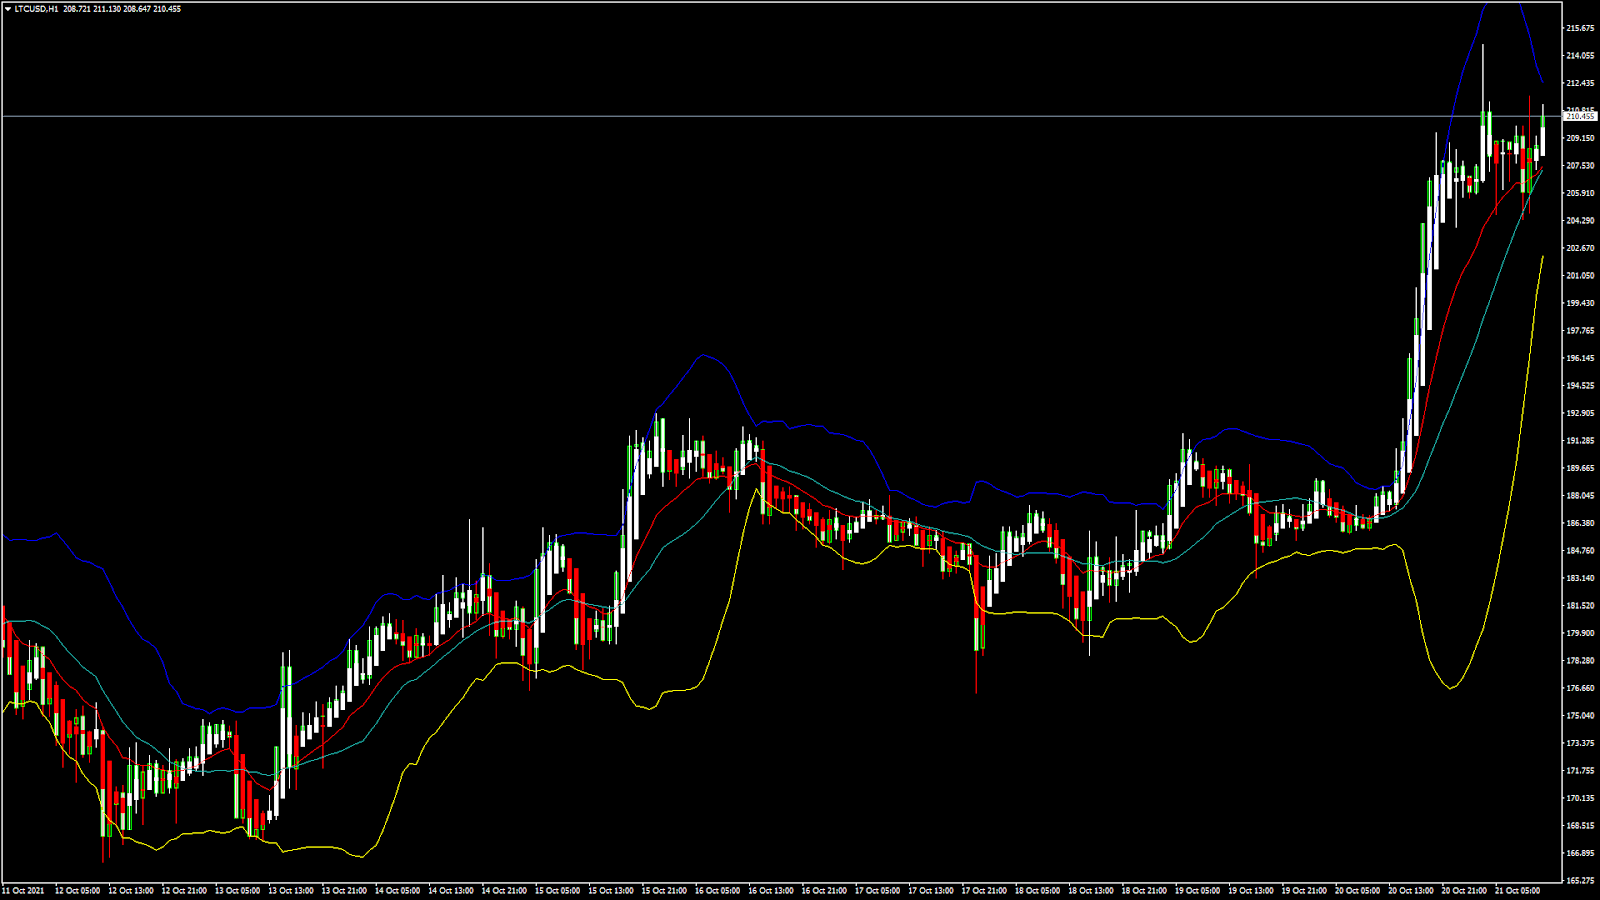
LTCUSD: Bullish Breakout Pattern Above $185
Litecoin is moving in a strong bullish breakout pattern above the $185 mark and is now trading above its 100 hourly simple and exponential moving average.
The price of LTCUSD touched an intraday high of 214.65 in the Asian trading session after which some short selling was seen pushing its prices below $205. Litecoin saw a gain of 9.85% yesterday and continues to consolidate its gains well above the $200 mark.
Litecoin is now on its way to clear its Fibonacci resistance level of 210.16 and classic resistance level of 211.23, after which the path towards $225 to $235 will get cleared.
The rally which was seen in Litecoin yesterday continues, and we could witness the level of $220 in the US trading session today. Short- to medium-term outlooks for Litecoin remain bullish with the target of $240.
- All the moving averages are giving a STRONG BUY signal
- Litecoin is now facing its major resistance level of $225
- Continuation of the bullish trend suggests a breakout above $220
- Average true range indicates less market volatility today
Litecoin Rally Towards $225 Confirmed
The price of Litecoin is now ranging above the exponential moving average, suggesting that a fresh rally is expected pushing its prices well above the $220 handle.
The pullback we saw in Litecoin today after falling to its lows of 204.74 was strong, with the price steering above the $210 mark.
Litecoin is trading with less market volatility today as the prices are in a consolidation phase now. In the last 24hrs LTCUSD has risen UP by +12.08% / +22.62$, and has a 24hr trading volume of 3.412 billion USD.
The Week Ahead
The price of Litecoin will be in a range bound movement after clearing the $200 handle and it is expected to breakout above $220 in a fresh rally expected this week.
There is no short selling seen, and the dips remain well supported leading to an upwards correction in its prices continuously.
We could witness levels of $225 this week, and next week, Litecoin is expected to trade at levels of above $235.
With the increase in the number of crypto investors, the total market capitalization of LTC has increased to 14.476 billion USD.
Technical Indicators:
Relative strength index (14-day): at 66.60 with a BUY
Rate of price change: at 0.917 with a BUY
Moving averages convergence divergence (12,26): at 3.892 with a BUYBull/Bear power (13-days): at 3.480 indicating a BUY

Be the first to comment