

Ethereum/Bitcoin (ETH/BTC) Chart and Analysis
- ETH/BTC spread back to highs last seen in May 2018.
- Long-term bullish weekly trade set-up.
One closely watched crypto market indicator – the ETH/BTC spread – is pushing towards a new all-time high and the technical outlook for the longer-term remains positive. The daily chart shows the spread continuing to rally off the mid-October multi-month low with the acceleration this week taking it through a zone of resistance between 794 and 815 with relative ease. While the CCI indicator currently shows this spread as heavily overbought, this zone should now turn to support and pave the way for further gains. This spread is closely watched as it normally indicates a period of alt-coin outperformance against the market leader. While some consolidation may be seen in the coming days, another indicator on the weekly chart is completing another bullish signal.
Ethereum/Bitcoin Spread (ETH/BTC) Daily Price Chart – December 1, 2021
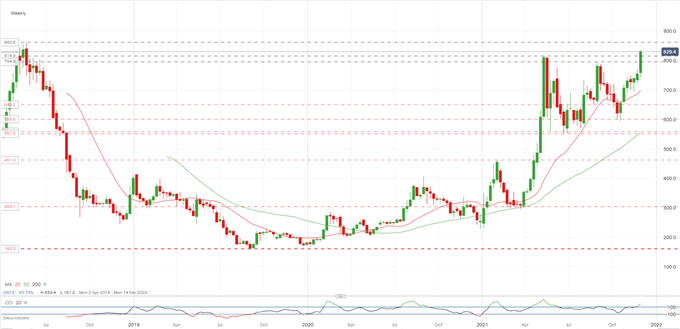
The weekly chart shows a bullish cup and handle formation also starting to break out adding to positive sentiment in the weeks ahead. While the depth of the cup may be too deep – a shallower cup is preferred – this set-up normally precedes a period of higher prices.
Ethereum/Bitcoin Spread (ETH/BTC) Weekly Price Chart – December 1, 2021
What is your view on the ETH/BTC spread – bullish or bearish?? You can let us know via the form at the end of this piece or you can contact the author via Twitter @nickcawley1.
Be the first to comment