

Graphic Credit: Aleph Blog, natch…. same for the rest of the graphs here. Data is from the Federal Reserve and Jeremy Siegel
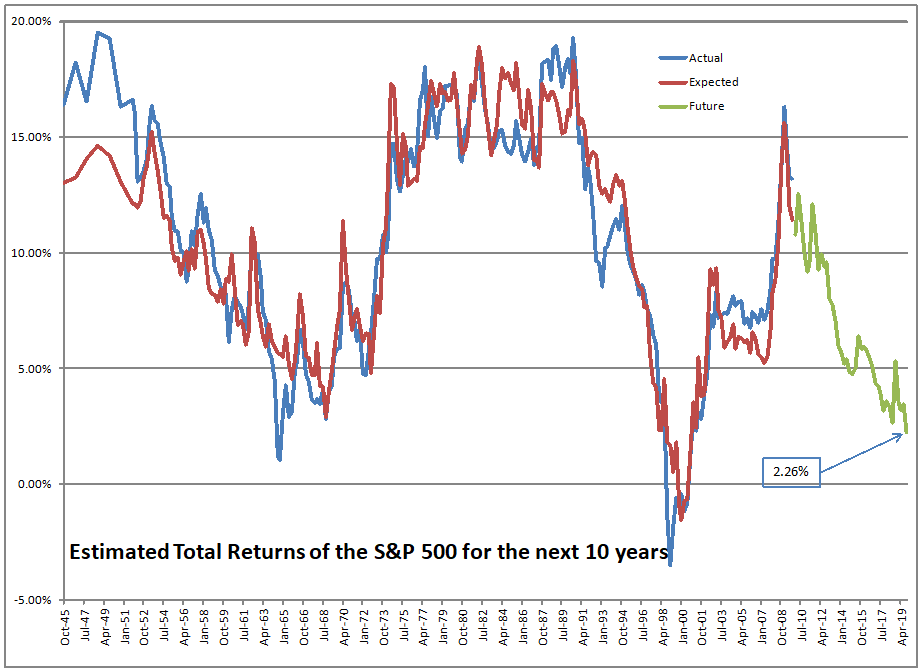
Here’s my once-a-quarter update. If you owned the S&P 500 at the end of 2019, it was priced to give you a return of 2.26%/year over the next 10 years. That said, the market has changed a lot in the last 2.6 months – as of the close of business on March 18th, the market was priced to give you a return of 7.28%/year over the next 10 years. Finally, you have a chance to double your money over the next ten years, while a 10-year Treasury would give you 1.5%/year over the same horizon. To match the expected returns on stocks at this point in bonds, you would have to invest in junk debt, but junk typically doesn’t go longer than 10 years, and who knows what the defaults will be over the next two years?
Now, actual returns from similar levels have varied quite a bit in the past, so don’t take the 7.28%/year as a guarantee. With a 2%/year dividend yield, price returns have ranged from -0.95%/year to 6.89%/year, with most scenarios being near the high end.
At the end of 2019, valuations were higher than any other time in the past 75 years, excluding late 1964 and the dot-com bubble. It is not surprising there was a bear market coming. Because “there was no alternative” to stocks, though, it took an odd external event or two (COVID-19, oil price war) to kick bullish investors into bear mode. This was not a supply and demand issue in the primary markets. This was a shift in estimates of investors regarding the short-term effects of the two problems extended to a much longer time horizon.
Two more graphs, and then some commentary on portfolio management. First, the graph on the channel the market travels in, subject to normal conditions:
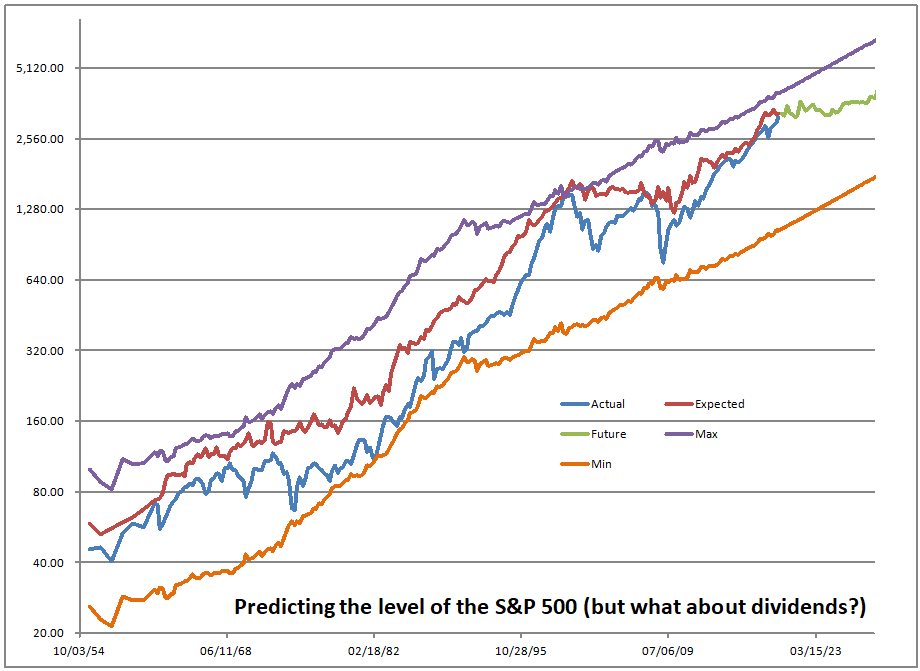
This graph shows how the model estimates the price level of the S&P 500. It is most accurate at the present, because the model works off of total returns, not just the price level. The gap between the red and blue lines is mostly the effect of the present value of future dividends, which are reflected in the red line and not the blue.
The maximum and minimum lines have hindsight bias baked into them, but it gives you a visual idea of how high the market was at any given point in time – note the logarithmic scale though. If you are in the middle using linear distance, you are a little closer to the bottom than the top.
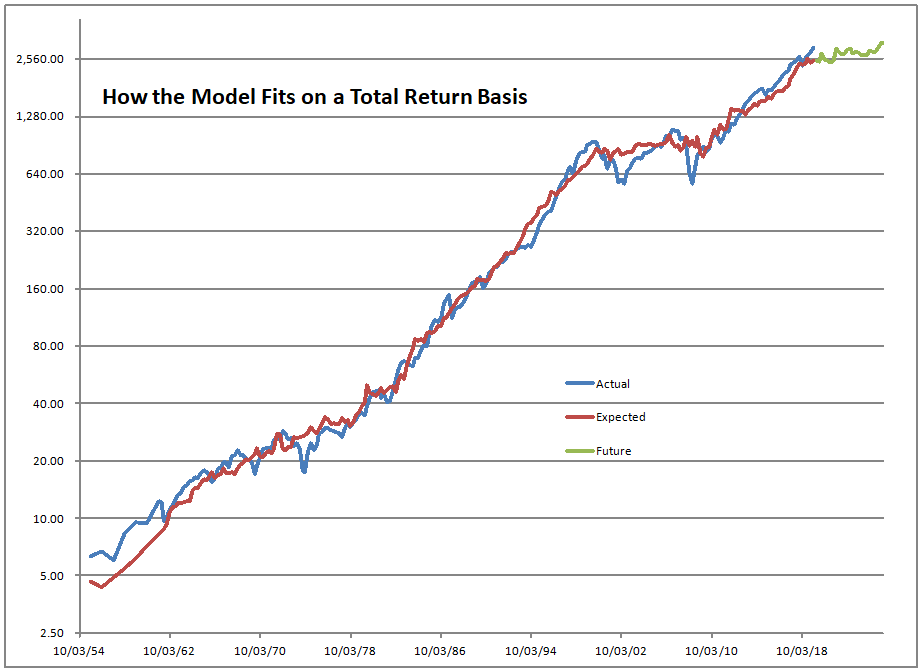
And finally, that’s how well the model fits on a total return basis. Aside from the early years, it’s pretty tight. The regression explains more than 88% of the total variation in returns.
Implications for Asset Allocation
If you haven’t read it, take a look at my article from yesterday. I am usually pretty disciplined about rebalancing, but this bear market I waited a while and created two schedules for my stock and balanced fund products to adjust my cash and bond versus stock levels. I decided that I would bring my cash levels to normal if the market is priced to give its historical return, i.e., 9.5%/year over the next ten years. That would be around 2100 on the S&P 500. Then, I would go to maximum stock when the market is offering a 16%/year return, which is around 1300 on the S&P 500.
The trouble is this is psychologically tough to do when the market is falling rapidly. I am doing it, but when I rebalance at the end of the day, I sometimes wonder if I am throwing my money into the void. Remember, I am the largest investor in my strategies, and if my ideas don’t work, I will lose clients, so this is not an idle matter for me. I’m doing my best, though my call on the market was better during the first decade of the 2000s, not the second decade.
In the process, I bought back Reinsurance Group of America Inc. (RGA) at prices at which I love to have it, and have been reinvesting in many of the companies I own at some really nice levels… but for now, things keep going down. That’s the challenge.
In summary, we have better levels to invest at today. Stocks offer better returns, but aren’t screaming cheap. Some stocks look dirt cheap. Most people are scared at the speed of the recent fall. I view my job as always doing my best for clients, and that means buying as the market falls. I will keep doing that, but I have already lost a few clients as a result of doing that, even though I tell them in advance that I will do that. So, I will soldier on and do my best.
Full disclosure: Long RGA for clients and me.
Editor’s Note: The summary bullets for this article were chosen by Seeking Alpha editors.
Be the first to comment