

NicoElNino
Investment Thesis
On the surface, the WisdomTree U.S. LargeCap ETF (NYSEARCA:EPS) is a solid alternative to the more established SPDR S&P 500 Trust ETF (SPY). Its use of earnings instead of market capitalization to weight the 500 largest U.S. companies sounds reasonable and results in a more fundamentally-sound portfolio. While I’ve confirmed this through fundamental analysis of both funds, readers should know this strategy has yet to succeed. EPS regularly overweights underperforming stocks within each sector. Moreover, EPS often underweights the best-performing sectors, which explains why it’s lagged by 24% since March 2007. These are the reasons why I don’t recommend owning EPS, and I look forward to taking you through the data in more detail now.
ETF Overview
Strategy, Top Holdings, and Sector Exposures
The WisdomTree U.S. LargeCap Index measures the performance of the 500 largest U.S. companies ranked by market capitalization with positive cumulative earnings over the most recent four fiscal quarters. However, instead of weighting by market capitalization like the S&P 500 Index, this Index weights by earnings, with annual reconstitutions in December.
The companies most impacted by this methodology are Microsoft (MSFT) and Tesla (TSLA), which have reduced weights of 1.77% and 1.26%. Meta Platforms (META) and JPMorgan Chase (JPM) received a boost of 1.61% and 1.10%, and all other changes are within 1%. In addition, about 80 companies are in EPS and not SPY, but their combined weights are less than 3% and are not material. Let’s take a look at the fund’s top ten holdings next.
WisdomTree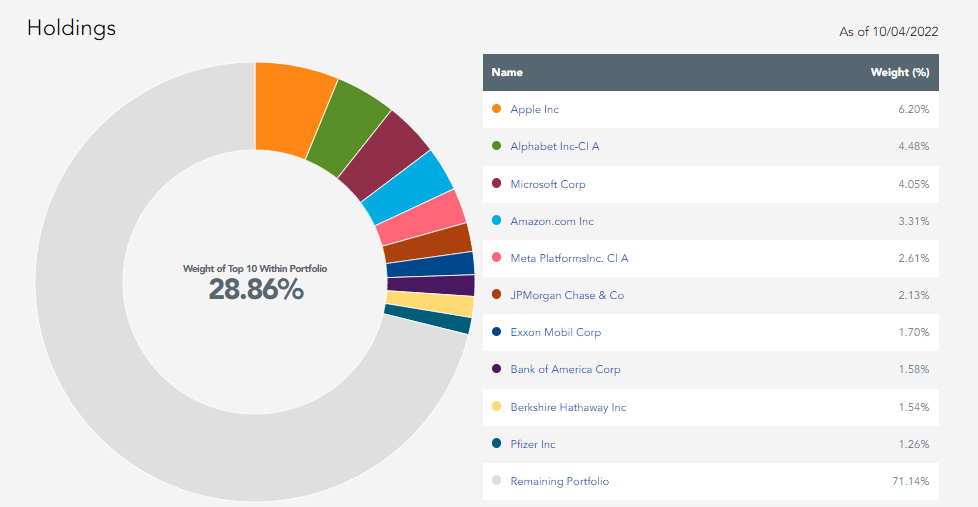
Apple (AAPL), Alphabet (GOOGL), Microsoft, and Amazon (AMZN) are the ETF’s top holdings, similar to SPY. Meta Platforms is the fifth-largest holding in EPS compared to #12 in SPY, and Bank of America (BAC) climbed up to #8 compared to #22 in SPY. There are a few other minor changes, but otherwise, it’s clear that EPS is WisdomTree’s alternative to an S&P 500 Index ETF. Let’s look at the sector exposures next.
WisdomTree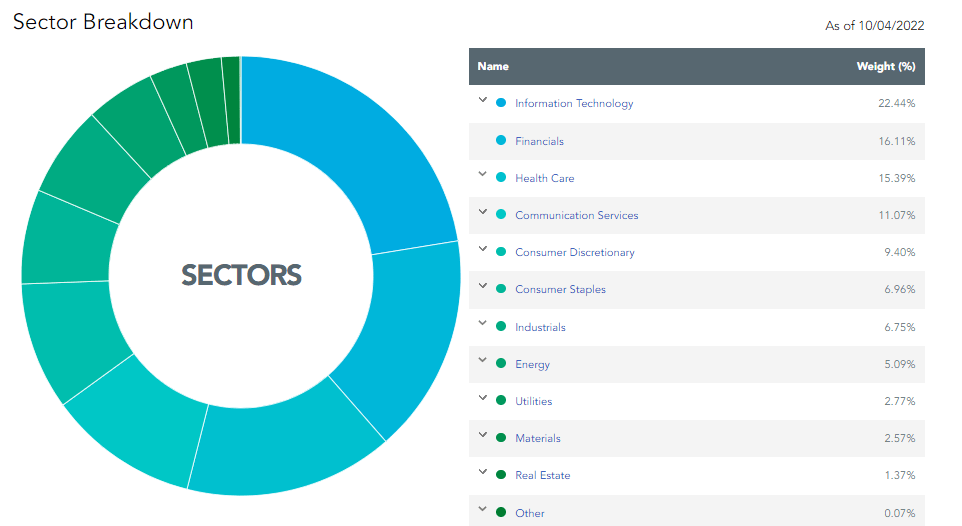
Technology is the most significant exposure area at 22.44%, but it’s 4.01% less than SPY’s 26.55%. EPS underweights Consumer Discretionary by 2.10% but overweights Financials (5.02%) and Communication Services (3.01%).
Performance Analysis
Since March 2007, EPS has gained an annualized 8.15% compared to 8.62% for SPY. It’s a fair apples-to-apples comparison, given their similarities in expense ratios (0.08% vs. 0.09%), and it is our first clue that the strategy hasn’t worked to date. That doesn’t mean it won’t work going forward, but it just means we have to keep searching for reasons to invest.
Portfolio Visualizer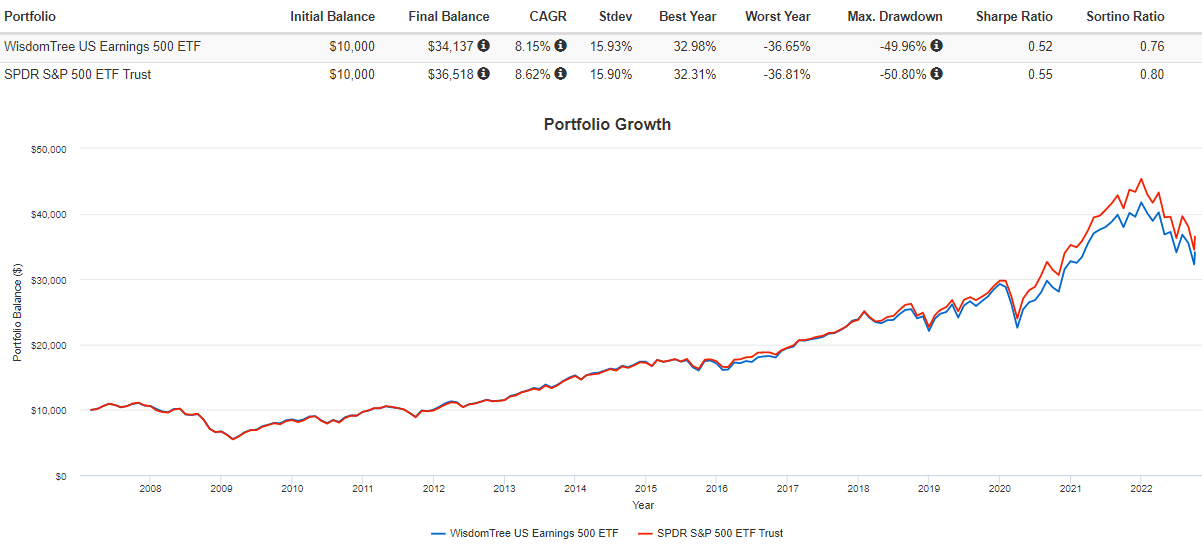
Portfolio Visualizer also offers the following rolling return figures for each ETF, indicating that, on average, SPY was the better choice for 1Y, 3Y, 5Y, 7Y, and 10Y holding periods. There wasn’t any downside protection, either. The fund’s one-year loss of 43.47% was just as bad as SPY’s 43.44%.
Portfolio Visualizer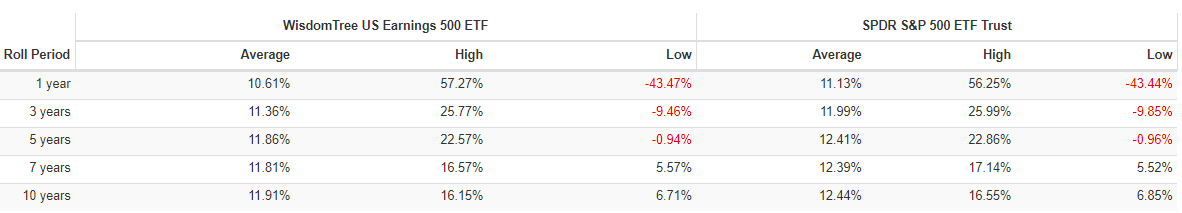
Finally, we can see that EPS had the odd period of outperformance on the three-year rolling returns chart, but it hasn’t happened for several years. For the three years ending September 30, 2022, EPS is up 6.61% compared to 8.11% for SPY. So far, I’ve not come across a reason for owning EPS.
Portfolio Visualizer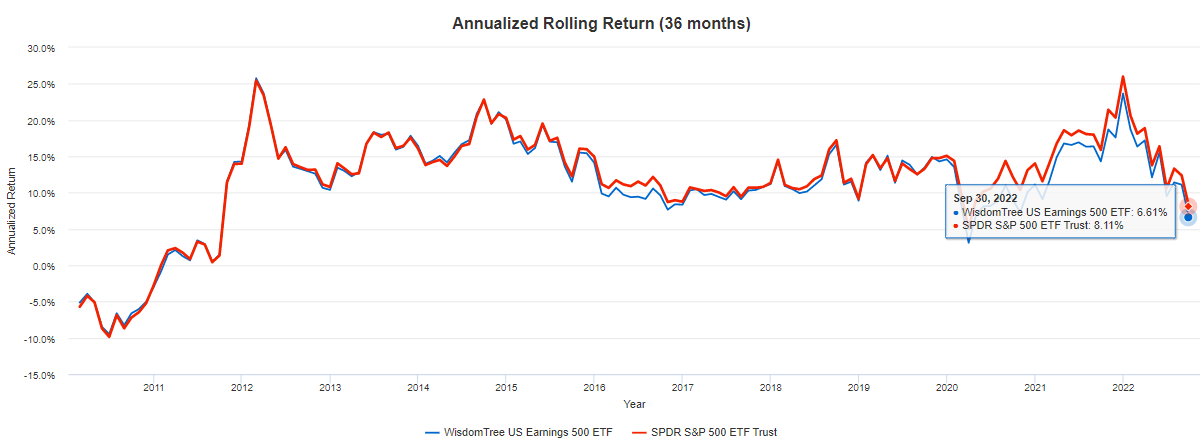
Performance Attribution Analysis
Since Inception
WisdomTree offers an excellent Performance Attribution Tool that allows analysts to identify the sources of a fund’s returns. Using the S&P 500 Index as the benchmark, we see an annualized -0.28% performance difference from February 2007 through August 2022. The allocation effect, which measures excess returns due to different weightings among sectors, was -0.31%, suggesting that most of the underperformance was because the Index invested in the “wrong” sectors. The graph below highlights Financials as having the most negative impact. In other words, the typical overweighting of this sector (17.98% vs. 13.62%) was the primary source of negative returns. It makes sense, given this period included the Great Financial Crisis.
WisdomTree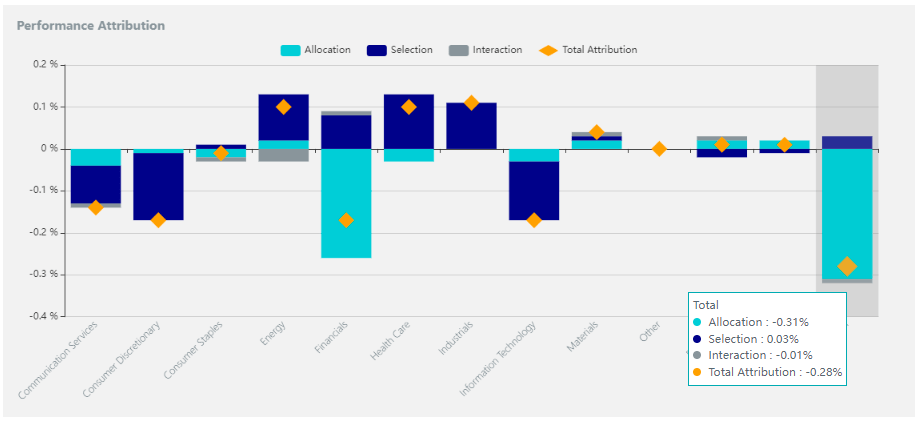
The net selection effect was 0.03%, meaning that the Index’s selections outperformed their sector peers by this amount. It’s effectively a wash and suggests that the strategy of weighting constituents by earnings resulted in little, if any, benefit to investors.
10-Year
We can use the ten-year performance attribution results to infer how EPS may perform in a mostly bullish market. The below table shows the data behind the graphs like the one above, and again, we see another negative allocation effect of -0.14% through August 2022.
WisdomTree
However, the primary driver of negative returns was the selection of underperforming stocks relative to sector peers, particularly among Consumer Discretionary (-0.20%) and Technology (-0.22%) stocks. Tesla is responsible for a good chunk of that, given how it’s outperformed the Consumer Discretionary Select Sector SPDR ETF (XLY) by an annualized 10.37% since it became part of the S&P 500 Index in December 2020. Other stocks that EPS routinely underweights, including Microsoft and NVIDIA (NVDA), have stellar ten-year charts that trounce XLK. Investors must ask themselves whether these patterns are likely to persist. I prefer not to get involved with more speculative stocks like Tesla, but I think Microsoft and NVIDIA are better long-term buys.
5-Year
The five-year performance attribution analysis is similar to the ten-year but more intense. We see that the selection effect totaled -0.80% and that WisdomTree’s Index also selected the wrong sectors, costing investors 0.53% per year. Perhaps it’s most alarming that the only sector with a favorable allocation and selection effect is Health Care. Again, this doesn’t inspire much confidence in the strategy.
WisdomTree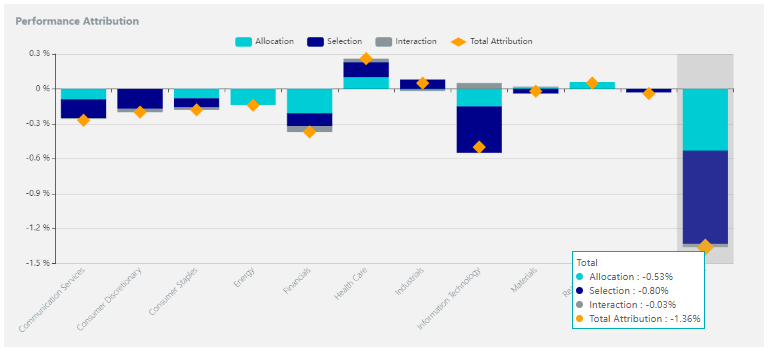
3-Year
The three-year performance attribution chart shows a total attribution of 1.17%. Most of this was due to poor sector allocations, costing investors 0.80% per year. However, the selection effect was also a detractor at -0.31%. I think this analysis is the fairest, as it covers the Q1 2020 crash, recovery, and current decline of high P/E growth stocks.
WisdomTree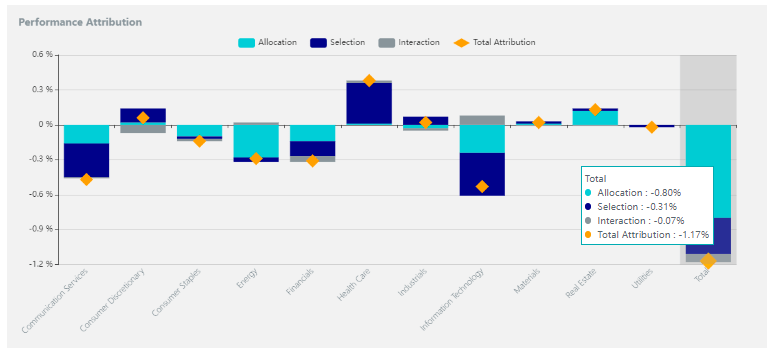
Still, you can see that the main value-add was the superior selection of Health Care stocks. Currently, that suggests stocks like Pfizer (PFE) and Gilead Sciences (GILD) will outperform UnitedHealth Group (UNH) and Eli Lilly (LLY). The two former stocks have much cheaper forward P/E ratios (6.84 and 9.86 vs. 23.94 and 41.53), which is what happens when weighting by earnings rather than market capitalization.
1-Year
Finally, looking at the one-year performance attribution chart may be helpful for those who believe the trends this year will continue for the foreseeable future. Here, we see a total attribution of 0.30%, which corresponds almost perfectly to the returns of EPS and SPY during this same period.
WisdomTree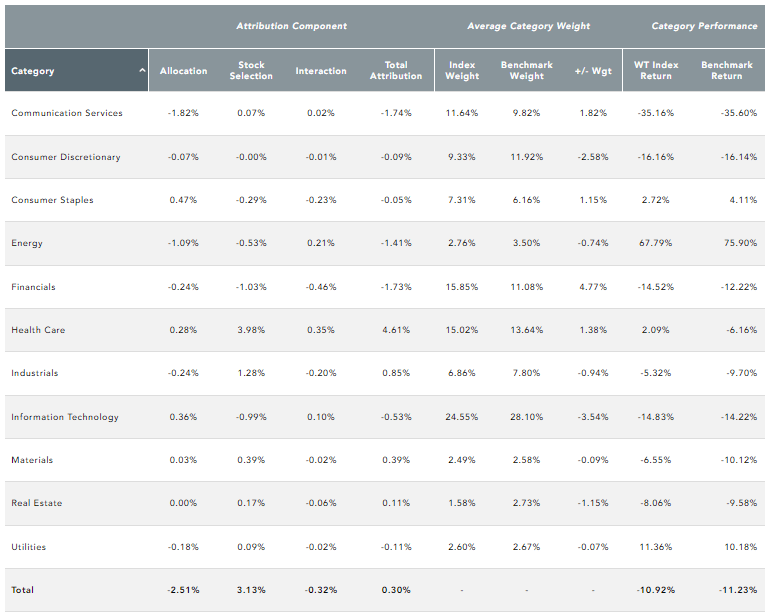
Again, the selection of Health Care stocks drove these returns, as indicated by a massive 3.98% stock selection effect. Unfortunately, most other selection effects were negative, and the Index’s underweighting of the Energy sector cost investors another 1.09%. It’s a reminder that EPS won’t provide much inflation protection when needed and that earnings-based investing tends to work best in the Health Care sector among large-cap stocks.
Fundamental Analysis
Finally, I want to close with a fundamental snapshot of the ETF’s top 25 industries, which total 68.98% of the ETF. It’s about the same as SPY (67.13%), and EPS has a similar five-year beta of 1.01, meaning it’s about as volatile as the broader market.
The Sunday Investor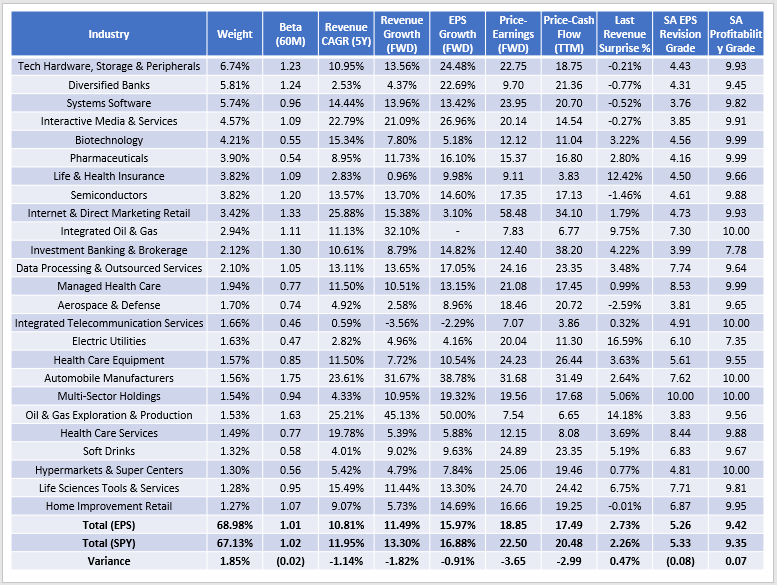
Instead, the main differences are lower estimated sales and earnings growth (11.49% vs. 13.30% and 15.97% vs. 16.88%). In exchange, investors receive a portfolio that trades 3.65 points cheaper on forward earnings and 2.99 points cheaper on trailing cash flow. These results suggest it might have a slight edge in a flat or declining market but probably not much of one in a rebound. I’m disappointed EPS hasn’t outperformed SPY by more YTD, given the market’s preference for fundamentals. Meanwhile, other fundamentals-based ETFs like the Franklin LibertyQ U.S. Equity ETF (FLQL) have done better by combining value, quality, and momentum factors. It may be a superior short-term solution if you believe fundamentals will overpower speculation.
Seeking Alpha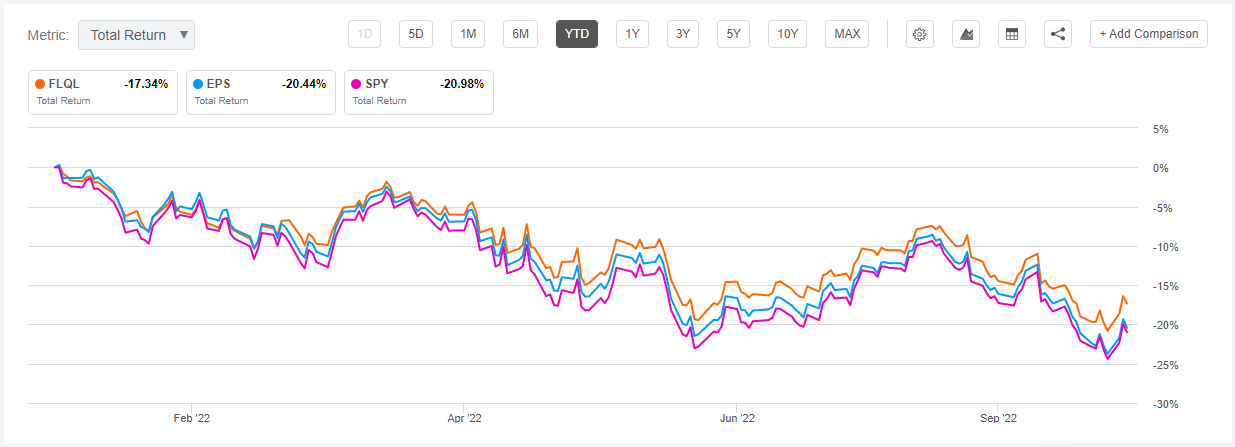
Investment Thesis
I began this article by evaluating EPS based on its historical performance vs. SPY and determined that it generally underperformed no matter your holding period. I then used WisdomTree’s Performance Attribution Tool to determine why EPS underperformed. By examining the 1Y, 3Y, 5Y, 10Y, and Since Inception charts, it became clear that EPS often had negative allocation and selection effects. It’s a bad combination that indicates weighting large-cap stocks by earnings is ineffective. The one exception was Health Care, but this positive was not enough to offset the many negatives I found.
My fundamental analysis determined that EPS currently has a slightly lower growth profile, with investors compensated via lower price-earnings and price-cash flow ratios. This setup may be attractive to more defensive investors, but history suggests it won’t amount to much. Therefore, I don’t recommend investors buy EPS, and I look forward to discussing this further in the comments section below.
Be the first to comment