

ehrlif/iStock Editorial via Getty Images
Wide Moat Assets
Enbridge (NYSE:ENB) is a North American midstream behemoth. With a market cap around $83 billion US, it is easily the largest company in the Oil and Gas Storage and Transportation industry. The company is best known for its liquids pipelines which bring Canadian crude to the US Midwest and Gulf Coast. Enbridge also has gas pipelines covering this same territory plus the Northeastern US and Canadian Pacific coast. In addition, Enbridge has liquids and LNG export terminals and even a few offshore wind assets in Europe. Finally, Enbridge operates a gas distribution utility that serves most of southern Ontario.
Enbridge Q1 2022 Earnings Presentation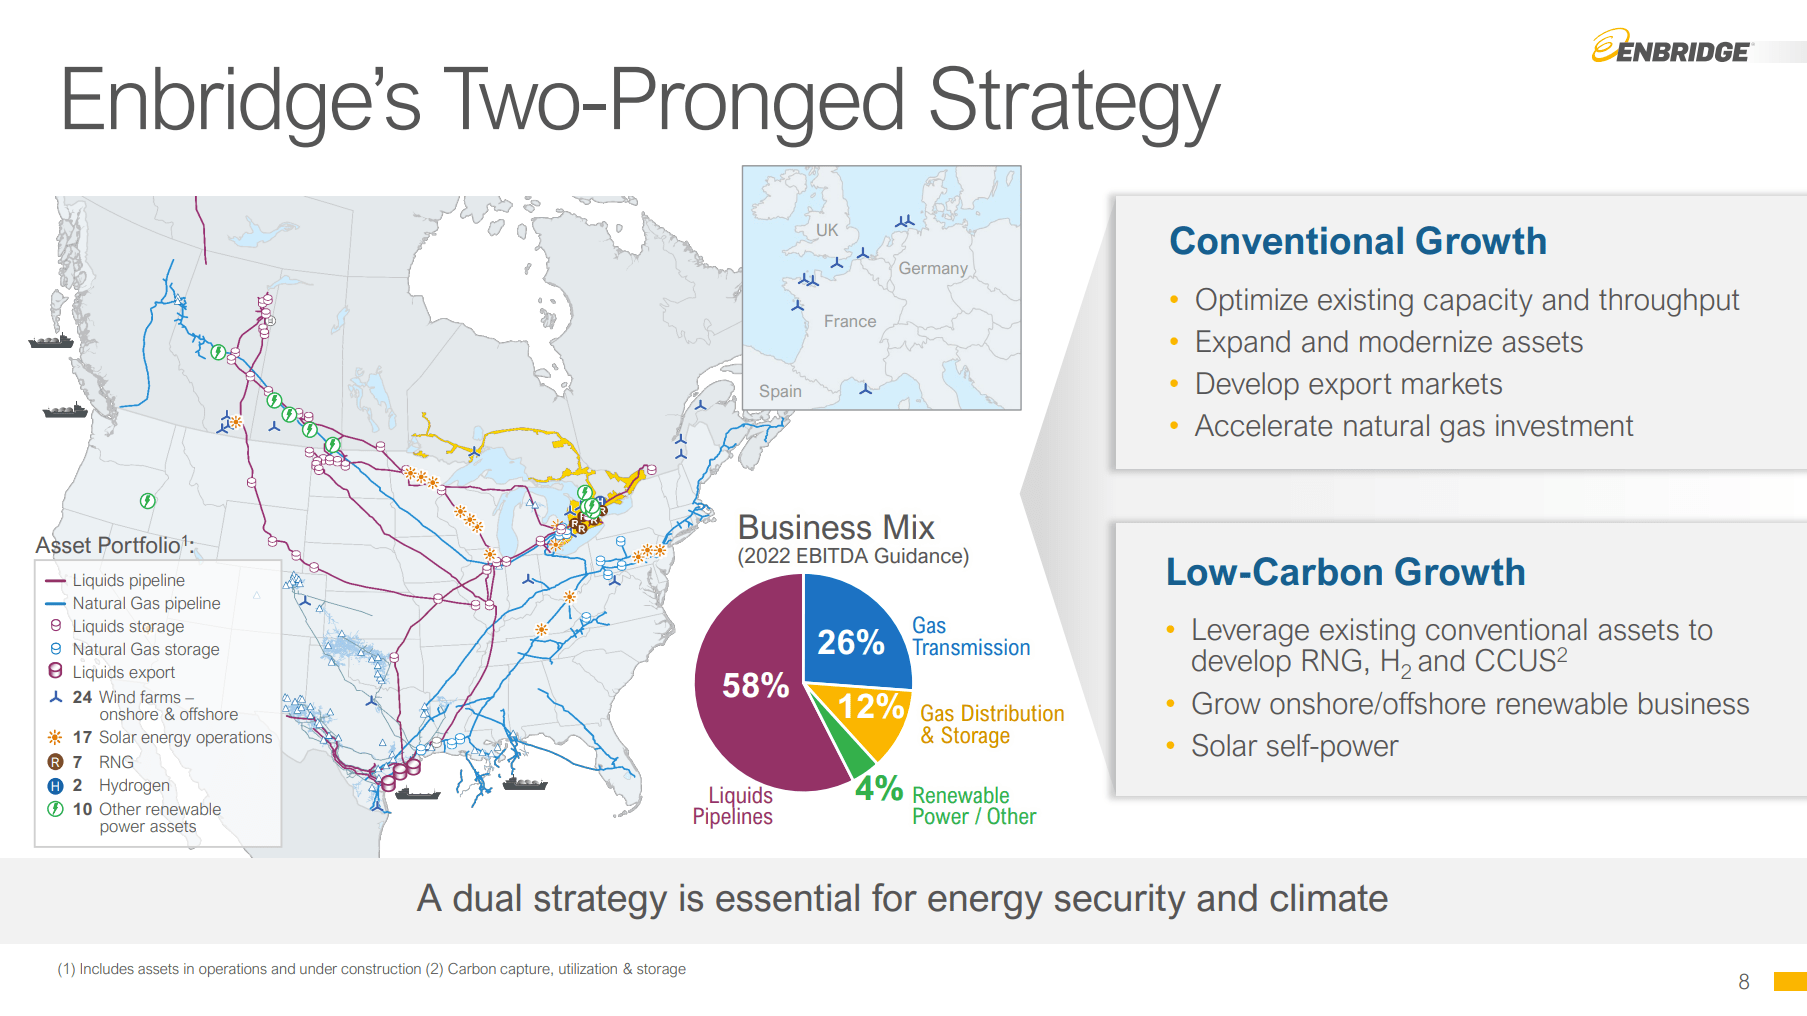
The liquids pipeline system has a wide competitive moat with captive customers and high barriers to entry. Many US Midwest refineries are designed to run Canadian crude including Flint Hills Resources in Minnesota (privately owned by Koch Industries), Exxon Mobil (XOM) Joliet Refinery in Illinois, (BP) Whiting Refinery in Indiana, and BP-Husky (CVE) Refinery in Ohio. The Enbridge system is the only economic way for these refineries to get most of their crude, and the pipelines to these destinations nearly always run full. Enbridge’s routes to the Gulf Coast have a bit more competition, but the US government is unintentionally helping the company by blocking TC Energy’s (TRP) Keystone XL pipeline. Enbridge has a regulatory advantage over new entrants with the possibility of expanding capacity along existing routes. Still, even that carries some risk as we have seen with hostile governors in Minnesota and Michigan trying to block modernization of Line 3 and Line 5.
On the gas transmission side, Enbridge is positioned to connect to LNG terminals on the US Gulf Coast and in British Columbia. The company also connects production in the Appalachian region to the Northeastern US. On the distribution side, Enbridge operates the Dawn Hub, a major storage and trading hub for natural gas in Ontario and serves as the gas utility for most of southern Ontario.
With these wide moat assets comes a rich valuation compared to peers. While the dividend appears safe, it is less covered by free cash flow than some peers. In a volatile environment for energy stocks and interest rates, Enbridge has two resettable rate preferred issues that may be better for income investors.
Valuation
I like to use Seeking Alpha’s Peer Comparison page as a starting point for valuing stocks. The page usually defaults to the five peers within the same industry that are closest in market cap. Users can replace these with other stocks if they wish. In this case, I kept the next four largest companies: Kinder Morgan (KMI), TC Energy (TRP), Enterprise Products Partners (EPD), and Williams Companies (WMB). I added in Western Midstream Partners (WES) even though it is smaller and less diversified in order to include another of my holdings in the table. I have also written several articles on WES.
Enbridge is at the high end of the range on P/E. It is nearly twice as expensive on that basis as the K-1 partnerships EPS and WES. Enbridge is also the most expensive as measured by EV/EBITDA and Price/Operating Cash Flow.
Seeking Alpha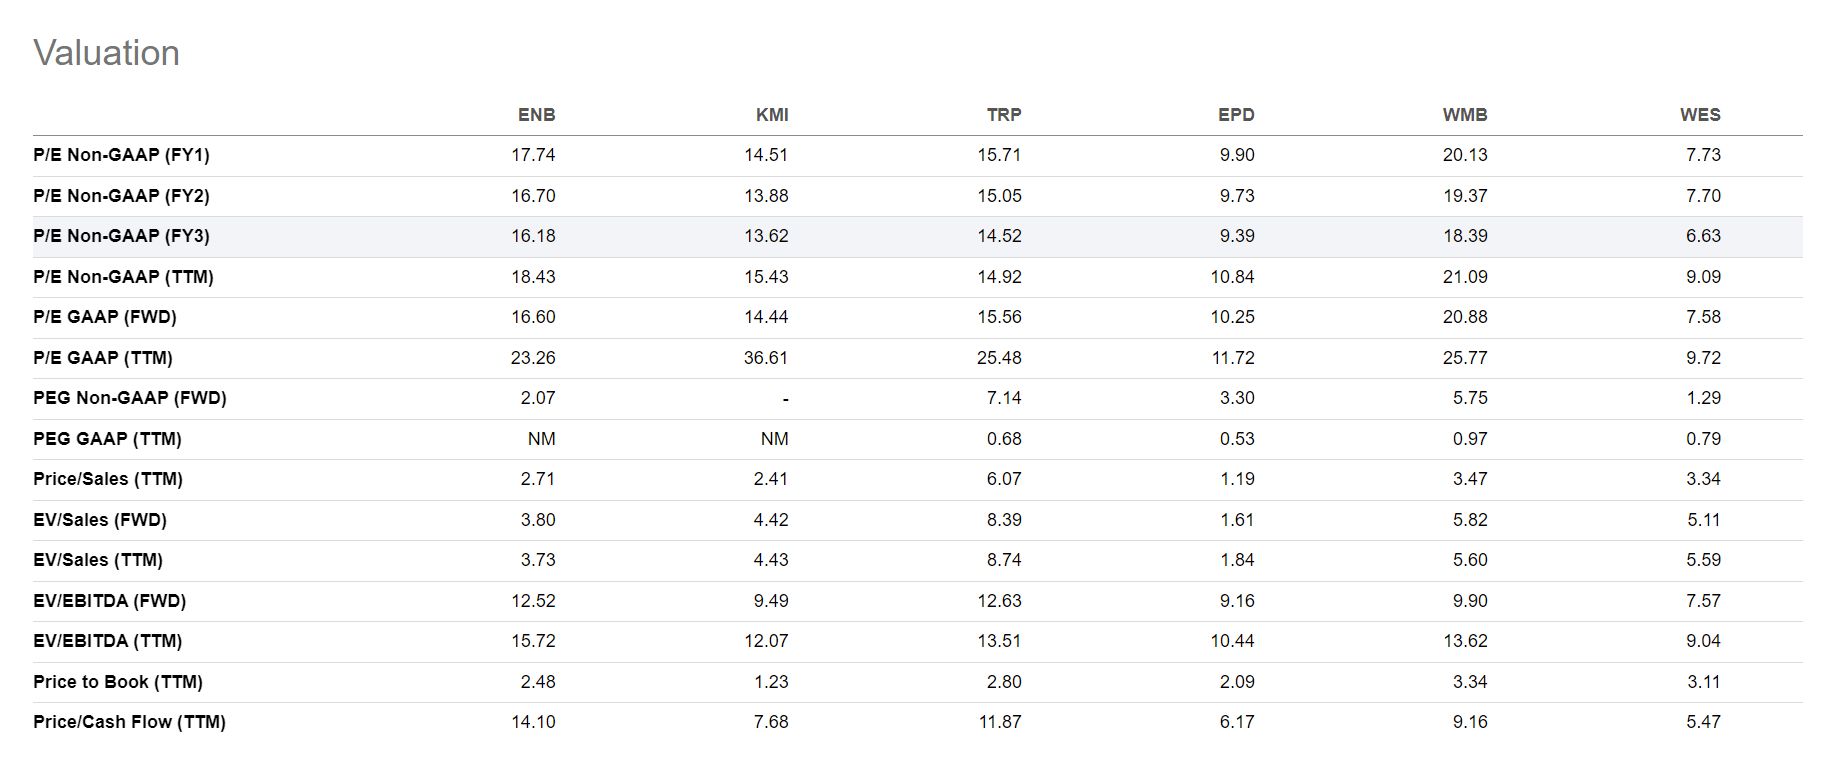
Premium valuations can be OK when the company has high profitability metrics, but in Enbridge’s case it is second lowest only to KMI when it comes to Return on Equity and Return on Total Capital. It is also near the bottom on various margin metrics.
Seeking Alpha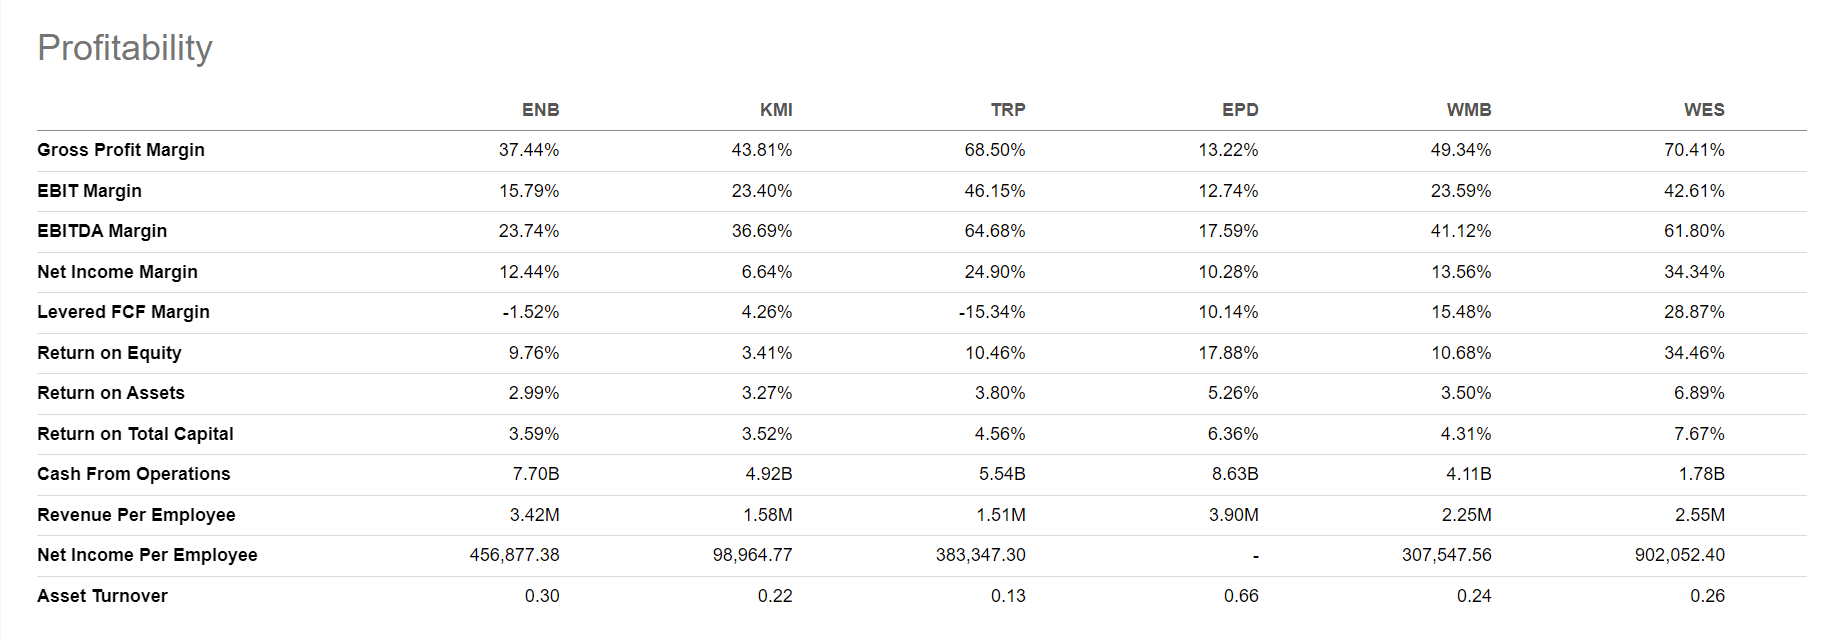
The entire peer group features attractive dividend yields, so the 6.4% paid by Enbridge is not a reason by itself to own the common stock. The payout ratio of 122.5% is the highest in the group and may be considered a red flag for some. Others justify this by noting that Distributable Cash Flow or DCF is a more relevant metric. DCF is operating cash flow minus maintenance capex, and Enbridge’s dividend is covered on that basis. Note that expansion capex is not subtracted when calculating DCF. This implies that the market will be willing to fund expansion projects through new debt or equity issuance. In Enbridge’s case, this can be a reasonable assumption as the returns on new projects should be predictable with fixed rates per barrel of throughput and minimum volume commitments. Enbridge would not fund these projects if the returns would not cover the financing costs. Nevertheless, other pipeline companies like KMI and WES got into trouble in the past by relying on DCF and now pay out much safer dividends by focusing on true free cash flow after all capex.
Seeking Alpha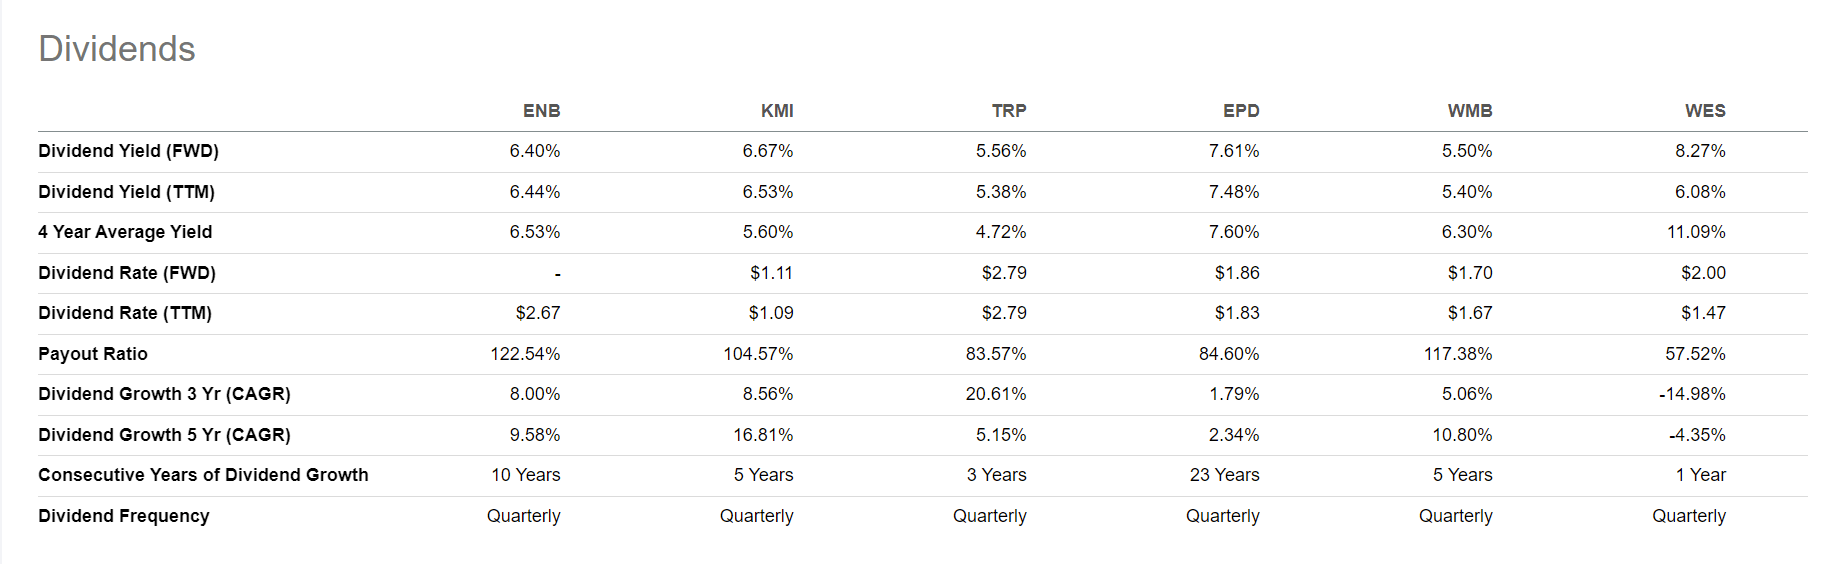
Finally, looking at debt, Enbridge has the highest Net Debt/EBITDA at 6.4. It is middle of the pack on interest coverage at 2.9. Neither of these are great numbers on an absolute basis, but it is worth noting that the company’s debt is investment grade, rated BBB+ by S&P and Baa1 by Moody’s. It seems the agencies agree that the predictable operating cash flows allows the company to safely carry a higher debt load.
| ENB | KMI | TRP | EPD | WMB | WES | |
| Net Debt | $ 60.84 | $ 32.00 | $ 42.01 | $ 29.69 | $ 21.82 | $ 6.66 |
| EBITDA | $ 9.50 | $ 5.76 | $ 6.99 | $ 7.86 | $ 4.46 | $ 1.83 |
| ND/EBITDA | 6.4 | 5.6 | 6.0 | 3.8 | 4.9 | 3.6 |
| Operating Income | $ 6.32 | $ 3.67 | $ 4.99 | $ 5.69 | $ 2.56 | $ 1.26 |
| Interest Expense | $ 2.17 | $ 1.45 | $ 1.54 | $ 1.27 | $ 1.12 | $ 0.36 |
| Interest Coverage | 2.9 | 2.5 | 3.2 | 4.5 | 2.3 | 3.5 |
Data Source: Seeking Alpha
The bottom line is that Enbridge is not cheap. The dividend looks safe, and the company plans to grow DCF by 5%-7% per year through 2024. Still, the volatile interest rate environment and potential recession could have a negative impact on the share price that would outweigh the benefit of dividend growth. Enbridge stock returns were flat for 8 of the last 10 years even with dividends included and have only gone on a run since 2020.
Seeking Alpha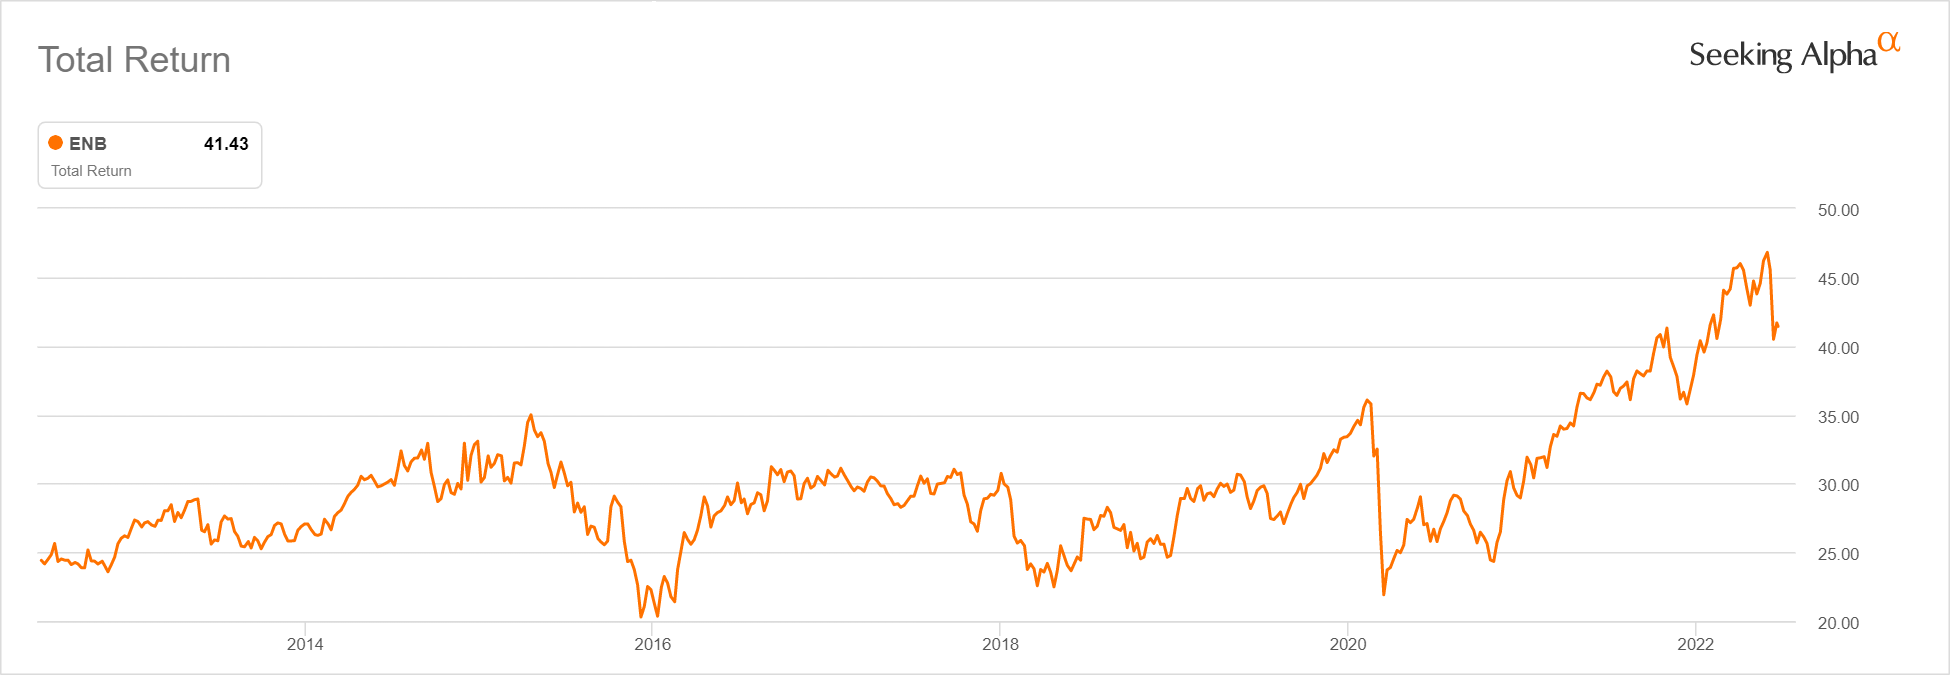
Until this environment improves over the next few years, Enbridge has two series of preferred shares that look like a better buy.
Check Out These Preferreds
Enbridge has an eye-popping 21 different series of preferred shares which are listed on its website with links to each prospectus. The good news is that collectively, they still do not make up a huge part of the company’s capitalization with $5.6 billion on the balance sheet compared to $43.8 billion common equity. Preferred dividends last year were just $0.3 billion compared to income of $5 billion. (all values USD)
The two I want to highlight here are Series 1 (OTC:EBBGF) in the US and (ENB.PR.V) in Canada, and Series 5 (OTCPK:EBGEF) in the US and (ENB.PF.V) in Canada. These two preferreds are excellent choices for US-based income investors at this time for several reasons.
They are denominated in and pay dividends in US dollars. You know exactly how much you are getting each quarter unlike the common dividend which is converted from Canadian dollars.
The rate resets every 5 years based on the 5-year US Treasury note. EBBGF pays a coupon of 3.14% over the 5-year note and last reset on 6/1/2018. That means the coupon has been 5.95% since then, and the current yield is 6.54% based on the current price of $22.75. EBGEF pays a coupon of 2.82% over the 5-year note and last reset on 3/1/2019. That means the coupon has been 5.38% since then, and the current yield is 5.72% based on the current price of $23.48.
The reset feature allows these preferreds to hold or increase their value when interest rates are going higher, unlike most preferreds. The 5-year Treasury is now yielding 3.38%. If it is still trading there on the next reset dates (6/1/2023 for EBBGEF and 3/1/2024 for EBGEF) investors will see a dividend increase as long as Enbridge does not elect to redeem the shares. If they do, reinvestment risk will be low since the higher rate environment should create attractive bargains in other bonds and preferred shares in the market. Also, the shares would be redeemed at par value of $25 US, creating a capital gain of 9.8% for EBBGF and 6.5% for EBGEF based on current prices.
While the common stock has more potential upside than this, it also has more downside in the event the down cycle in the energy markets starts before the next reset dates. Interestingly, since the last reset date for EBGEF, total return performance for both preferreds has been in line with the common.
Seeking Alpha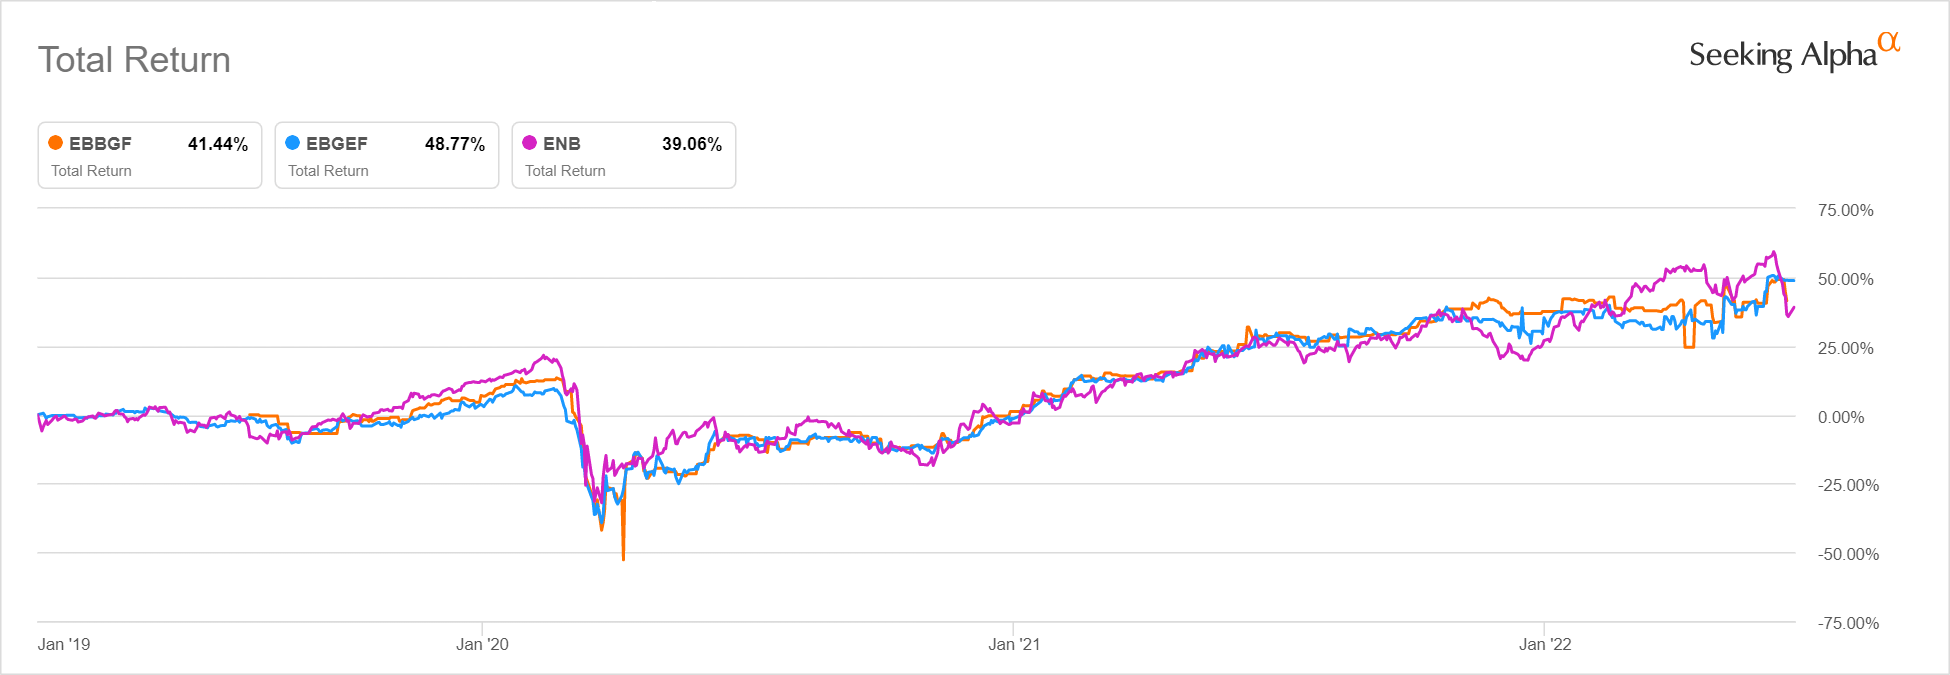
The risk with the preferreds comes if interest rates are significantly lower at the next reset dates. A 5-year rate below 2.81% on 6/1/2023 would mean a dividend cut for EBBGF, and a 5-year rate below 2.56% on 3/1/2024 would mean a dividend cut for EBGEF. If the rates reset lower, Enbridge would be less likely to redeem the shares and the prices could fall.
These shares are rather illiquid and trade at low volume in the US. As I write this near the end of the trading day, 1100 shares of EBBGF and 1300 shares of EBGEF have traded so far today (6/22/2022). Make sure to use limit orders and consider bidding for no more than a few hundred shares at a time when starting a new position.
Like all Enbridge securities, there is no K-1 to deal with. While the dividends are marked as qualified when paid, my broker in the past has reclassified them as non-qualified when issuing my 1099 at the end of the year. I recommend consulting your own broker and tax advisor if this happens to you.
Conclusion
Enbridge is a huge midstream company with an attractive set of assets possessing a wide moat vs. competitors. Still, the common stock of Enbridge looks fully valued compared to peers. While the common dividend is probably safe and yields 6.4%, volatility in interest rates or energy markets are a risk to the common share price. The Series 1 and Series 5 preferred shares have similar yields but less price risk in a high interest rate environment due to the 5-year reset feature. The fact they are denominated and pay dividends in US dollars also eliminates currency risk for US shareholders. These preferreds are a better choice for income investors at this time.
Be the first to comment