

Andres Victorero
Thesis: I’m With Cathie
A growing number of voices are forecasting a collapse in the rate of inflation over the next year or so, perhaps even into deflation territory.
Cathie Wood, the outspoken Chief Investment Officer of the ARK Innovation ETF (ARKK), has long been on the “eventual deflation” train, and she has recently reiterated those beliefs. But she’s also received some backup from the likes of Elon Musk and Jeffrey Gundlach, who both foresee a rapid swing of inflation to the downside in the coming year.
CNBC
If their thesis proves correct, it could provide not only relief but a huge boost to beleaguered long-term Treasury bonds, which now look cheap after a huge selloff this year.
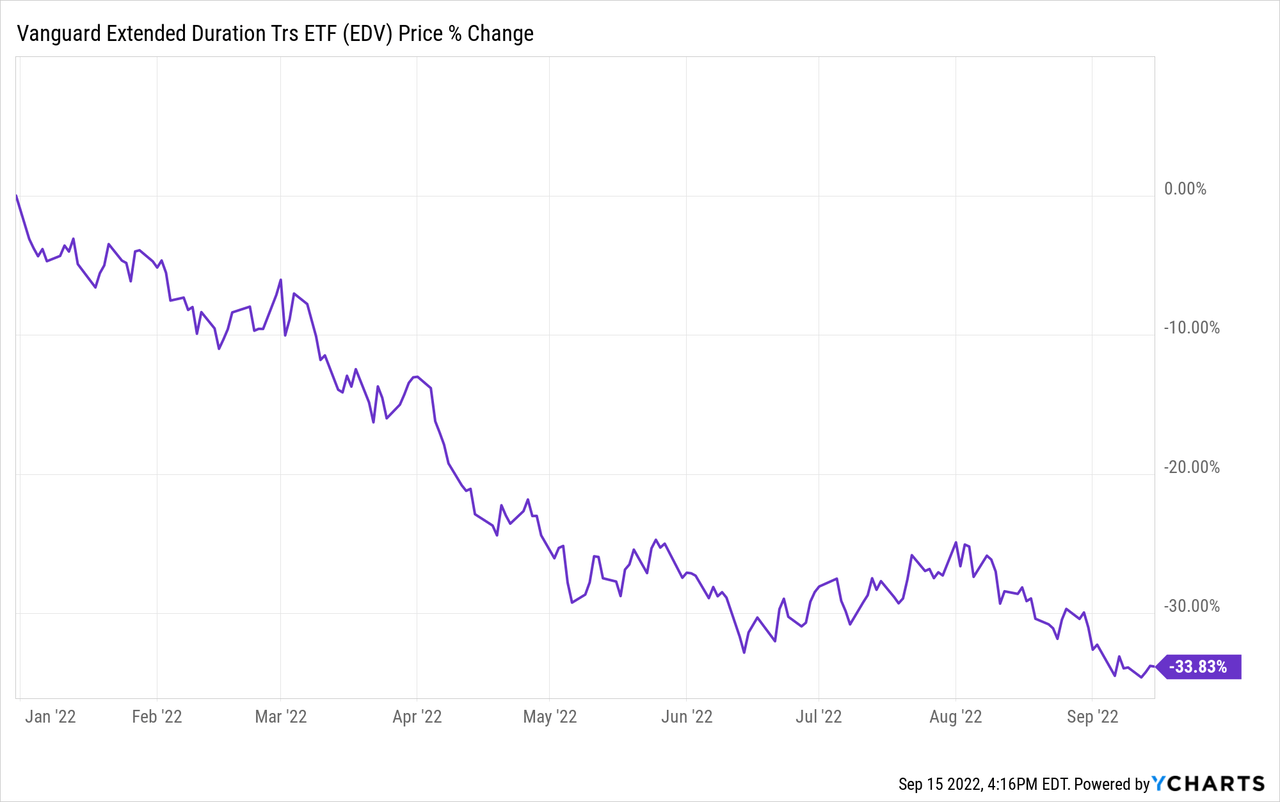
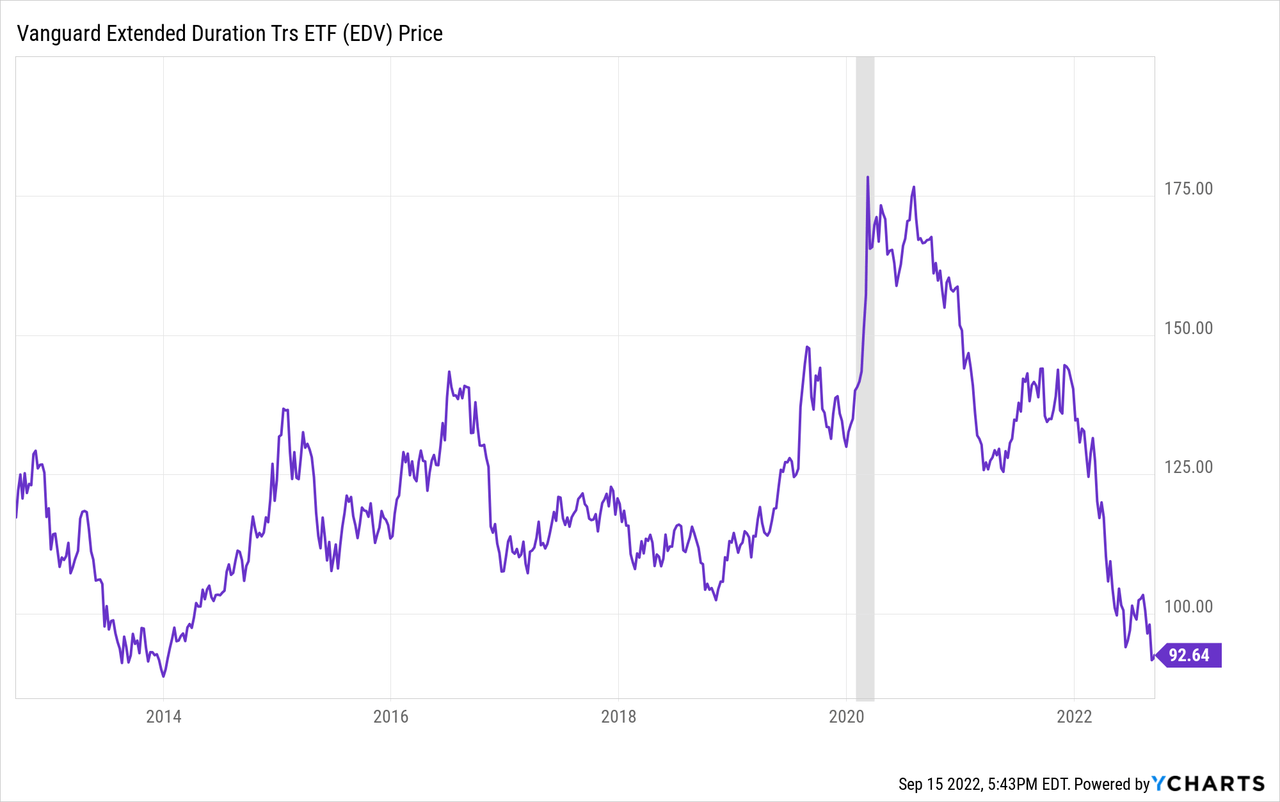
That’s where the Vanguard Extended Duration Treasury ETF (NYSEARCA:EDV) comes in. It is an extremely efficient way to own long-term Treasuries with an average effective duration of 24.8 years at a very low expense ratio of 0.06%.
Of course, I am cognizant of my recent track record of bullish calls on long-term Treasuries. Since my “Strong Buy” article on EDV in February 2022, the ETF has fallen nearly 27% in price. That was one of my worst investment calls, as some of the commenters in that last article gleefully reminded me multiple times.
But the point of that last article is that long-term Treasuries are an effective portfolio hedge against a certain economic scenario that has not yet manifested. Everyone loses money on insurance policies… until they are needed.
Take a look at the following table, showing the four basic economic scenarios based on what GDP growth and inflation are doing, along with business sectors that typically outperform during them. I would argue that the US economy has experienced all four scenarios in the last few years: first Recession in Spring 2020, then Disinflationary Growth from mid-2020 to roughly mid-2021, then Inflationary Growth from mid-2021 through Spring 2022, and now finally Stagflation starting sometime this summer.
| Economic Scenario | Characteristics | Outperformers |
| Inflationary Growth | Rising/High Inflation + GDP Growth | Residential, Self-Storage, Industrial, Farmland, Retail, Energy, mREITs |
| Disinflationary Growth | Falling/Low Inflation + GDP Growth | Net Lease, Ground Lease, Retail, Technology, Renewable Energy |
| Inflationary Contraction (Stagflation) | Rising/High Inflation + Low/Negative GDP Growth | Healthcare, Grocery-Anchored Retail, Farmland, Energy |
| Deflationary Contraction (Recession) | Falling/Low Inflation + Negative GDP Growth | Long-Term Treasuries, Cash, Utilities, Telecommunications, Grocery-Anchored Retail, Renewable Energy |
Some pundits see Stagflation persisting for a long time, but I disagree. I believe the Federal Reserve is in the process of definitively killing Stagflation and bringing about Recession.
As the Biblical author of Ecclesiastes attests, there is a season for everything. And long-term Treasuries’ season of outperformance is coming.
Recessions have an excellent track record of killing inflation and lowering interest rates as investors pull money out stocks and other risk assets and flood into the safe haven of Treasury bonds.
I’m with Cathie on inflation, which makes EDV a Strong Buy today.
But readers should note that this is just my opinion, not financial advice and certainly not a guarantee of anything. I offer only my reasoning, with which you can decide what to do with your own money.
With that, let’s start with the point about the Fed’s rate hiking killing Stagflation.
Fed Rate Hikes to Kill Inflation and Economic Growth
The Federal Reserve has been hiking rates aggressively this year, but it’s useful to note that the Fed Funds rate (purple line) typically sticks very close to the 2-year Treasury rate (orange line).
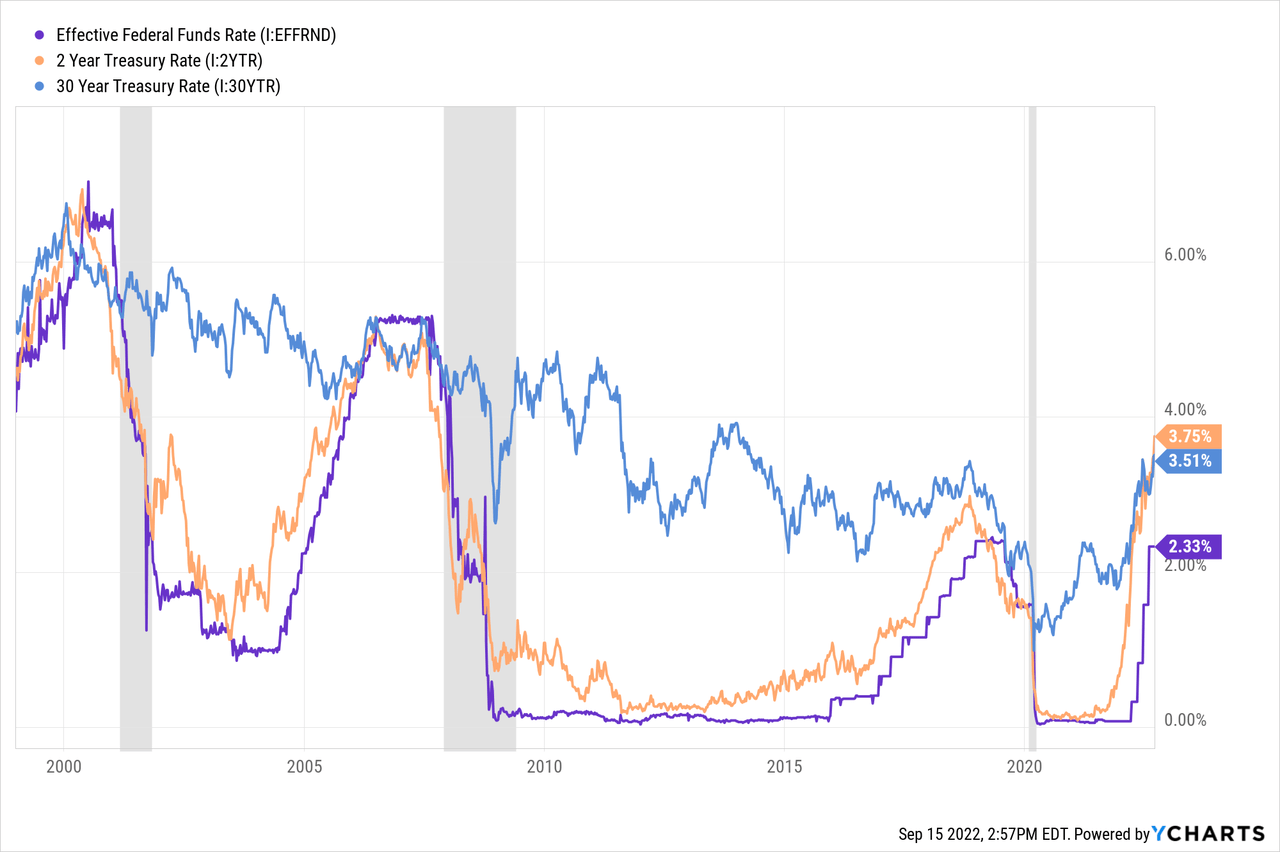
In the past three tightening cycles, the Fed Funds rate has eventually caught up to the 2-year Treasury rate, either because of a pullback in the 2-year, the sheer aggression of the Fed’s rate hikes, or a combination of the two.
The prevailing market expectation is for another 75-basis point hike in the Fed Funds rate this month, which would put the key Fed interest rate around 3%, still 75 basis points below the 2-year Treasury rate.
I also included the 30-year Treasury rate (blue line) in the chart above, showing how the 2-year Treasury rate only ever touches or surpasses the 30-year in the run-up to a recession. Today, the 2-year yield is around 25 basis points higher than the 30-year yield.
That is the market’s way of saying that the Fed Funds rate is going a lot higher, but the economy will break down at some point, disallowing the 30-year yield to rise faster than rates on the shorter end of the curve.
It’s also interesting to note that, after the upcoming Fed rate hike, the Fed Funds rate will have gone higher than its previous peak for the first time since 2000.
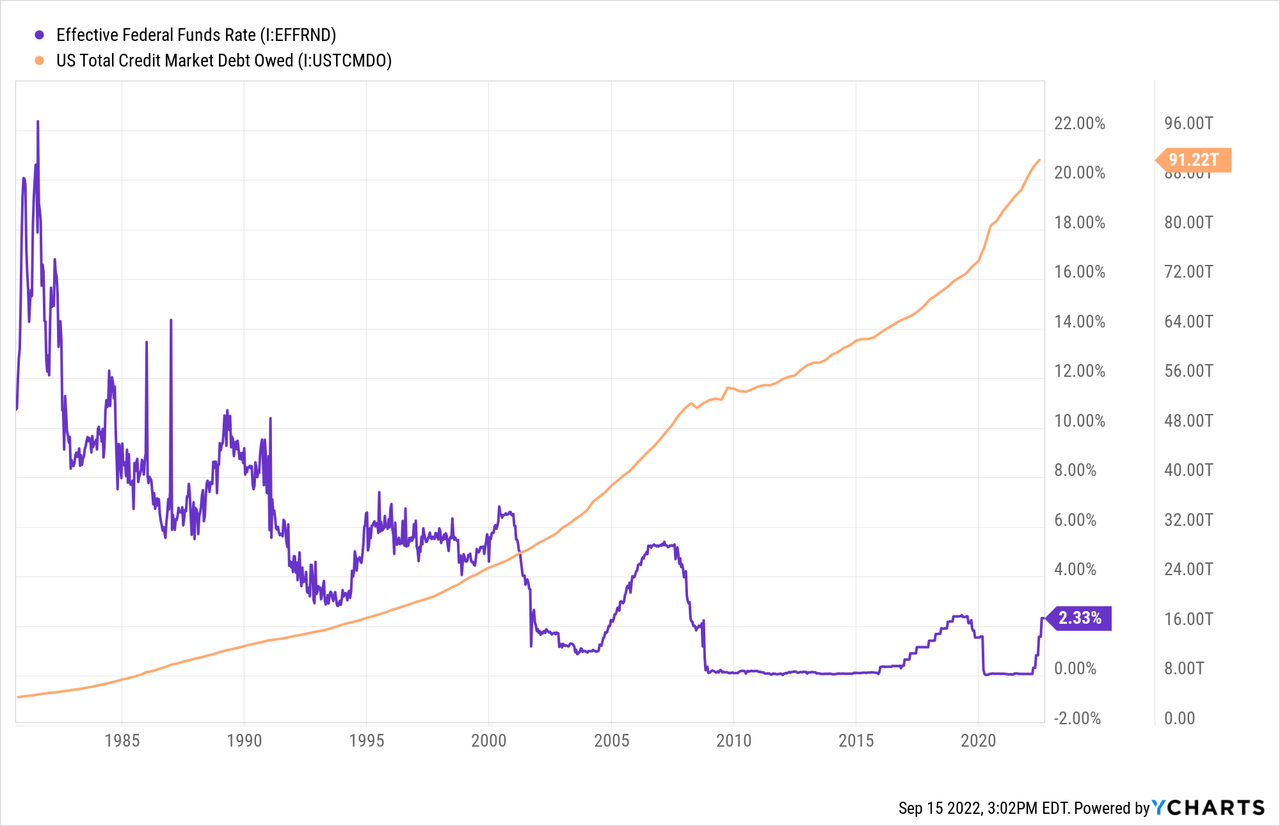
I’ve included total public and private debt in the US economy in the above chart. As you can see, total US debt is approaching $100 trillion. As of the latest reading, total US debt is just barely shy of 400% of 2021’s GDP of ~$23 trillion.
And though it is often asserted that more debt, specifically more government debt, is inflationary, I believe the opposite is true. That is because an increasing amount of spending is simply going to pay the obligations of the past in the form of various mandatory spending measures (Social Security, Medicare, interest payments, etc.). Meanwhile, a smaller and smaller share of the total budget is going toward discretionary spending, which would include education, basic research, infrastructure, and anything else that is forward-looking.
Here’s a long-term chart showing how total discretionary spending (in red) has shrunk in nominal terms as mandatory spending has tripled since the 1960s.
US Government Debt
Mandatory spending mostly is not inflationary, but rather it goes up in response to inflation. For example, old age benefits rise via cost-of-living adjustments based on backward-looking measurements of inflation. (This is why the government can’t really “inflate its way” out of its debt load.)
Aging demographics and slowing population growth virtually assures that mandatory spending will continue to grow as a percentage of the federal budget, further crowding out discretionary spending (at least as a share of total spending) over time.
Here’s a chart showing discretionary (in red) versus mandatory (in blue) spending as a percentage of GDP since 2007.
US Government Debt
During recessions, discretionary spending ticks up as a share of GDP, both because GDP shrinks and because additional government spending kicks in. But discretionary spending as a share of GDP is still shrinking over time.
Rather than increasing dynamism and monetary velocity in the economy, rising mandatory spending combined with shrinking discretionary spending is disinflationary or perhaps even deflationary because of its non-productive nature. It does not produce a revenue stream in the form of additional GDP growth that could be returned to the government in the form of higher taxation. Instead of increasing economic growth, it acts as a drag on the economy by reallocating resources from productive parts of the economy to unproductive parts.
Much the same could be said of private sector debt, especially corporate debt, which has accumulated more for unproductive purposes like buybacks than for productive uses like real investment.
In a longwinded way, I’m trying to make two points here:
- The Fed’s monetary tightening will become exponentially more painful for the economy because of the amount of debt the US is carrying.
- Point #1 is especially true because of the changing composition of debt from productive to unproductive debt.
This is not inflationary. It’s deflationary.
The magnitude of the debt in the US makes the country far more vulnerable to suffering economic weakness as interest rates ratchet up. This is a fundamentally different scenario than what existed in the 1970s and 1980s. In the 1970s, total US public and private debt amounted to about 150% of GDP, on average. By 1990, as interest rates fell from their 1980 peak, total debt to GDP rose to about 230%.
In the first two quarters of 2022, total public and private debt remained near their all-time non-recessionary high of about 370% of GDP.
The overall economy’s indebtedness is a big reason why I believe the Fed’s rate hikes (and quantitative tightening) will quickly kill the economy and send it into a recession.
The Inflation Whipsaw Effect
One way we can see the Fed’s rate hikes already causing a whipsaw effect is in housing.
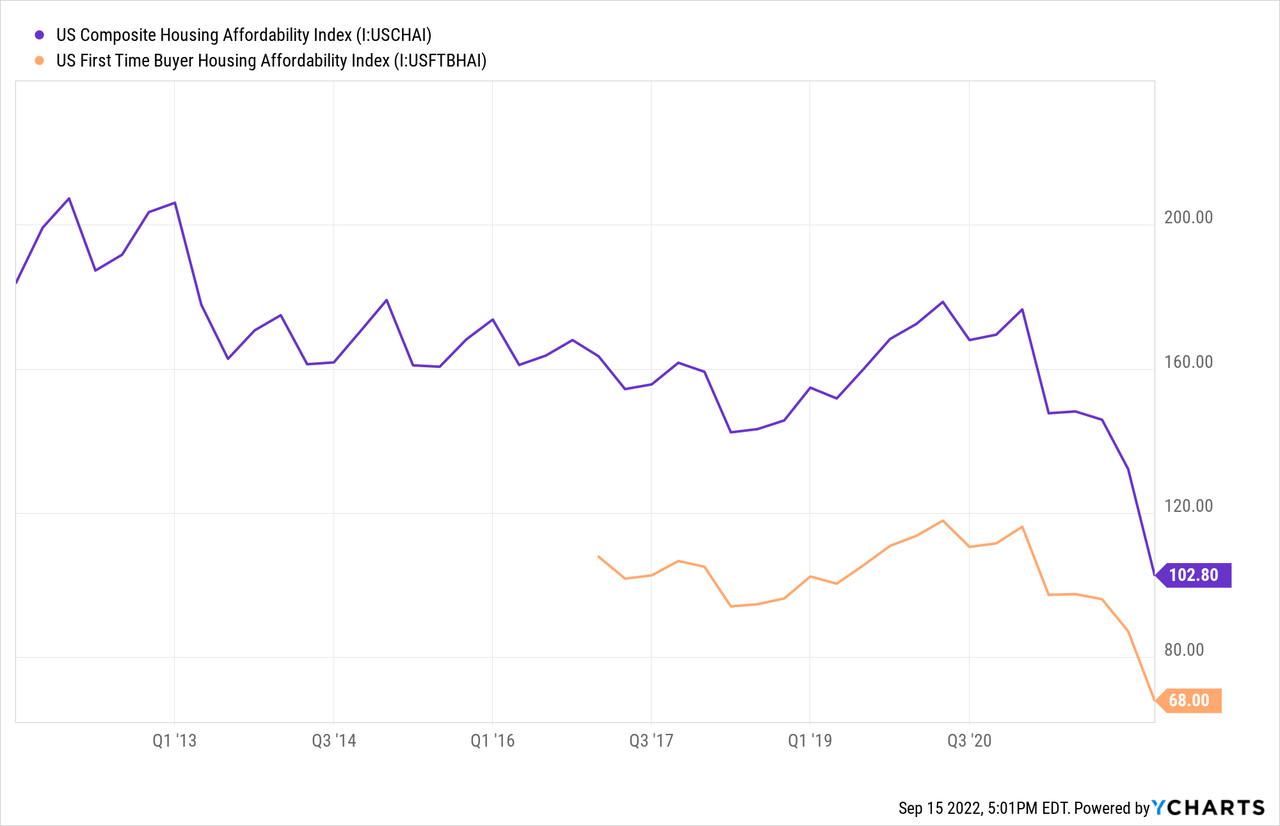
There remains huge demand for homes among Millennials, who have lower homeownership rates than any of the three preceding generations at the same age due to affordability issues.
Apartment List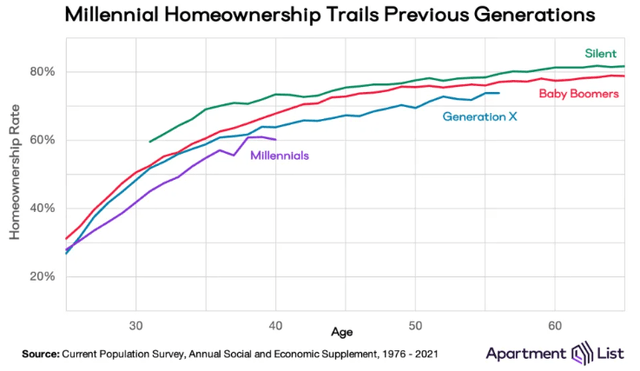
But after a ~40% rise in home prices over the last few years and a 30-year mortgage rate that has recently soared north of 6%, home affordability has collapsed, especially for first-time buyers.
This has had a predictable effect on the supply of homes on the market, especially newly built homes. This year, as demand from buyers has dried up, the supply of new homes has shot up from 6 months to 11 months, the highest level since March 2009.
St. Louis Fed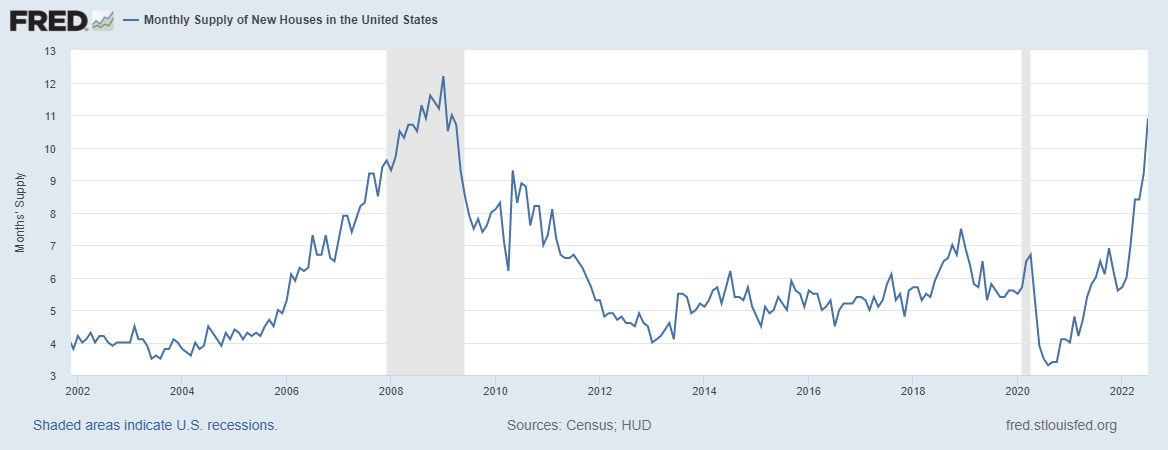
The last reading of this measurement was July 2022. Surely inventory has surged even higher since then.
What effect will this have?
Barry Sternlicht, Chairman and CEO of real estate-focused investment group Starwood Capital, says the effect is obvious: a “major crash” in housing.
You are going to have a major crash in the housing market and housing prices are going down. You are seeing housing prices correct.
That is likely only the tip of the iceberg of the coming deflation. Surging interest rates will have similar effects on multiple other industries and sectors, and there will be ripple effects from such deflation. Think, for instance, of the drop in demand for appliances, furniture, and home improvement goods that should follow from a drop in home sales.
Bottom Line
In our heavily indebted economy, the Fed’s rate hikes along with the broader rising interest rate environment will have an exponentially negative effect on the economy. Higher rates will:
- Tamp down on aggregate demand, as it already has for homes
- Raise mandatory spending for the federal government, because interest payments are a mandatory expense
- Steadily raise debt service costs for businesses and corporations over time
- Eventually cause layoffs, which will further drag down aggregate demand
- Further strengthen the US dollar
This is the typical end of Fed rate hiking cycles.
How will it take to get there? Probably not long. Sternlicht thinks “cracks” will start showing up in the economy in the fourth quarter of this year. Gundlach sees the deflation risk becoming manifest sometime in 2023.
This is not the popular narrative today. It remains contrarian. But if these voices are correct that the Fed’s rate hiking cycle will spur a recession that brings inflation down in a dramatic whipsaw fashion, it will eventually become the popular narrative. And that will get priced in to long-term Treasuries and EDV.
Today, however, a downward whipsaw of inflation scenario is most certainly not priced in. In fact, today you can buy EDV at a lower price than at any point since 2014:
If I’m right that the economy is headed toward the Recession scenario described above, EDV should prove its worth as portfolio insurance.
Be the first to comment