

Tero Vesalainen
Introduction
My September article made an investment case for East West Bancorp, Inc. (NASDAQ:EWBC) back when the stock was $53.43 per share. The stock is up significantly since then and the business hasn’t changed much, so I’m not as bullish. However, East West still has an interesting dividend yield of about 3%, which is around double the S&P 500 (SP500) dividend yield of almost 1.5%.
My thesis is that East West has an effective structure which enables their cost structure to be low. Their employees are very productive relative to employees at other banks.
The Numbers
Per an October 2nd 8-K filing, we have a CFO change. Former CFO Ruth Irene Oh is now the Chief Risk Officer and Chris Del Moral-Niles is the new CFO. Per slide 11 from the 1Q24 update presented at the February 2024 Bank of America (BAC) Financial Services Conference by CFO Del Moral-Niles, East West has best-in-class efficiency. Their deposits per full-time employee are $17 million while the figure is $8 million for their peer group. They have loans of $16 million per full-time employee while this is just $7 million for peers:
Best-in-Class Efficiency (1Q24 update)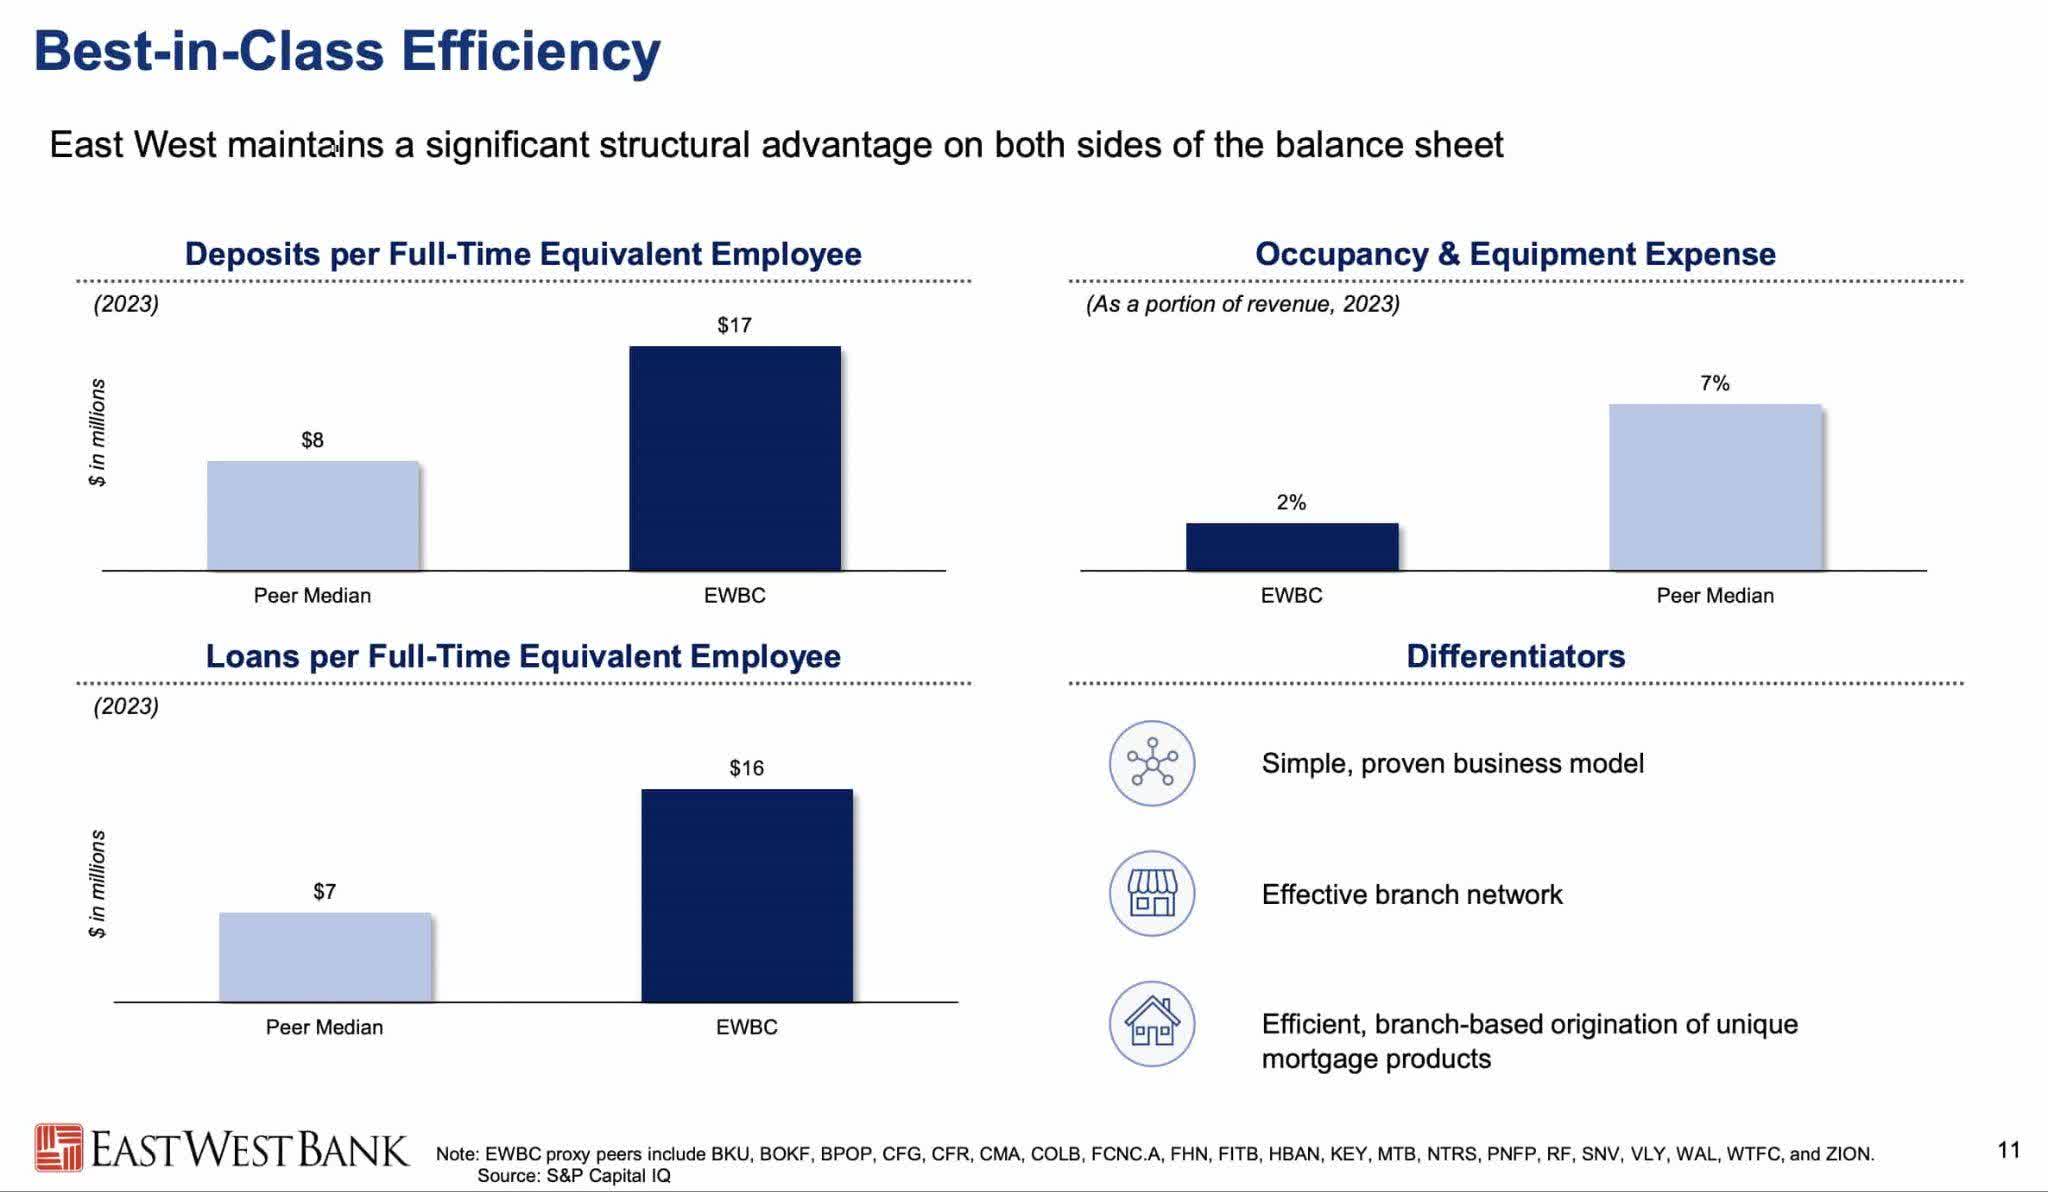
Speaking at the February 2024 Bank of America Financial Services Conference, CFO Del Moral-Niles says their branches are more productive than almost anybody else out there. East West has a large focus on the Asian American community and they make customers feel comfortable with respect to the communication provided at the branch and on the customer service phone line (emphasis added):
Our branches today are extremely well positioned in places where our brand resonates with the immediate customer base, and we are able to service them in a manner that has some defensive moat around it, right? So a portion of our customers aren’t necessarily comfortable for whatever set of reasons, walking into a U.S. bank branch, but they’re perfectly comfortable walking into our branches and conversation, right? And so that accrues for our benefit. Our customer service lines, we answer calls in, it’s 11 to languages right? And so we just have a different product mix. I don’t think — no offense to Bank of America. I don’t think America answers its customer service lines in that many languages.
CFO Del Moral-Niles presented the same slide deck at the February 2024 UBS (UBS) Financial Services Conference, where he further explained cost advantages enjoyed at East West. Unlike some competitors whose branches can be ubiquitous, East West focuses on locations where their brand resonates and where customers know them by word of mouth such that their marketing spend can be close to zero. This is a tremendous consideration for their low operating structure with respect to branches. Additionally, East West has low costs because their customers have large balances (emphasis added):
Our customers tend to have a higher savings rate. And so each customer captured tends to come with more deposits per account than typical. The result of that is for the same dollar balances, I have fewer statements to print, fewer checks to run through the system, fewer transactions overall and end up with a lower operating costs. So we have both lower acquisition — customer acquisition costs and lower operating costs. There’s a sort of question flood there about how the CFPB [Consumer Financial Protection Bureau] will think about overdraft fees, et cetera. East West is a bank where $70 billion generates less than $1 million of overdraft. Why? Our customers carry balances. If we tell them to hold the $10,000 minimum to avoid fees, the customer base is highly fee resistant. They’ll hold $30,000 instead. That’s a unique proposition I’ve never encountered previously in banking. And the dynamic is such that it drives a lower cost, right?
Valuation
Dominic Ng has been Chairman and CEO since 1992 and the results have been remarkable, especially since 2015 as the focus has been on organic growth as opposed to acquisitions. East West didn’t go public until 1999, so my numbers below only go back to 1996 (total assets are in millions):
|
*ROA |
ROE |
Per-share Div. Decl. |
Payout Ratio |
NIM |
*Efficiency Ratio |
*Liabilities To Equity |
Total Assets |
|
|
1996 |
0.22% |
3% |
2.82% |
78% |
||||
|
1997 |
0.70% |
9% |
2.92% |
55% |
||||
|
1998 |
1.00% |
13% |
3.22% |
50% |
||||
|
1999 |
1.35% |
19% |
$0.12 |
10% |
3.62% |
46% |
||
|
2000 |
1.51% |
22% |
$0.12 |
8% |
4.03% |
48% |
||
|
2001 |
1.47% |
18% |
$0.12 |
7% |
3.98% |
51% |
||
|
2002 |
1.61% |
18% |
$0.27 |
13% |
4.11% |
45% |
10.0 |
$3,321 |
|
2003 |
1.64% |
18% |
$0.20 |
16% |
4.26% |
44% |
10.2 |
$4,055 |
|
2004 |
1.57% |
18% |
$0.20 |
13% |
4.24% |
40% |
10.7 |
$6,029 |
|
2005 |
1.55% |
18% |
$0.20 |
10% |
4.22% |
40% |
10.3 |
$8,278 |
|
2006 |
1.46% |
16% |
$0.20 |
8% |
3.98% |
40% |
9.6 |
$10,824 |
|
2007 |
1.45% |
15% |
$0.40 |
15% |
3.94% |
40% |
9.1 |
$11,852 |
|
2008 |
-0.42% |
-4% |
$0.40 |
3.19% |
61% |
7.0 |
$12,423 |
|
|
2009 |
0.59% |
5% |
$0.05 |
11% |
3.76% |
28% |
8.0 |
$20,559 |
|
2010 |
0.82% |
7% |
$0.04 |
5% |
5.05% |
51% |
8.8 |
$20,701 |
|
2011 |
1.14% |
11% |
$0.16 |
10% |
4.66% |
48% |
8.5 |
$21,969 |
|
2012 |
1.29% |
12% |
$0.40 |
21% |
4.63% |
46% |
8.5 |
$22,536 |
|
2013 |
1.25% |
13% |
$0.60 |
29% |
4.38% |
48% |
9.5 |
$24,730 |
|
2014 |
1.24% |
13% |
$0.72 |
30% |
4.03% |
55% |
9.1 |
$28,738 |
|
2015 |
1.27% |
13% |
$0.80 |
30% |
3.35% |
48% |
9.4 |
$32,351 |
|
2016 |
1.30% |
13% |
$0.80 |
27% |
3.30% |
51% |
9.1 |
$34,789 |
|
2017 |
1.41% |
14% |
$0.80 |
23% |
3.48% |
46% |
8.7 |
$37,122 |
|
2018 |
1.83% |
17% |
$0.86 |
18% |
3.78% |
45% |
8.3 |
$41,042 |
|
2019 |
1.59% |
14% |
$1.06 |
23% |
3.64% |
44% |
7.8 |
$44,196 |
|
2020 |
1.16% |
11% |
$1.10 |
28% |
2.98% |
44% |
8.9 |
$52,157 |
|
2021 |
1.47% |
16% |
$1.32 |
22% |
2.72% |
44% |
9.4 |
$60,871 |
|
2022 |
1.80% |
20% |
$1.60 |
20% |
3.45% |
37% |
9.7 |
$64,112 |
|
2023 |
1.71% |
18% |
$1.92 |
24% |
3.61% |
39% |
9.0 |
$69,613 |
East West was able to raise the dividend recently because the earnings per share (“EPS”) from 2021 to 2023 have been much stronger than the figures we saw from 2018 to 2020 ($ in millions except EPS):
|
Net Int. Inc. After Provs. |
Non Interest Income |
Noninterest Expense |
Pretax Income |
Net Inc. To Common Shareholders |
EPS |
|
|
1996 |
$(9) |
$6 |
$35 |
$(38) |
$(41) |
$(1.72) |
|
1997 |
$39 |
$8 |
$29 |
$18 |
$11 |
$0.46 |
|
1998 |
$50 |
$10 |
$33 |
$28 |
$18 |
$0.76 |
|
1999 |
$66 |
$15 |
$40 |
$42 |
$28 |
$1.23 |
|
2000 |
$85 |
$15 |
$50 |
$50 |
$35 |
$1.58 |
|
2001 |
$93 |
$22 |
$62 |
$53 |
$39 |
$1.69 |
|
2002 |
$107 |
$25 |
$64 |
$69 |
$49 |
$2.06 |
|
2003 |
$135 |
$33 |
$78 |
$90 |
$59 |
$1.23 |
|
2004 |
$182 |
$32 |
$93 |
$121 |
$78 |
$1.54 |
|
2005 |
$264 |
$30 |
$124 |
$170 |
$108 |
$2.03 |
|
2006 |
$361 |
$34 |
$162 |
$234 |
$143 |
$2.41 |
|
2007 |
$396 |
$50 |
$183 |
$262 |
$161 |
$2.63 |
|
2008 |
$129 |
$(25) |
$201 |
$(97) |
$(59) |
$(0.94) |
|
2009 |
$(43) |
$391 |
$243 |
$105 |
$33 |
$0.42 |
|
2010 |
$695 |
$39 |
$478 |
$256 |
$121 |
$0.88 |
|
2011 |
$808 |
$11 |
$436 |
$383 |
$238 |
$1.62 |
|
2012 |
$854 |
$(6) |
$423 |
$426 |
$275 |
$1.94 |
|
2013 |
$934 |
$(92) |
$416 |
$426 |
$292 |
$2.12 |
|
2014 |
$992 |
$(12) |
$565 |
$415 |
$342 |
$2.40 |
|
2015 |
$936 |
$183 |
$541 |
$579 |
$385 |
$2.67 |
|
2016 |
$1,005 |
$183 |
$616 |
$572 |
$432 |
$3.00 |
|
2017 |
$1,139 |
$258 |
$661 |
$735 |
$506 |
$3.50 |
|
2018 |
$1,322 |
$211 |
$714 |
$819 |
$704 |
$4.86 |
|
2019 |
$1,369 |
$222 |
$747 |
$844 |
$674 |
$4.63 |
|
2020 |
$1,167 |
$236 |
$716 |
$686 |
$568 |
$3.99 |
|
2021 |
$1,567 |
$286 |
$796 |
$1,056 |
$873 |
$6.16 |
|
2022 |
$1,972 |
$299 |
$859 |
$1,412 |
$1,128 |
$7.98 |
|
2023 |
$2,187 |
$295 |
$1,023 |
$1,460 |
$1,161 |
$8.23 |
The Silicon Valley Bank (“SVB”) collapse has to be taken into consideration during our valuation thought process. It reinforced the importance of looking at HTM securities through more than one lens. The 2023 balance sheet shows HTM securities at $2,956 million but the fair value is $2,454 million. The difference of $502 million doesn’t alarm me at this time.
Another valuation concern is the portfolio of office loans. If the office market continues to decline, then I think East West won’t be hurt as much as some of the other banks with a higher concentration of exposure in downtown areas. CFO Del Moral-Niles spoke about this at the February 2024 UBS Financial Services Conference. He makes the point that many of their office loans are for properties in the suburbs where the level of vacancies is less than downtown locations (emphasis added):
But if you think about the landscape of Downtown L.A., the landscape of San Francisco, you think about sort of high-rise office towers. We’ve gone through the loan book — our highest high-rise is a 13-story building, half of which is actually a parking lot. And so the reality is, we don’t traffic in the same type of downtown high-rise office that is most problematic. And we’re not seeing the level of vacancies that have risen to a level that would give us any pause at this point in time. Most of our office products, average loan size is $4 million, is out in the suburban landscape, sprinkled across the entire Southern California Basin or the Bay Area at large. And it’s just not seeing the same type of dynamics as people who have to commute across the bridge or through an hour of traffic to get into Downtown.
The 2023 cash flow statement shows cash dividends of $189 million in 2021, $228 million in 2022 and $275 million in 2023 so the payout ratio remains under control. The per-share dividend doubled from 2020 to 2024, going from $1.10 in 2020 to $1.32 in 2021, $1.60 in 2022, $1.92 in 2023 and an expected $2.20 for 2024 per the 4Q23 release. Net income for 2023 is $1,161 million and I believe East West is worth about 10 to 12x this amount which is a range of $11.6 to $13.9 billion. The 2023 10-K shows 140,030,010 shares as of January 31st, which gives us a market cap of $10.1 billion based on the March 1st share price of $72.16. The market cap is still lower than my valuation range, but the gap is much more narrow than it was at the time of my September article such that I see the stock as more of a hold now.
Be the first to comment