

ipuwadol
Investment thesis
Dynatrace (NYSE:DT) reported Q2 FY23 results showing continued strength within a weakening macroeconomic landscape. Despite the good numbers management decided to de-risk FY 23 guidance further, making a second cut to it in a row. In my analysis below, I want to show that with this move the bar has been set very low for Q3 and Q4 that could pave the way for further earnings beats in an otherwise challenging environment.
Intro
Dynatrace is a leading company in one of the most critical areas of modern information technology: Observability. The company’s software helps enterprises pinpoint and solve issues regarding their infrastructure, network and applications making their solution a mission critical tool. Dynatrace is pursuing continuous innovation for which Grail, its recently introduced massively parallel processing data lake house is an excellent example. For more details on the company’s business see my previous article: Dynatrace: Deserving A Richer Valuation As A Profitable Growth Stock.
Q2 23 results: Business as usual
Dynatrace reported fiscal Q2 23 results earlier this month announcing their second annual revenue guidance cut in a row. Before I examine the background of it more deeply, I’d like to take a quick recap of Q2 23 financial highlights.
The most accurate metric for gauging the company’s revenue generating ability is their adjusted ARR metric. This shows annualized recurring revenues from all active subscription contracts at the end of the fiscal quarter adjusted for FX fluctuations and perpetual license roll-offs (rather insignificant amount resulting from the phase out of a previous contract type). With this, the metric is a leading indicator to subscription revenues.
In the graph presented below the blue bars show reported/unadjusted ARR at the end of each quarter, whereas the annual growth rates refer to the YoY change in adjusted ARR:
Dynatrace Q2 23 earnings presentation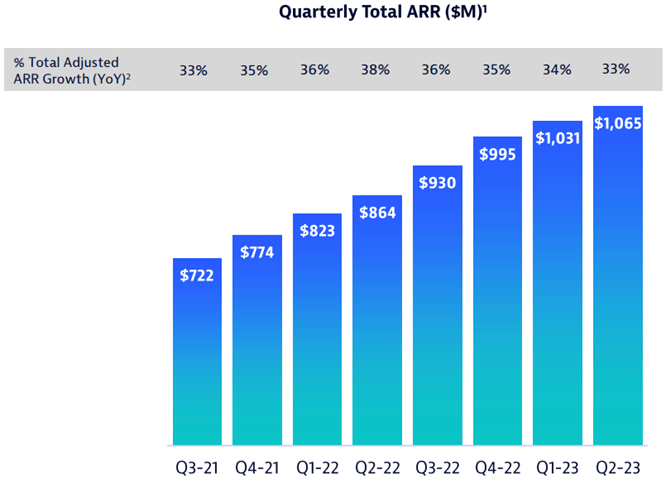
The blue bars show that reported/unadjusted ARR growth has slowed in recent quarters. The main reason behind this was the appreciation of the dollar as more than 40% of the company’s revenues are generated outside the U.S. If we adjust for the FX effect and look at the tendency of the adjusted ARR growth rate (horizontal grey bar), we can see that it has only decreased by 1-1%-points in the past three quarters including Q223. This shows that until the end of the reporting period (end of September) there was no meaningful deterioration in revenue growth. To me, this demonstrates that the company’s services are mission critical indeed as they are still in great demand even under tougher macroeconomic conditions.
Taking a somewhat deeper look behind the YoY headline adjusted ARR growth number of 33% reveals that both new customer acquisition and expansion from existing customers has been healthy:
Dynatrace Q2 23 earnings presentation
10%-points of total adjusted ARR growth came from new logo lands, which was consistent with the previous quarters. If we look at the number of new logos added we can see that the usual seasonal pattern prevails: Q1 and Q2 are somewhat softer, while Q3 and Q4 are stronger:
Created by author based on company fundamentals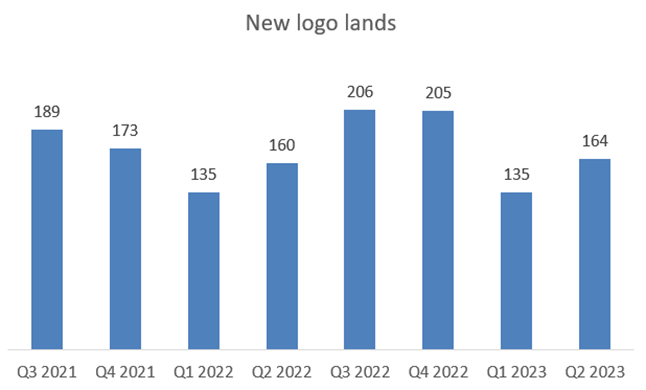
Furthermore, based on quarterly earnings calls the average ARR for new logo lands has increased from $105-110,000 in Q222 to $120,000 in Q223, which further contributes to ARR growth from new customer acquisition.
Net expansion at existing customers has been trending constantly above 120% for the past 18 quarters, which has been the basis of the company’s 30%+ ARR growth in the past several years. In Q2 23 23%-points of adjusted ARR growth came from existing customers in line with the previous quarter, showing that net expansion is still holding up well.
Finally, it’s worth to look at a somewhat forward-looking revenue metric, remaining performance obligations (RPO), which represent the total amount of all contracted business whether billed or not. Looking only at dollar amounts would be misleading due to large currency fluctuations this year. Luckily, management reveals every quarter the adjusted and rounded YoY RPO growth rate, which is a good indicator for the health of the underlying business. The trend for the past several quarters looks as follows:
Created by author based on earnings call transcripts
There was a decline in the pace of adjusted RPO growth during the past several quarters that can be explained by a few reasons. First and foremost, as the business grows in scale growth rates usually come down slightly. Secondly, Dynatrace tries to extend the contract duration of its customers (e.g.: from a one-year contract to a three-year contract), which could have been especially successful in the boom following the pandemic in my opinion. This could have boosted the total amount of RPO back then. Currently, I think it’s much harder to convince customers to renew contracts for longer, which has a dampening effect on RPO growth.
However, despite these effects in Q2 23 we could see a slight uptick in the growth rate again. I believe that on top of the previously discussed tendencies, this supports the thesis that fundamentals have stayed clearly healthy in the most recent quarter. Furthermore, management added on the Q2 23 earnings call that they didn’t see meaningful deterioration in the business even through to month of October.
But how can this be reconciled with another guidance cut from the company?
Better safe than sorry
Although beating previously set goals in the past two quarters Dynatrace made cuts to its annual adjusted ARR growth forecast following the publication of both Q1 and Q2 23 results. After the Q1 23 quarter the company called out lengthening sales cycles at the end of the quarter leading management to decrease its annual new customer acquisition target to ~700 equaling a flat number YoY:
However, as we entered the final two weeks of the quarter, we saw increased deal scrutiny and additional budget authorization requirements that led to a lengthening in sales cycles, primarily impacting new logos. Our win rates remained healthy and consistent with the last few quarters. And deals that we did not close in Q1 either remain in the pipeline or have been signed. These blocks growth continue to be the combination of new logos added to the Dynatrace platform and net expansion with existing customers.
– Kevin Burns, CFO on Q1 23 earnings call.
After Q2 23 results Dynatrace shared with investors that they observed further weakening in macro conditions, especially in Europe. Although Q2 23 financial highlights didn’t show meaningful deterioration in fundamentals management decided to further trim its growth forecasts. This time they reduced new customer acquisition targets once again (5% decline YoY) and called out that the net expansion rate could possibly fall below 120% in Q4 after almost 20 consecutive quarters of 120%+ performance:
Now let me turn to guidance. Our pipeline and demand generation remains very healthy and our competitive positioning and win rates remain strong. However, the macro conditions continue to generally weaken and we think this is even more prevalent in Europe.
As a result, we now expect close rates in the back half to be lower than what we experienced in the first half of fiscal 2023. Therefore, we will be reducing ARR constant currency guidance by $30 million and we believe this will primarily impact ARR towards the end of the fiscal year.
In light of this increased pressure on ARR, we are moderating some investments in order to increase operating margin and to continue to drive a balanced business.
– Kevin Burns, CFO on Q2 23 earnings call.
It’s worth noting that based on the above management still handles profitability as a top priority and insists on previously communicated operating margin goals by reducing planned investments in a necessary amount.
Looking at the most important numbers, the two guidance cuts can be summarized as follows:
Created by author based on company presentations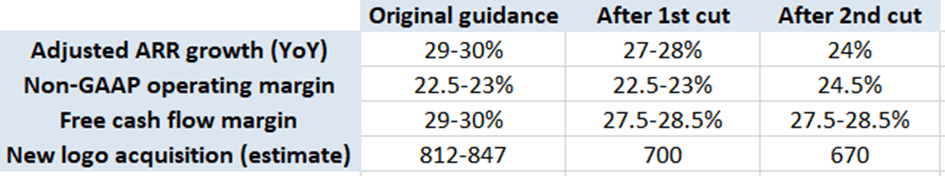
From the table above we can see that the significant reduction of the new logo acquisition estimate in Q1 (1st cut) impacted the adjusted ARR growth rate only by 2%-points. However, after Q2 results estimated ARR growth of existing customers has been dialed back as well, which resulted in an even larger guidance cut to 24% adjusted ARR growth YoY. This is quite a significant cut for FY 23 in the light of the fact that adjusted ARR growth tracked at 34% in Q1 and 33% in Q2.
For this to materialize Dynatrace should add $120 million in new adjusted ARR in H2 after adding already $117 million in H1. For the first look this probably doesn’t seem a big deal. However, considering seasonal patterns reveals that H1 new ARR makes up roughly only 36% of total annual new ARR, so Q3 and Q4 numbers are usually much stronger. To visualize this, I have created a graph with FY21-FY23 quarterly new ARR numbers:
Created by author based on management presentations and earnings call transcripts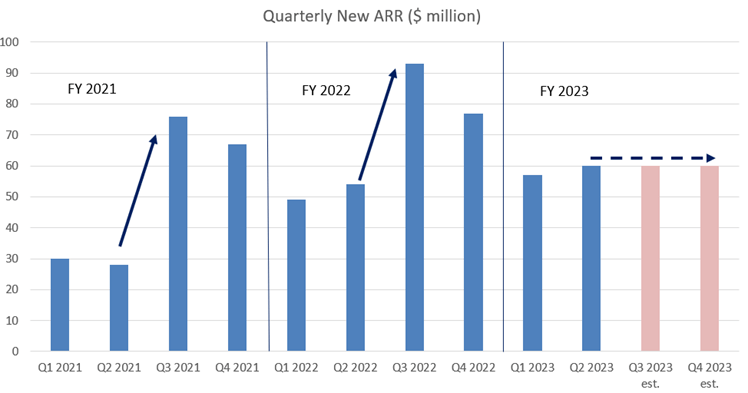
From a quarterly new ARR perspective Q1 and Q2 quarters are usually followed by much stronger Q3 and Q4 quarters. The most recent guidance cut of management reflects that Q3 and Q4 new ARR numbers should be flat compared to previous quarters, which they also outlined in their Q2 23 earnings call:
In terms of ARR seasonality, we expect that net new ARR is going to be $120 million in the back half of 2023, split roughly evenly between Q3 and Q4 to reflect further conservatism in guidance.
– Kevin Burns, CFO on Q2 23 earnings call.
I believe that in the light of the fact that management didn’t see material deterioration in fundamentals until the end of October (essentially meaning that at least 1 out of 3 months of Q3 went well) this ARR guidance seems overly conservative. On the top of that “only” 25% of revenues are generated in the Europe, Middle East, Africa region, where a general slowdown seems to be more pronounced. If we calculate with YoY flat new ARR in H2 ($170 million) and subtract 25% of it we would still get ~$128 million new ARR for H2, which is still above the $120 million guide.
With this, I believe that Dynatrace de-risked its FY 23 adjusted ARR growth guidance to a significant extent paving the way for further easy beats in the upcoming quarters. And all this without a further serious damage to the share price.
Finally, it is also worth to note that management even increased its non-GAAP operating margin guide for FY 23 compared to the original forecast from 22.5-23% to 24.5%. This reflects responsible cost controlling efforts, which I think are a must in the current fragile economic environment. Free cash flow margins track also strong at 29% in Q2 23 and are only expected to decrease slightly within the new guidance framework.
Considering all the above I think that Dynatrace is a rare growth company with an exceptionally strong margin profile and strong long-term growth prospects. Although current market sentiment is not in the shares’ favor, I think they are a sound long-term investment at these levels. Looking at the valuation of shares supports this thesis as well.
Valuation
I made a deeper dive into the valuation of the shares in my previous article on the company, I recommend readers to read that piece. Currently, I suggest let’s assume the following: According to Damodaran, companies in the System and Application Software sector have a gross margin of 71.6% and a net margin of 19.7% on average. In Q2 23 the non-GAAP gross margin of Dynatrace tracked at 83% and management expects it to increase slightly in the back half of the year. Based on this I think it’s fair to assume that the company will be able to reach a net margin of 25% when it reaches larger scale and stock-based compensation declines proportionally.
At the time of writing the company has a market cap of ~$10.46 billion and is expected to generate revenues of ~$1.21 billion in the next twelve months. This results in a forward P/S multiple of ~8.6. Assuming a net margin of 25% this forward P/S multiple of 8.6 would translate into a forward P/E of 34.4. Dividing this with the current adjusted ARR growth rate of the company (33%) assuming constant margins would result in a PEG ratio of 1.04.
According to Ed Yardeni, the IT sector of the S&P500 trades at a PEG ratio of 1.9 currently:
Yardeni Research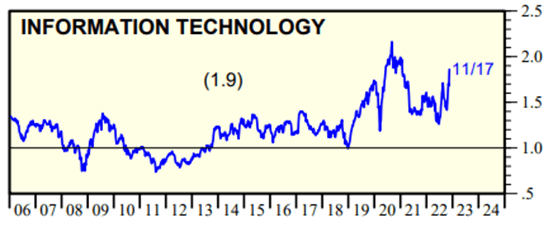
This tells me that the current valuation of the shares is quite conservative, especially that we are talking about a Rule of 50-60 company transforming the way how entire industries approach observability.
Conclusion
Dynatrace navigates the currently challenging macroeconomic environment very well as fundamentals didn’t show signs of deterioration. Management began to see some softness in Europe leading them to de-risk their Q3 and Q4 guidance once again. With this, I think they opened the way towards further positive top and bottom-line earnings surprises even if fundamentals were to weaken in the upcoming months.
Shares trade at a quite conservative valuation when compared to the IT sector, which makes me conclude that investors still don’t pay enough attention to this exceptional growth stock with an unusually strong profitability profile.
Be the first to comment