

gorodenkoff
A Quick Take On Dun & Bradstreet
Dun & Bradstreet Holdings, Inc. (NYSE:DNB) reported its Q3 2022 financial results on November 3, 2022, beating revenue but missing EPS estimates.
The firm provides business information services to organizations worldwide.
While DNB has 51% of its revenue under multi-year contracts with built-in price escalators, with a tougher economic environment ahead, exposure to a very exposed European economy, and low revenue growth already, I’m on Hold for Dun & Bradstreet Holdings, Inc. stock here due to forward growth concerns.
Dun & Bradstreet Overview
Short Hills, New Jersey-based Dun & Bradstreet Holdings, Inc. was founded to provide business information such as company size, financials and credit background to assist other businesses in their research activities.
Management is headed by CEO Anthony Jabbour, who has been with the firm since its take-private transaction in early 2019 and previously held several senior positions in the financial services industry.
The firm acquires large and medium enterprise customers through an in-house, dedicated, direct sales and marketing force focused on specific solutions and geographies.
The company also provides numerous self-service tools for small businesses to update their information or subscribe to a variety of online services.
According to a 2018 market research report by Technavio, the global market for business information is expected to grow by $32 billion from 2019 to 2023.
This represents a forecast CAGR of 5.0% from 2019 to 2023.
The main drivers for this expected growth are the continuing need for companies to remain current on changing customer preferences, financial and economic conditions.
Major competitive or other industry participants include:
-
Equifax
-
Experian
-
Bureau van Dijk
-
Creditsafe
-
Sinotrust
-
Numerous/fragmented solutions
DNB’s Recent Financial Performance
-
Total revenue by quarter has risen according to the following chart:
9 Quarter Total Revenue (Financial Modeling Prep)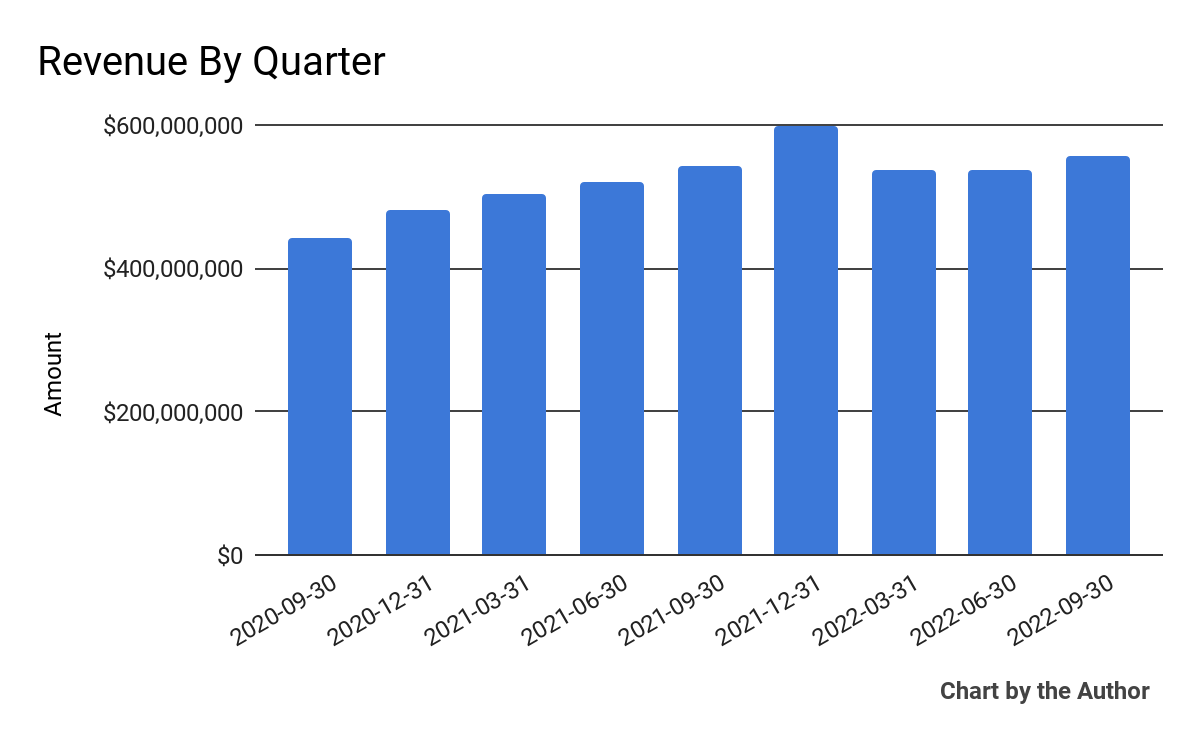
- Selling, G&A expenses as a percentage of total revenue by quarter have remained stable in recent quarters, as the chart shows below:
9 Quarter Selling, G&A % Of Revenue (Financial Modeling Prep)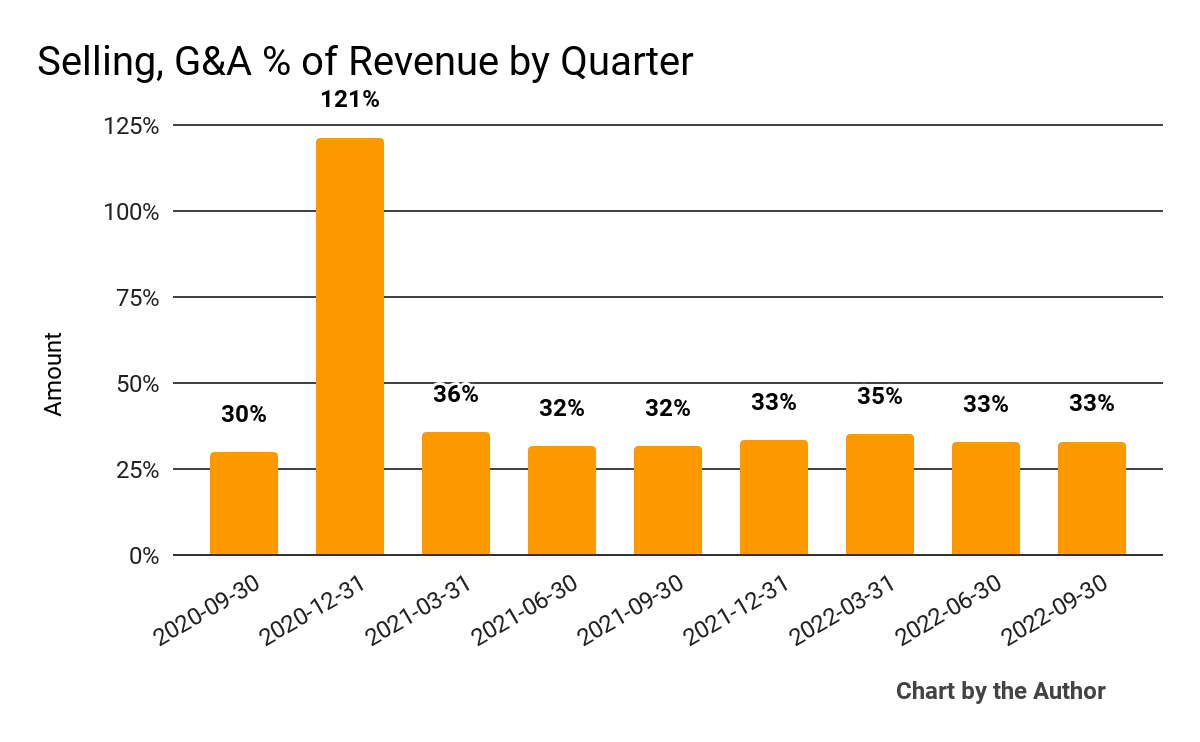
-
Operating income by quarter has fluctuated substantially in recent quarters:
9 Quarter Operating Income (Financial Modeling Prep)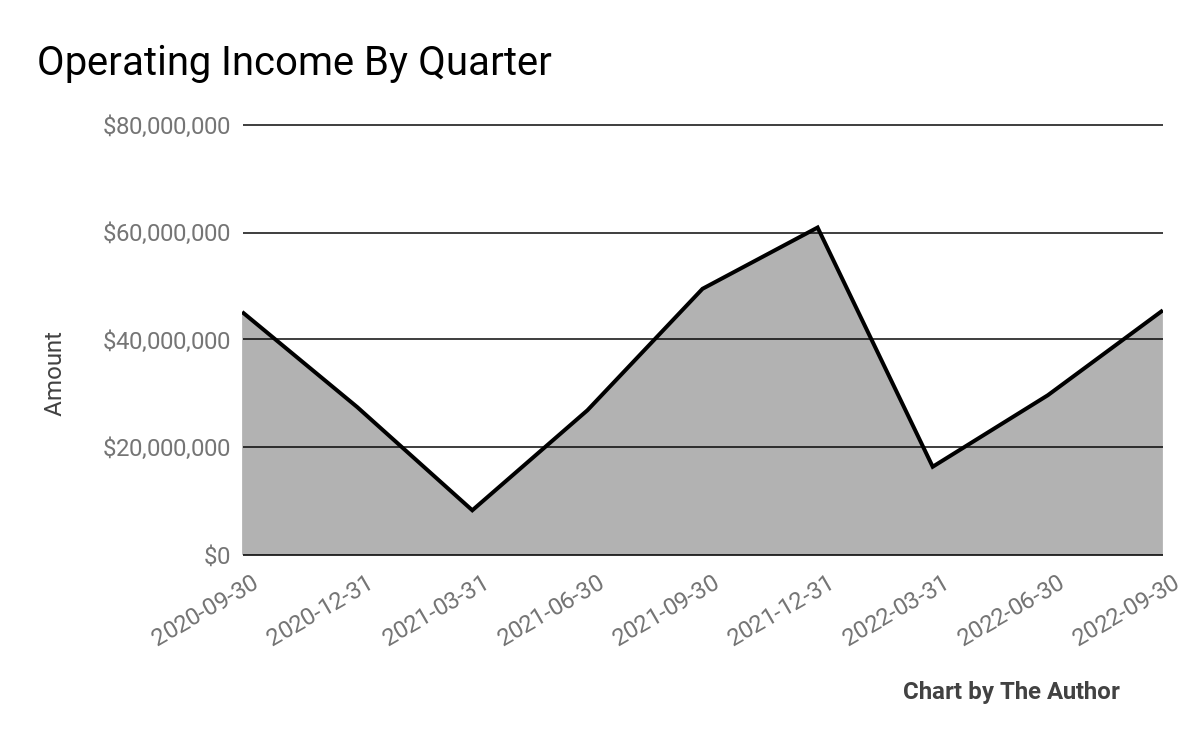
-
Earnings per share (Diluted) have also varied between positive and negative results recently:
9 Quarter Earnings Per Share (Financial Modeling Prep)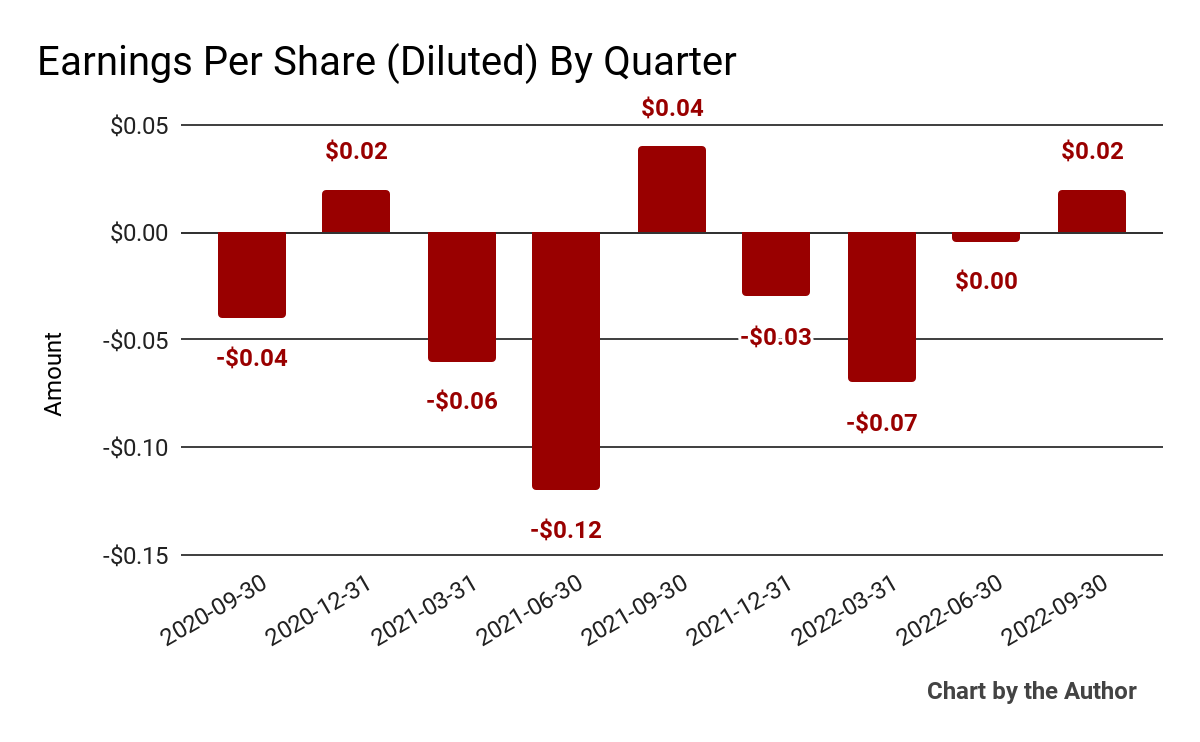
(All data in the above charts is GAAP.)
In the past 12 months, DNB’s stock price has fallen 39.1% vs. the U.S. S&P 500 index’s (SP500) drop of around 19.6%, as the chart below indicates:
52-Week Stock Price Comparison (Seeking Alpha)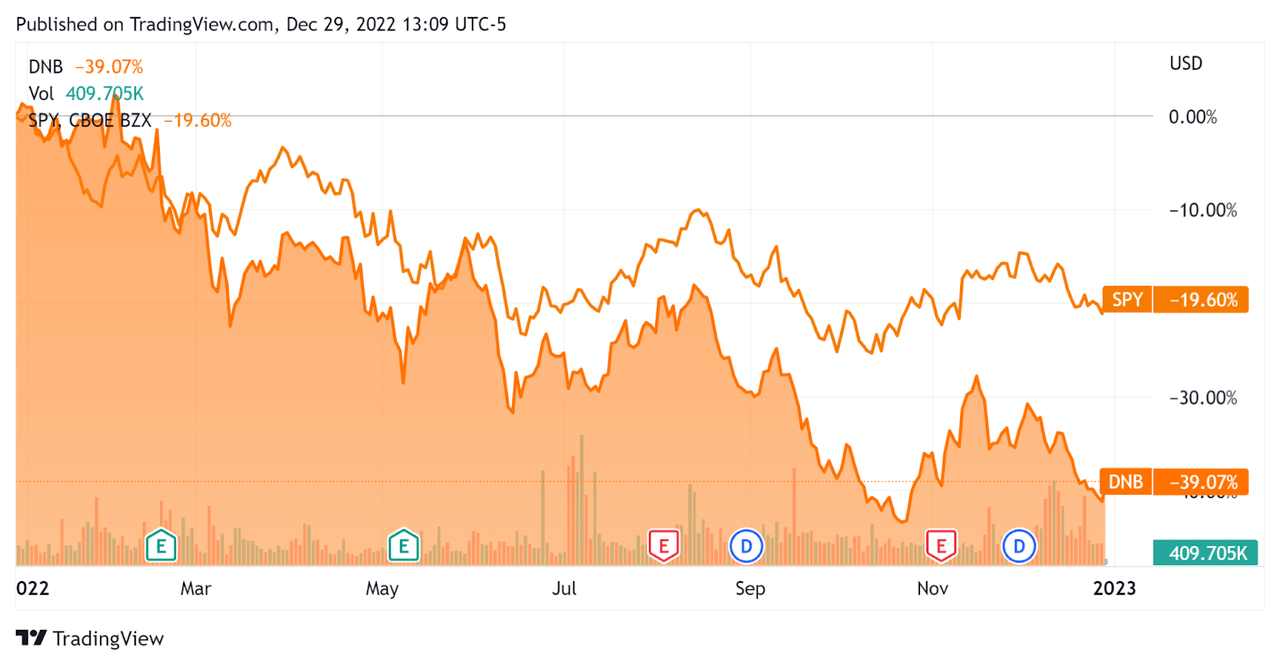
Valuation And Other Metrics For DNB
Below is a table of relevant capitalization and valuation figures for the company:
|
Measure [TTM] |
Amount |
|
Enterprise Value / Sales |
3.8 |
|
Enterprise Value / EBITDA |
11.5 |
|
Revenue Growth Rate |
8.8% |
|
Net Income Margin |
-1.6% |
|
GAAP EBITDA % |
33.3% |
|
Market Capitalization |
$5,180,841,935 |
|
Enterprise Value |
$8,545,305,259 |
|
Operating Cash Flow |
$542,300,000 |
|
Earnings Per Share (Fully Diluted) |
-$0.08 |
(Source – Financial Modeling Prep.)
Below is an estimated DCF (Discounted Cash Flow) analysis of the firm’s projected growth and earnings:
Discounted Cash Flow Calculation (GuruFocus)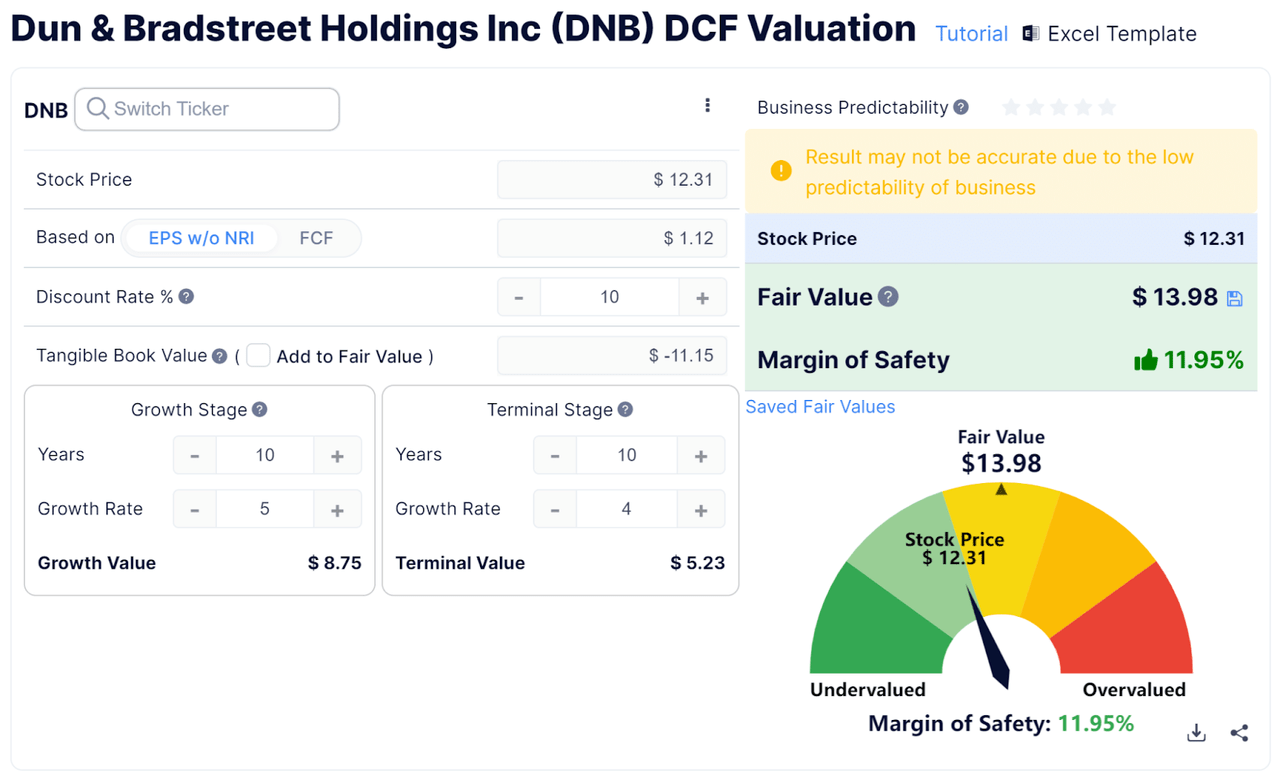
Assuming generous DCF parameters, the firm’s shares would be valued at approximately $13.98 versus the current price of $12.31, indicating they are potentially currently undervalued, with the given earnings, growth, and discount rate assumptions of the DCF.
The Rule of 40 is a software industry rule of thumb that says that as long as the combined revenue growth rate and EBITDA percentage rate equal or exceed 40%, the firm is on an acceptable growth/EBITDA trajectory.
DNB’s most recent GAAP Rule of 40 calculation was 42.1% as of Q3 2022, so the firm has performed well in this regard, per the table below:
|
Rule of 40 – GAAP [TTM] |
Calculation |
|
Recent Rev. Growth % |
8.8% |
|
GAAP EBITDA % |
33.3% |
|
Total |
42.1% |
(Source – Financial Modeling Prep.)
Commentary On Dun & Bradstreet
In its last earnings call (Source – Seeking Alpha), covering Q3 2022’s results, management highlighted growth prospects in its mid-sized and larger customer accounts, “as they fortify themselves for the foreseeable future and continue to extend their multiyear contracts that include built-in pricing escalators.”
International markets provided 4% revenue growth, with strong results in its Finance and Risk segments. The firm’s data set covers more than 500 million entities worldwide.
Management noted the “evolving market and macro landscape” in a nod to seeing the potential for changing economic indicators ahead, which may provide advantages for certain of its offerings.
As to its financial results, total revenue rose only 2.7%, lower in part due to foreign currency headwinds as a result of the strong dollar.
The company’s gross revenue retention rate was 96%, and its Rule of 40 results have been good, but have been driven by its EBITDA and not its revenue growth rate.
Operating income has been highly variable, but earnings per share turned positive in Q3.
For the balance sheet, the firm finished the quarter with $273.3 million in cash, equivalents and trading asset securities and $3.58 billion in total debt.
Over the trailing twelve months, free cash flow was $530.6 million, of which capital expenditures accounted for only $11.7 million.
Looking ahead, management guided full-year 2022 revenue growth to be 2.6% at the midpoint of the range, negatively impacted by a strong dollar. Adjusted EPS is expected to be $1.12 at the midpoint.
Regarding valuation, the market is valuing DNB at an EV/Sales multiple of around 3.8x.
The SaaS Capital Index of publicly held SaaS software companies showed an average forward EV/Revenue multiple of around 6.3x on November 30, 2022, as the chart shows here:
SaaS Capital Index (SaaS Capital)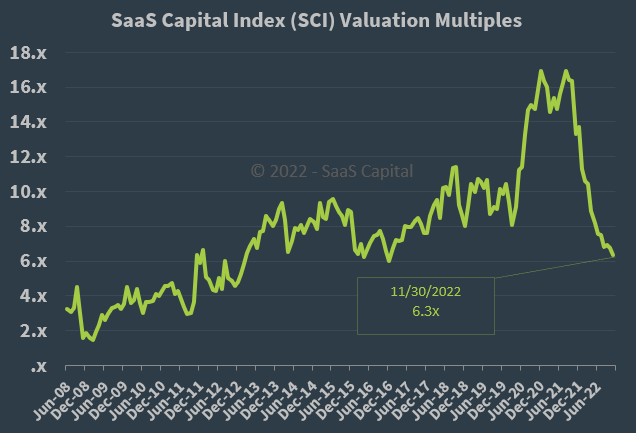
So, by comparison, Dun & Bradstreet Holdings, Inc. is currently valued by the market at a discount to the broader SaaS Capital Index, at least as of November 30, 2022, likely due to its sub-par revenue growth rate.
The primary risk to the company’s outlook is an increasingly likely macroeconomic slowdown or recession, which may produce slower sales cycles and reduce its already flat revenue growth trajectory.
DNB management says they are seeing an elongation of sales cycles at the lower end of its customer base, at least so far.
Other software or services companies are noting that sales cycles have increased due to customers requiring more sign-offs for new or renewing contracts.
While Dun & Bradstreet Holdings, Inc. has 51% of its revenue under multi-year contracts with built-in price escalators, with a tougher economic environment ahead, exposure to a very exposed European economy and low revenue growth already, I’m on Hold for Dun & Bradstreet Holdings, Inc. stock here due to forward growth concerns.
Be the first to comment