

bgsmith/iStock via Getty Images
The previous time I reviewed the Distillate Fundamental Stability & Value ETF (NYSEARCA:NYSEARCA:DSTL) was in January 2022, when I highlighted its solid performance undergirded by a highly sophisticated and alpha-generating cash flow-based strategy capable of finding grossly profitable companies with upside potential, while also warning that investors should be especially vigilant when it comes to trading multiples, and in that sense, the fund did bear some valuation risk which was especially acute with the hawkish era looming.
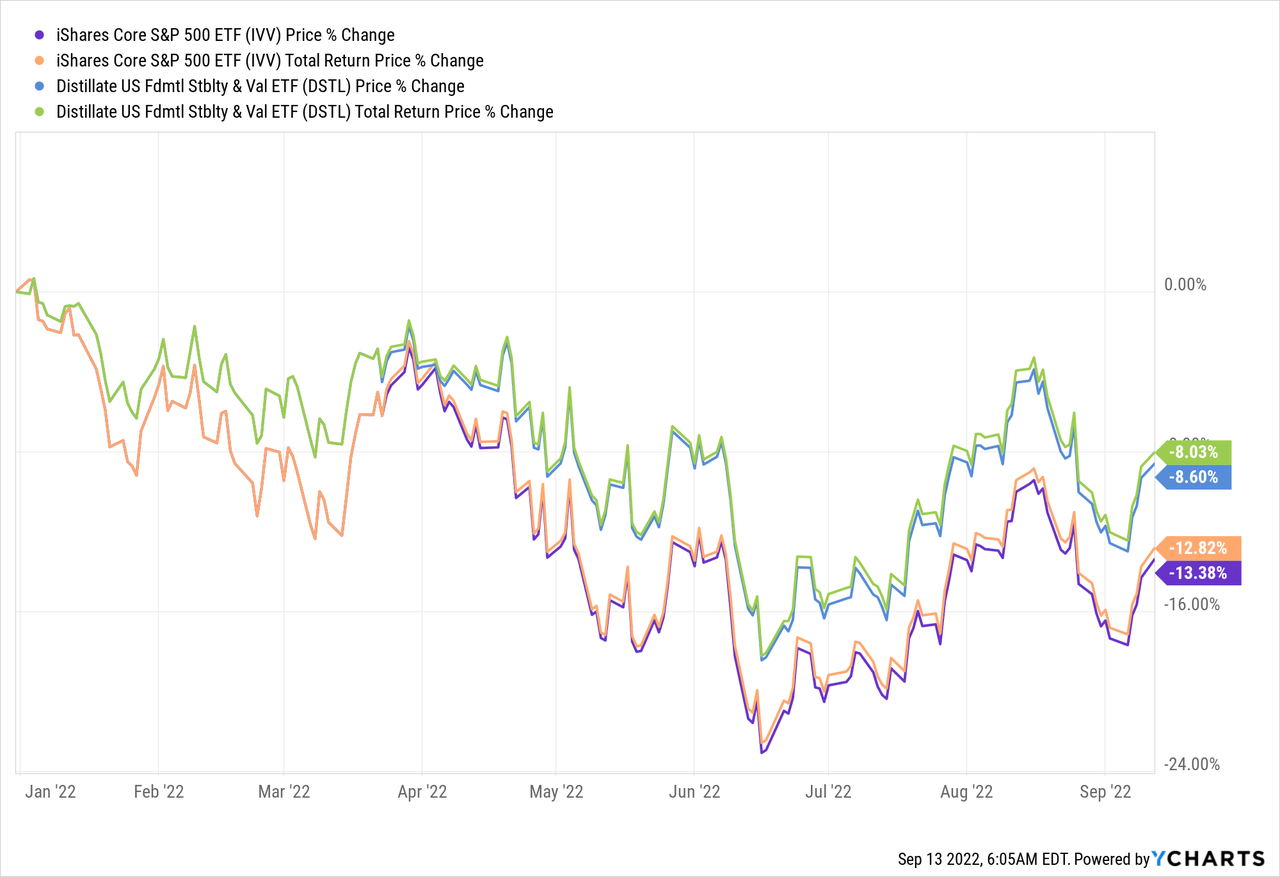
This year, DSTL has once again illustrated how its FCF-focused approach could systematically select stocks that perform better than the market even during stormy weather. Its price did decline, yet at a slower pace compared to the iShares Core S&P 500 ETF (IVV), with the FCF factor (contributing both to quality and value characteristics) more likely bolstering its outperformance.
Since my previous article, the portfolio has been rebalanced three times, and an update is certainly overdue.
After taking a second look at this outperformer, I should conclude that DSTL does deserve attention from capital appreciation-focused investors, yet there are risks, principally regarding valuation that are worthy of a deeper inspection.
Investment strategy bringing value and quality together using FCF
The essential advantage of the fund is that its sophisticated strategy was capable of delivering alpha in the past.
When it comes to passive systematic strategies, sophistication makes an impression of massive potential at first blush, yet in reality, the more complicated and labyrinthine rules are, the lower the chance a fund would beat the market. This is not the case with DSTL.
The cornerstone of DSTL’s strategy is the quarterly-rebalanced Distillate U.S. Fundamental Stability & Value Index. The selection universe is fairly vast, encompassing five hundred largest U.S. companies. They face a few scrupulous tests, with only those that meet certain financial indebtedness, fundamental stability, and valuation criteria proceeding to the portfolio. For valuation, the index relies on the FCF yield (normalized FCF/Enterprise Value).
The following table illustrates what this strategy was capable of delivering during the December 2018 – August 2022 period. An exceptional CAGR, standard deviation only marginally ahead of IVV’s, and max drawdown being less deep compared to the selected peers. Risk-adjusted returns represented by the Sharpe and Sortino ratios are the best, yet below the ideal levels of 1 and 2, respectively. Speaking of the CAGR, the Pacer US Cash Cows 100 ETF (COWZ) did beat it, yet mostly because of its outstanding 2022 thanks to its meaningfully larger exposure to the value factor which I discussed in the January article. The Invesco S&P 500 Pure Value ETF (RPV), one of my favorite large-cap value plays, looks bleak in this group owing to the ‘value drought’ phenomenon, or boring old-economy low-multiple equities underperformance in the late-2010s and during the pandemic as the growth style was in vogue.
Created by the author using data from Portfolio Visualizer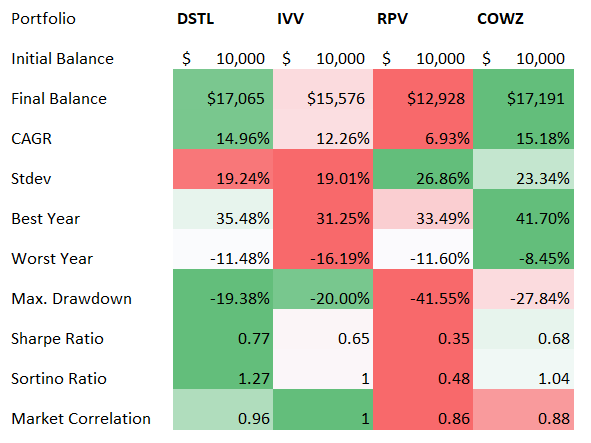
Here is another table showing that DSTL beat IVV every full year (for 2018, only December is included) over its comparatively short trading history, with 2019 and 2022 being especially strong.
Created by the author using data from Portfolio Visualizer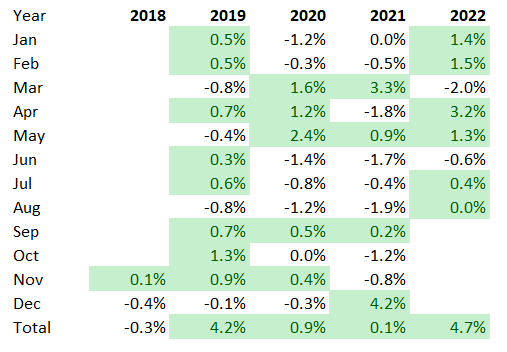
As a brief digression, one fairly odd issue that my most attentive readers might notice here is that DSTL actually beat IVV in July 2022, even though that month growth/speculative growth/expensive plays benefited most from the short-lived bad news is good news rotation to the most battered stocks, i.e., the Invesco S&P 500 Pure Growth ETF (RPG) beat the S&P ETF by ~3.6%, and DSTL is certainly not a growth fund.
Downsides: meaningful exposure to overpriced stocks
Since my January note, the portfolio has been rebalanced three times, with the next recalibration due in October.
As a consequence, around 27.8% of the net assets are now allocated to stocks that were absent in the early January version, with Apple (AAPL), Meta Platforms (META), and PayPal (PYPL) amongst the most notable additions. At the same time, we see 28 tickers that are no longer present. For example, amongst the remarkable deletions that seemingly failed one of the tests be it either valuation, indebtedness, or cash flow stability are Walmart (WMT), Procter & Gamble (PG), and Philip Morris International (PM).
A few changes could be observed regarding sector exposure too. At the moment, DSTL overweights industrials, IT, and healthcare, precisely like in January, yet we see that its allocation to tech was topped up, while investment in consumer staples went from the low double-digits to below 1%; something similar happened with healthcare stocks.
Created by the author using data from IWV, IVV, DSTL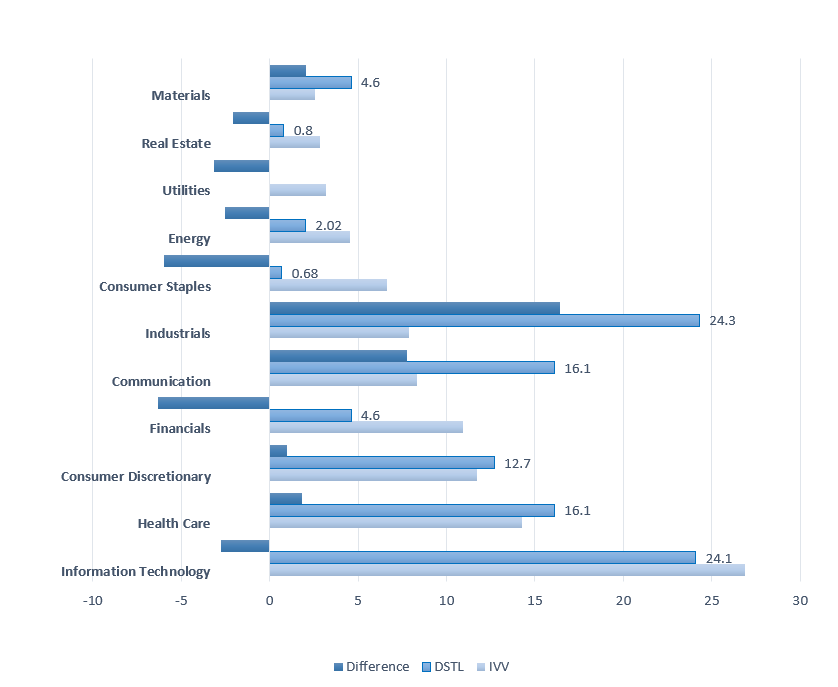
This begs a question of whether the shift in factor exposure occurred. And it did.
A few changes in terms of valuation can be noticed. In January, we saw around 23% allocation to value stocks (Quant Valuation grades of B- or better), while close to a half of the net assets were parked in stocks that were valued inadequately (D+ and lower). Now, value stocks account for ~16.4%, while expensive equities retreated, but they still account for almost 40%.
For better context, the table below contains a few relevant valuation metrics for DSTL’s ten largest investments. Looking at this set, I would not say they are trading in value territory.
Created by the author using data from Seeking Alpha and the fund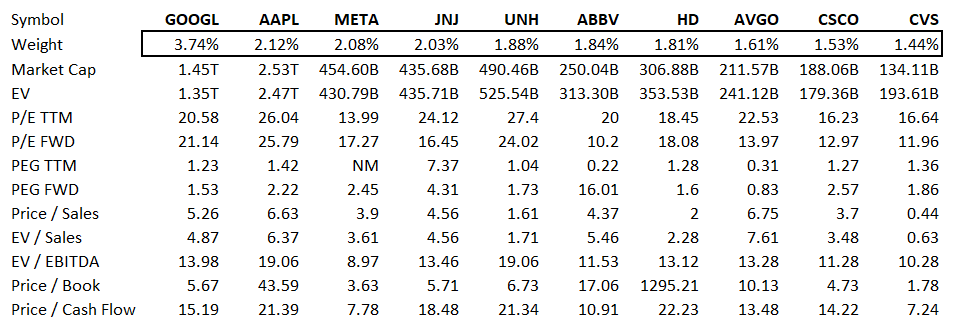
For investors who prefer a simplified P/E-based approach, I should note that my calculations show DSTL’s weighted-average forward P/E at 16x; earnings forecasts were available for all the holdings. The situation with TTM P/E is more complicated owing to Warner Bros. Discovery (WBD) being unprofitable. With due adjustments, the figure came at almost 26x. IVV displays a TTM P/E of 19.86x.
Why is this a risk? As of writing this article, the market has already reacted to the hot CPI data for August in a barely surprising manner. The S&P 500 has tumbled by more than 4%, with the growth-heavy Nasdaq losing ~5.2%. So even though we saw encouraging recovery in summer, it seems it is precarious to play with overstretched multiples.
Solid advantage: profitable, cash-rich companies prevail in the portfolio
As always, DSTL does not compromise on quality. The following table displays a few relevant profitability metrics for the top ten holdings, nicely illustrating the quality of the portfolio.
Created by the author using data from Seeking Alpha and the fund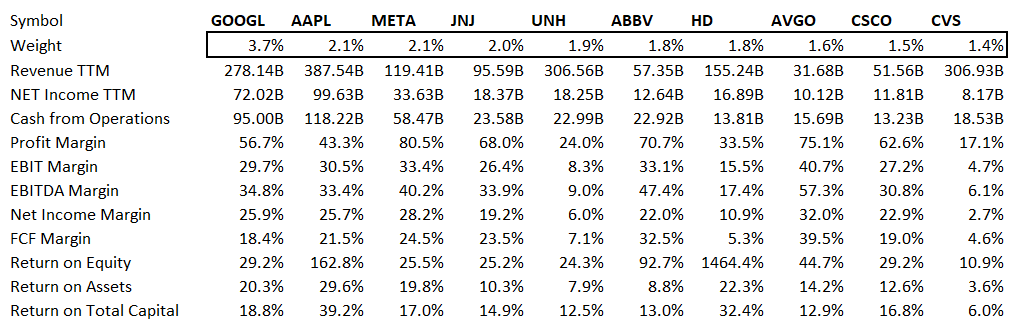
Besides, just two stocks have a C+ Quant Profitability grade, namely Parker-Hannifin Corporation (PH) and Polaris (PII). The A-rated (+/-) account for ~78.4%. So there is nothing to criticize here.
Final thoughts
DSTL delivered a decent performance in the past, beating the S&P 500 over a few relevant timeframes, with the strongest risk-adjusted returns in the peer group and adequate volatility. This perfectly illustrates that if applied properly, FCF-centered strategies can outperform.
Portfolios bringing together reasonably priced stocks with exceptional or at least above-average profitability characteristics, even at the expense of growth, are what I favor in the current environment and beyond. But speaking favorably about DSTL, I am by no means advocating lofty valuations. A gap between expectations priced in and reality is what I disdain most. That is to say, the ETF does bear some valuation risk, which is now especially acute as August CPI data released recently will more likely reverberate through markets for quite some time. This is a perfect backdrop for bears to regain control, cranking up bets on the interest rates going up higher and faster, and growth premia becoming slimmer. In sum, I do expect DSTL to outperform IVV, yet it by no means implies it will not decline if bears continue pushing valuations lower.
Be the first to comment