

USD/ZAR Analysis:
- ZAR unfazed by growing unemployment data print
- USD-focused ZAR showing signs of indecision as doji appears on the daily chart
- Potential for elevated volatility on Friday should there be any mention on tapering specifics or timing by the Fed Chairman at Jackson Hole
SA Unemployment Rises in the Wake of Covid-19 and Civil Unrest
SA’s unemployment rate rose past one third of the eligible workforce to 34.4% from a previous 32.46%. This translates into 7.8 million people without work and comes as no surprise given the toll of the pandemic which was exacerbated by the estimated R10 billion in losses suffered during a period of fairly localized looting in KwaZulu-Natal and Gauteng.
For all market-moving data releases and events see the DailyFX Economic Calendar
Levels to Watch for USD/ZAR Heading into Friday
USD/ZAR selling has subsided somewhat ever since the evening star candle formation indicated the possibility of the reversal around the 15.40 level. Price action dropped below the psychologically important 15.00 level where it continues to trade. However, selling pressure looks to have waned as price action trades pretty flat on the day, resembling a doji candle.
Read through our comprehensive education library for more on candlesticks and candlestick patterns
Although the event officially gets underway on Thursday, most of the volatility in the USD/ZAR pair is likely to play out on Friday as Jerome Powell is set to address virtual attendees at the annual Jackson Hole Economic Symposium. ZAR price action looks to be waiting for the unfolding developments on Friday which tend to show up in the US dollar or Dollar index (DXY) as a benchmark for USD strength.
Continued dollar weakness highlights the 14.73 region as the nearest level of support with the 61.8% Fib (drawn from the April 2020 high to the June 2021 low) at 14.50as the next significant level of support. On the other hand, if news out of Jackson Hole boosts the dollar there may well be another move higher, towards the crucial 15.00 level and potentially even result in a retest of the 15.38 level.
USD/ZAR Daily Chart
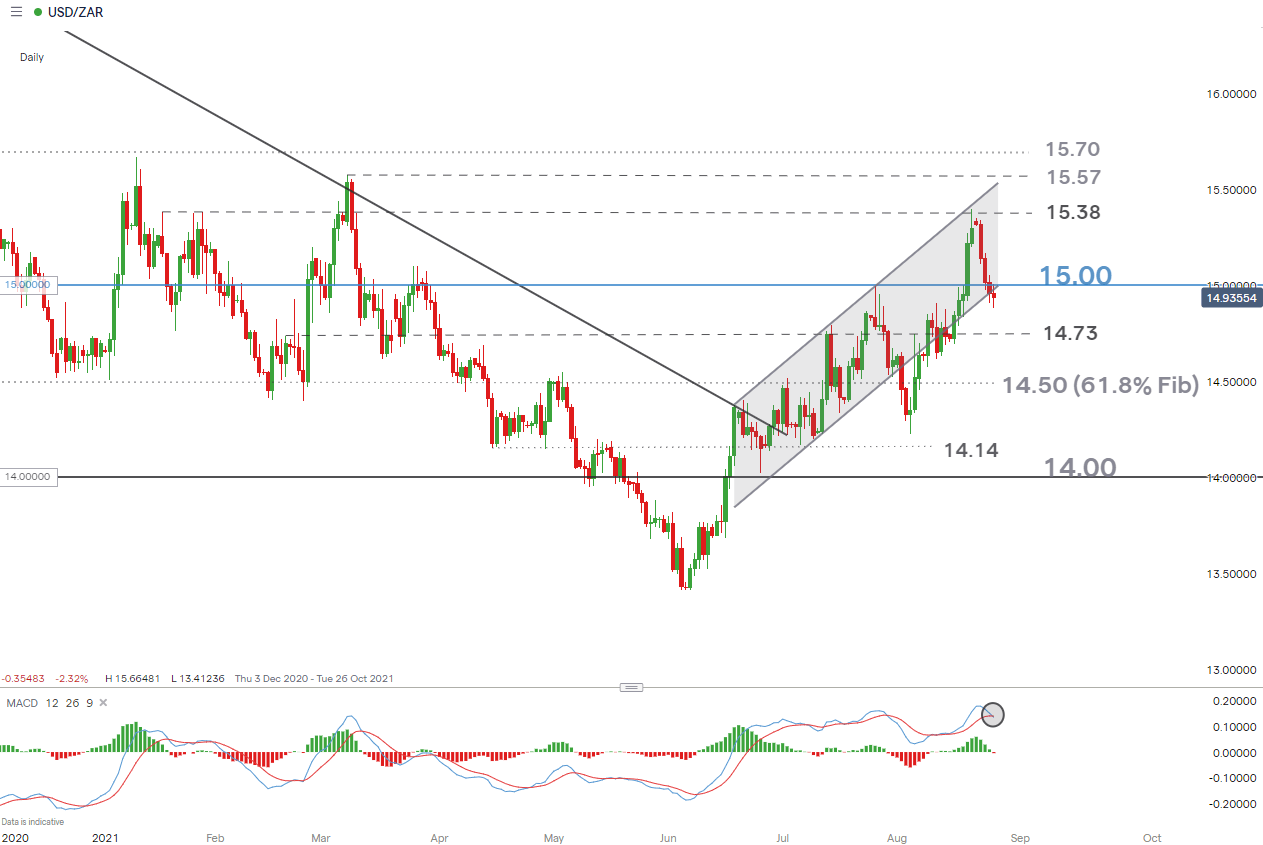
Chart prepared by Richard Snow, IG
Taking a closer look at the 4 hour chart, we see the continuation of the bullish momentum through successive lower lows and lower highs (yellow and purple rectangles). Therefore, further shorter-term ZAR strength could still transpire in the hours before Jackson Hole.
USD/ZAR 4 Hour Chart
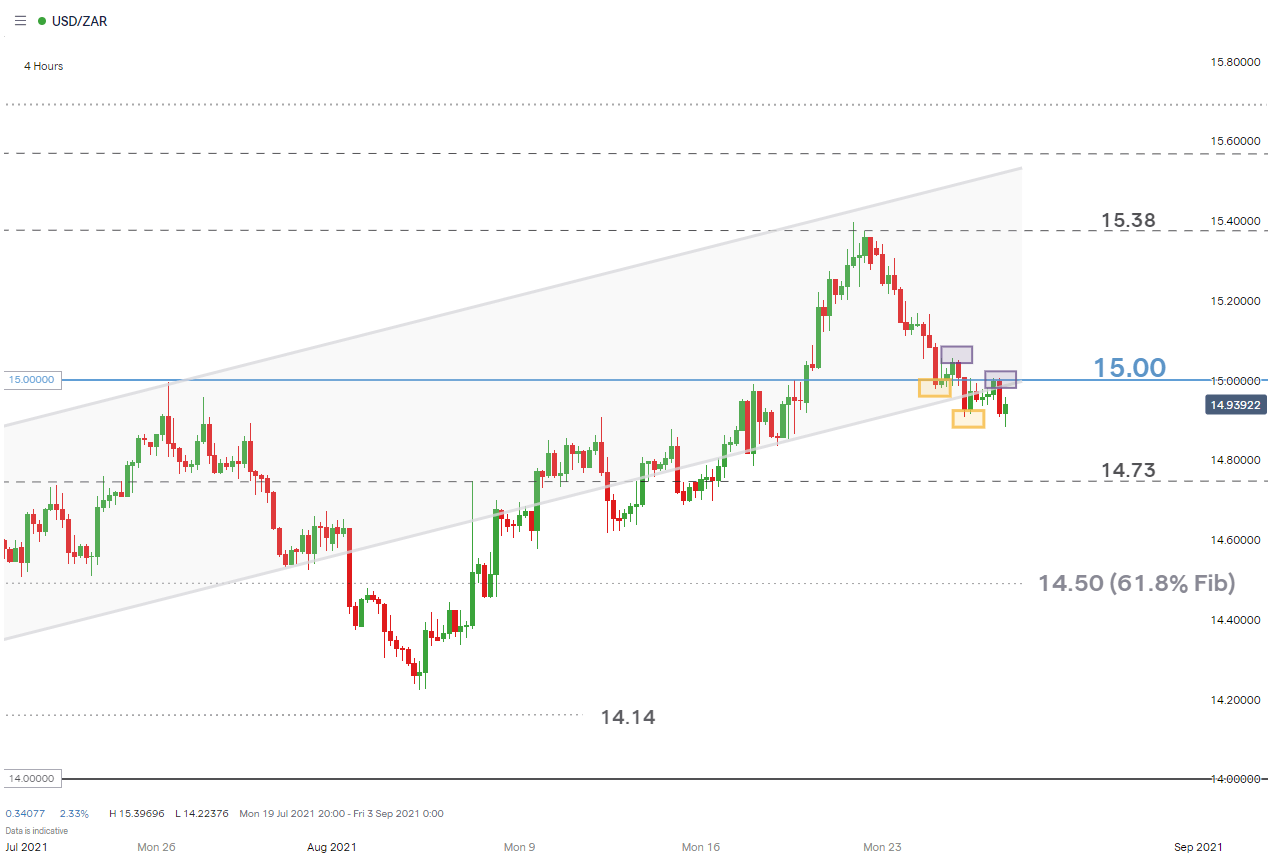
Chart prepared by Richard Snow, IG
— Written by Richard Snow for DailyFX.com
Contact and follow Richard on Twitter: @RichardSnowFX
Be the first to comment