

Mykola Lishchyshyn/iStock via Getty Images
Short-Selling Indicators
During the heyday of technical analysis from 1960 to 1985, the best indicators of bear market bottoms were the odd lot and public short selling ratios. They were based on the “theory of contrary opinion,” the theory that says stock prices reach bottom when most investors are bearish and are expecting further price declines. Large amounts of short selling by investors historically indicated these moments. After correctly signaling the bear market bottoms of 1962, 1966, 1970 and 1974, with no false signals in between, these two short selling ratios became the primary tools of market technicians in that era when looking for the end of a bear market.
Unfortunately, with the emergence of index futures and arbitrage short selling in the mid-1980s, these short selling indicators became useless as it became impossible to distinguish arbitrage short selling from short selling because of the expectation of lower prices. Very few market technicians today know this important history, but those who were around in the 1970s do.
Bear Market ETFs
This situation changed around 2007 with the creation of bearish ETFs. These funds made it possible to again measure investor “short selling.” In this instance, however, investors weren’t short selling directly but were buying ETFs that were. Once these funds were established, it was only necessary for the occurrence of a few bear markets to establish the levels of investor buying that represented extreme levels of bearishness. We now have that history; a history that includes both the 2007-09 bear market and the extreme market decline of 2020.
The fund family chosen for the study was ProShares. The ProShare family is composed of 135 funds with $56 billion under management. ProShares makes available all the data on their funds daily, and the large size of this family helps give statistical validity to the results. Forty-two ETFs are classified as bear market funds for our purposes.
Measuring “Bear Market” Buying
How do you measure investor buying in bearish ETFs? Looking at daily dollar sales like one does any stock is insufficient, since it doesn’t specify how much is from investor buying. With stocks, sales do represent the amount of buying, since buying and selling amounts are always equal. But with ETFs they aren’t. If there are more buyers than sellers of an ETF, the fund creates more shares for the excess buyers. If there are more sellers than buyers, they retire the excess shares. So, sales numbers alone don’t tell you how much money is going into or out of an ETF; you must combine sales with changes in the number of shares outstanding to determine that. Once this is done, multiplying the number of shares being purchased by the fund’s NAV yields how much money is going into the fund on a daily basis.
Measuring the dollar amount going into a fund is not the best measure, however. What’s better is the amount of money going into the fund divided by the total assets in the fund. Producing a ratio allows for historical comparisons; absolute values don’t. This ratio or percent is like the old short selling indicators, where the amount of short selling was divided by the amount of total selling.
As you will see, just like odd lot and public short selling of the past, the amount of money going into bearish ETFs rises sharply at bear market lows. It’s a sudden spike at the bottom, not a gradual increase. Over the past thirteen years, money flowing into three, bearish, ProShare ETFs shows close correlation with bear market bottoms. The three funds are:
ProShares Short S&P 500 (NYSEARCA:SH)
ProShares Short Dow 30 (NYSEARCA:DOG)
ProShares Short QQQ (NYSEARCA:PSQ)
We will show the results of each.
ProShares Short S&P 500
The graph below shows 15½ years of the SPY (The Standard & Poor’s 500 ETF) in blue and, in red, the amount of money going into SH (the ProShares short S&P 500 ETF) divided by total assets. It’s a 21-day moving average of the daily ratio. Notice the sudden increase in investor buying that occurs at major bottoms. Investor buying near the bottom is sometime ten times greater than during the bull market. This sudden increase at the bottom is just like the old, short selling indicators of the 1960s and 70s.
Michael McDonald (Author)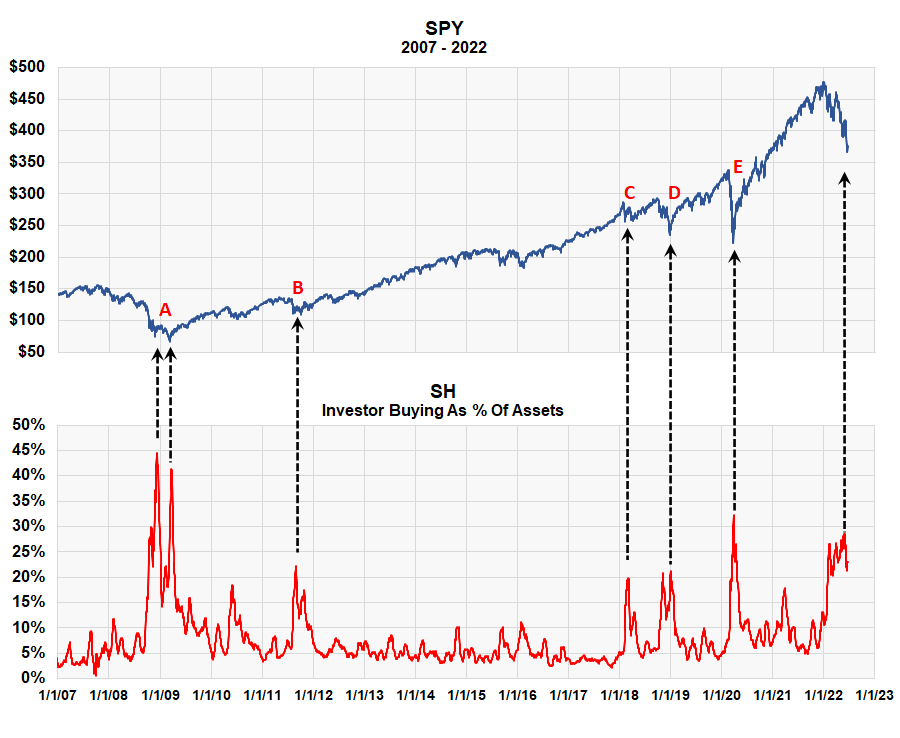
As the red graph shows, besides the current peak, there were six large peaks in investor buying of this bearish fund. They all occurred near a bear market bottom, or at least prior to the beginning of a new price advance. We labeled five of them A through E.
The letter A represents the low period of the great 1½ bear market from 2007 to 2009, when prices declined over 50%. There were two price lows, one at the end of 2008, the other three months later in March 2009. The buying percent of the SH bear fund shows two peaks associated with each bottom. The first one was on December 19th when the buying ratio peaked at 44.4%. The SPY was at $90.11, down 42.4% from the bull market high in 2007. The second peak was a ratio of 41.3% on March 23rd when the SPY was at $82.22, down 47.5% from the high.
The letter B represents the 20% market decline due to US and European sovereign debt crisis that started in August 2011. The peak in buying of the bear fund occurred on August 24th, which was two weeks after the market collapse on Black Monday. This too occurred near the end of that bear market and foreshadowed the beginning of a long, four-year bull market.
The COVID-19 Bear Market
The letter E highlights the two month, 43.2% bear market triggered by the COVID-19 outbreak in early 2020. The SPY reached its low price on March 23rd of $222.95, three days before investor buying of the bearish ETF reached its peak of 32%.
The Current Market
The graph clearly shows the peak level of investor buying of SH associated with this year’s decline. It reached a peak of 28.6% a few weeks ago and is currently at 23%. History shows it’s at the level of buying at past bear market bottoms. Therefore, we think the stock market is currently at a “risk on” moment. We believe these short selling indicators strongly suggests that the bear market is near an end and that investors will be handsomely rewarded going forward.
Investor Buying Of Bearish DOG And PSQ ETFs Pointing To Same Conclusion
Michael McDonald (Author)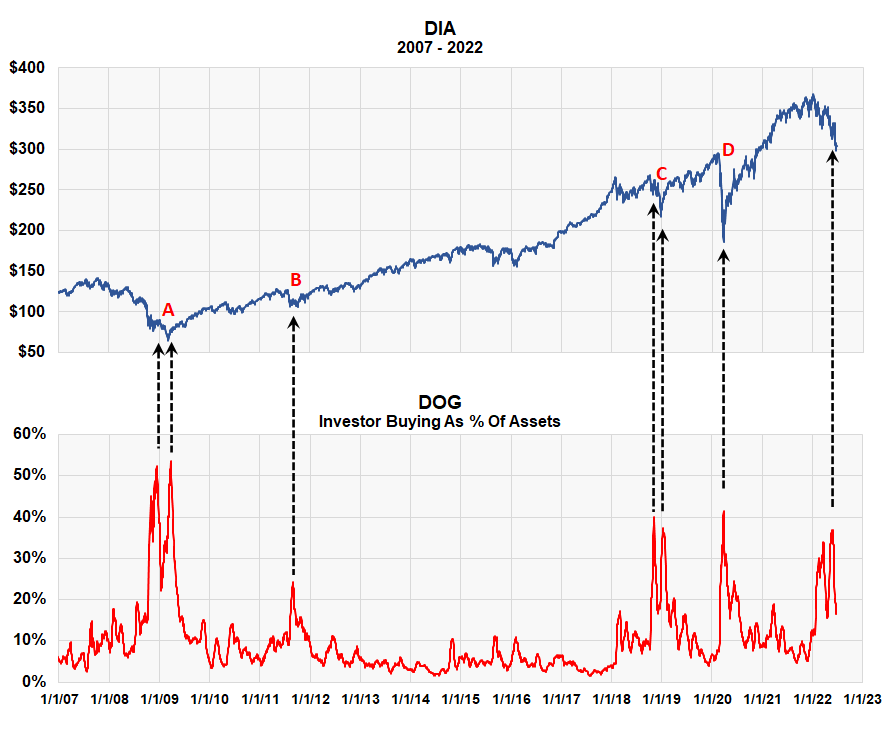
Michael McDonald (Author)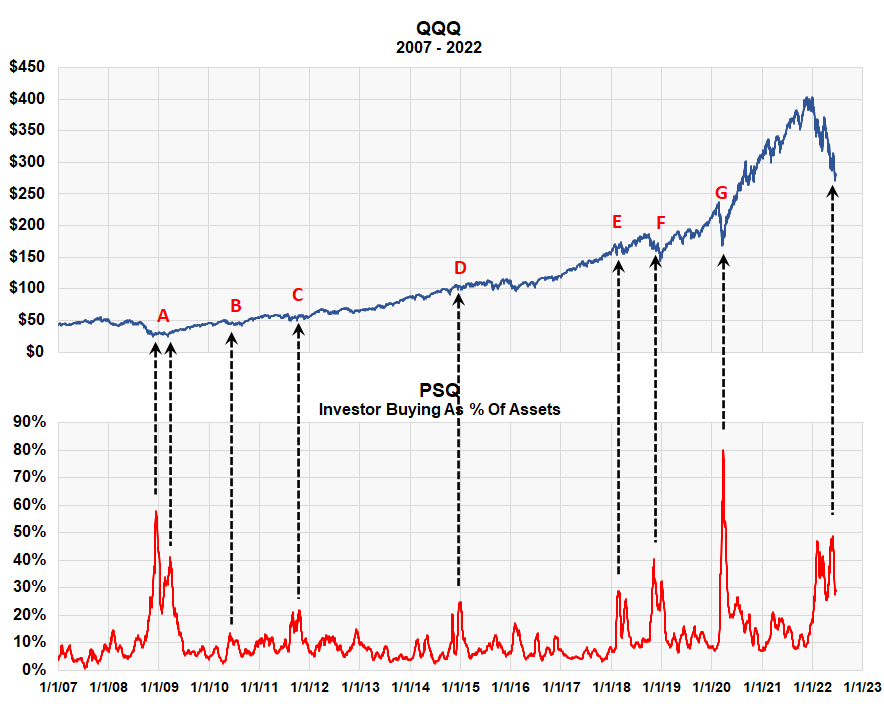
The DOG ETF is designed to be short the Dow Jones Industrials, and money going into that fund shows surges similar to SH.
The PSQ ETF is designed to be short the QQQ, which is the top 100 Nasdaq index, and money moving into that fund shows the same pattern.
Key Takeaways
We believe the amount of money flowing into all three bearish ETFs are signaling a strong, “risk on” moment for investors. They are confirming what other key contrarian indicators like AAII, NAAIM and Investors Intelligence are saying – that this is an important moment to assume risk.
- This is the time to go long DIA, SPY and QQQ, or to stay long these funds if one is already invested in them.
- It’s also time to stay away from bearish ETFs like SH, DOG and PSQ and not go short the market.
Be the first to comment