

TommL/E+ via Getty Images
This dividend ETF (exchange-traded fund) article series aims at evaluating products regarding the relative past performance of their strategies and quality of their current portfolios. As holdings and their weights change over time, reviews may be updated when necessary.
DNL strategy and portfolio
The WisdomTree Global ex-U.S. Quality Dividend Growth Fund (NYSEARCA:DNL) has been tracking the WisdomTree Global ex-U.S. Quality Dividend Growth Index since 06/16/2006. It has a portfolio of 307 stocks, a 12-month distribution yield of 4.58%, and a total expense ratio of 0.42%. Distributions are paid quarterly.
As described by WisdomTree, eligible companies must be in the WisdomTree Global ex-U.S. Dividend Index and have a market capitalization of at least $2 billion. Then, constituents are selected using a combination of growth and quality factors.
“The growth factor ranking is based on long-term earnings growth expectations, while the quality factor ranking is based on three year historical averages for return on equity and return on assets. Companies are weighted in the Index based on annual cash dividends paid.”
The fund invests mostly in large cap companies (82%). The U.K. is the heaviest country in the portfolio, with 15.7% of asset value. It is followed by Switzerland, France, Taiwan and India, between 8% and 10% each. China, Hong Kong and Taiwan weigh 17.7% together, which represents a significant exposure to geopolitical and regulatory risks. The next chart lists the top 15 countries, with an aggregate weight of 92%.
DNL top 15 countries (chart: author with WisdomTree data.)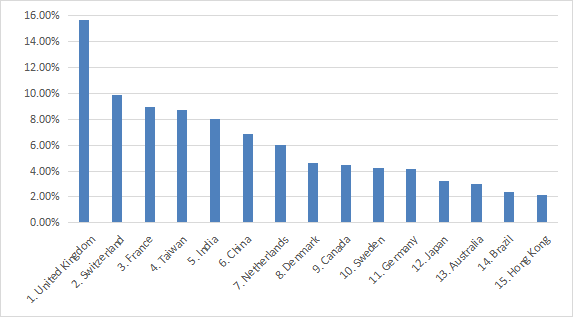
Technology is the heaviest sector (20%), followed by consumer discretionary (16.8%), consumer staples (16.7%), industrials (14.8%) and healthcare (12%). Other sectors are below 8% individually and 20% in aggregate.
DNL sector breakdown (chart: author with WisdomTree data.)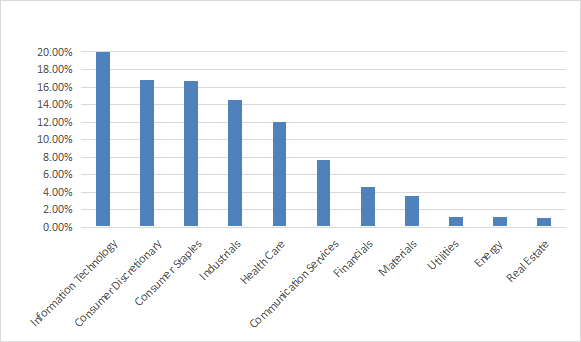
The portfolio is quite concentrated: the top 10 holdings, listed below, represent 39% of asset value. The top name weighs 7.57% as of writing. Other holdings are below 5%.
|
Name |
Ticker |
Weight % |
|
Taiwan Semiconductor Manufacturing Co Ltd |
2330 TT |
7.57% |
|
LVMH Moet Hennessy Louis Vuitton SE |
MC FP |
4.87% |
|
Unilever PLC |
ULVR LN |
4.14% |
|
GSK Plc |
GSK LN |
4.08% |
|
Nestle SA |
NESN SW |
4.05% |
|
Novo Nordisk A/S |
NOVOB DC |
3.46% |
|
Tencent Holdings Ltd |
700 HK |
3.21% |
|
ASML Holding NV |
ASML NA |
2.73% |
|
Sap AG |
SAP GY |
2.67% |
|
Infosys Ltd |
INFO IB |
2.33% |
Past performance
The next table reports the performance and risk metrics of DNL, and takes as a benchmark one of the oldest global dividend ETFs: the iShares International Select Dividend ETF (IDV).
|
since inception |
Total Return |
Annual Return |
Drawdown |
Sharpe |
StdDev |
|
DNL |
103.70% |
4.39% |
-44.53% |
0.26 |
17.04% |
|
IDV |
88.15% |
3.89% |
-70.14% |
0.22 |
20.95% |
Data calculated with Portfolio123.
DNL has outperformed IDV by about 50 bps in annualized return, and most importantly, shows a lower risk measured in drawdown and standard deviation of monthly returns (volatility). However, both have lagged the U.S. index S&P 500 (SPY) by a wide margin (330% total return, 9.2% annualized).
The next chart compares DNL in the last 5 years, with 3 international dividend growth funds: VIGI, IGRO and IQDG. DNL outperforms them, but VIGI is close behind and it is less volatile.
DNL vs. Competitors, last 5 years (Portfolio123)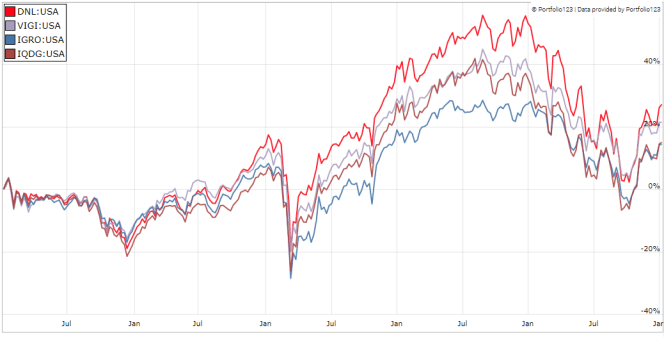
However, DNL has lagged in the last 12 month:
DNL vs. Competitors, last 12 months (Portfolio123)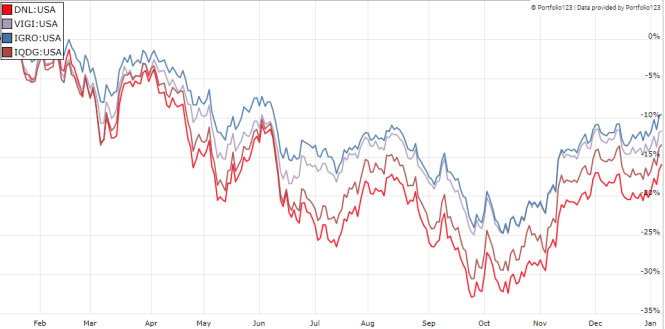
The dividends of 2022 look very attractive, but they may not be indicative of the future. Between 2007 and 2021, distributions have been close to flat. The chart below is not very attractive and makes the “dividend growth” label quite questionable.
Annual sum of distributions per share from 2007 to 2022 (Chart: author)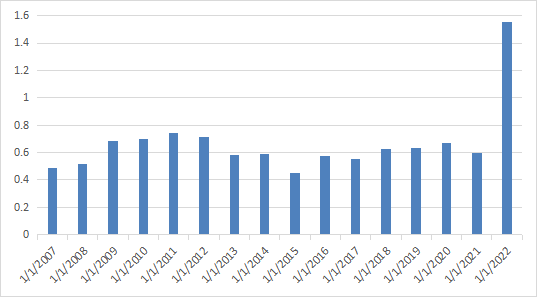
Takeaway
WisdomTree Global ex-U.S. Quality Dividend Growth Fund holds 300 dividend stocks of global, ex-U.S. large and mid-cap companies. The portfolio is well-balanced across sectors and countries. DNL has outperformed a global dividend benchmark since inception, and some of its competitors in the last 5 years. However, it has suffered a deeper drawdown in 2022 and it is still lagging on the short term. Over 17% of WisdomTree Global ex-U.S. Quality Dividend Growth Fund asset value is directly exposed to regulatory and geopolitical events related to China: this may be a serious concern for risk-averse investors. The “dividend growth” denomination is inappropriate. Distributions have been flattish since 2007, even if 2022 was exceptional. In fact, the underlying index selects dividend stocks with expected earnings growth, not growing dividends.
For transparency, my equity investments are split between a passive ETF allocation (DNL is not part of it) and an actively managed stock portfolio, whose positions and trades are disclosed in Quantitative Risk & Value.
Be the first to comment