

Darren415
This article was first released to Systematic Income subscribers and free trials on July 11.
In this article, we take a look at the Western Asset Mortgage Defined Opportunity Fund (NYSE:DMO), trading at a 10% current yield and a 9.6% discount. The fund’s income stands to benefit from rising short-term rates as most of the portfolio is allocated to floating-rate securities while the fund’s leverage cost is fixed for a year. DMO also offers household credit exposure – a decent source of diversification for income portfolios which are likely overweight corporate credit risk. This is at a time when households are doing reasonably well with tight labor markets, decent wage growth and relatively clean balance sheets.
Quick Overview
The allocation profile of the fund is fairly unusual in that it primarily holds mortgage securities with a greater focus on residential mortgages. These securities are not the more common agency MBS which carry no credit risk. Rather, they are either legacy non-agency securities (i.e. those issued prior to the GFC) or CRT securities (issued by US housing agencies after the GFC to offload borrower credit risk). This allocation profile makes DMO fairly unique in the CEF space.
Franklin Templeton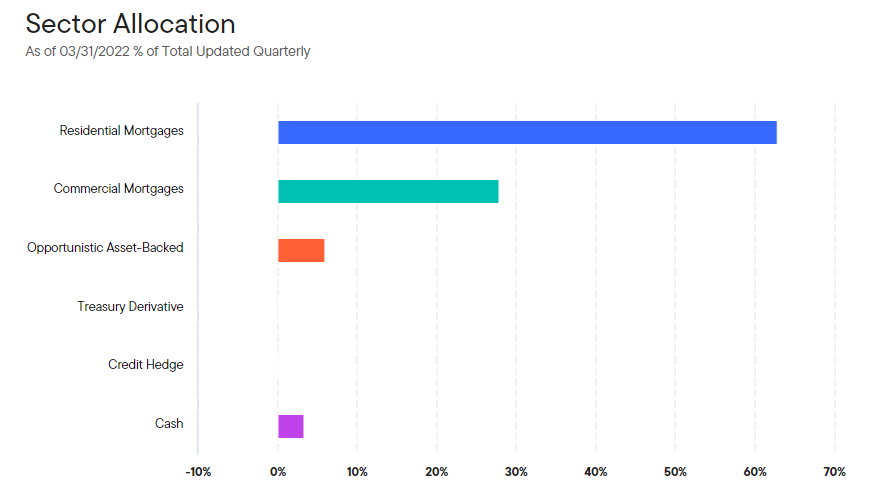
After the GFC, the US government looked for a way to derisk the business profile of its housing agencies and settled on the so-called CRT securities as a way to partially offload the household credit risk to the broader market. The schematic below shows how CRT securities work. The basic idea is that losses from mortgage defaults flow from the bottom-up with lower / higher-yielding tranches in the CRT structure absorbing losses first while the agency retains some skin in the game across the entire structure.
NB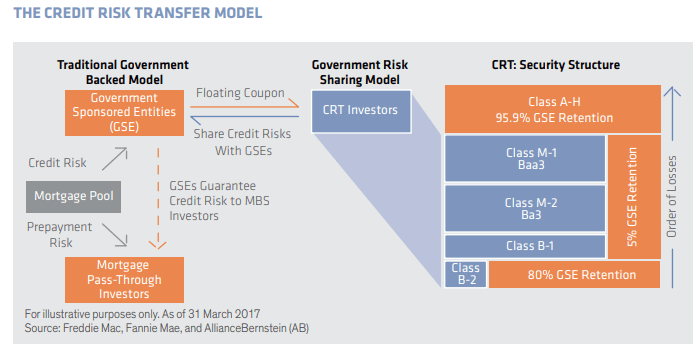
The legacy non-agency RMBS set of securities, on the other hand, are those that were mostly issued prior to the GFC. This market continues to shrink as it has been largely replaced by CRTs.
NB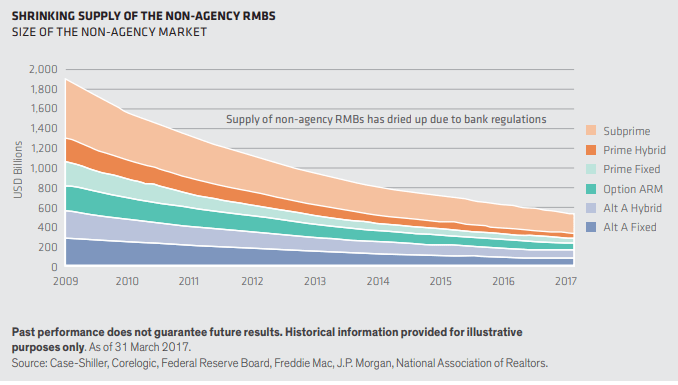
DMO holds both types of securities with the primary focus being residential mortgages, though there is some commercial exposure as well.
Household Economic Health Remains Robust
The bulk of risk in the DMO portfolio is linked to households. This aspect of the fund is an attractive one for two main reasons. First, most of the income market is linked to corporate credit risk so having another kind of risk in the portfolio can allow investors to diversify their ultimate sources of returns.
And two, households are in fairly decent economic shape so far, even if some leading indicators such as consumer confidence and retail sales have turned lower. For instance, the overall financial obligations as a percentage of disposable income is at a historically low level.
AB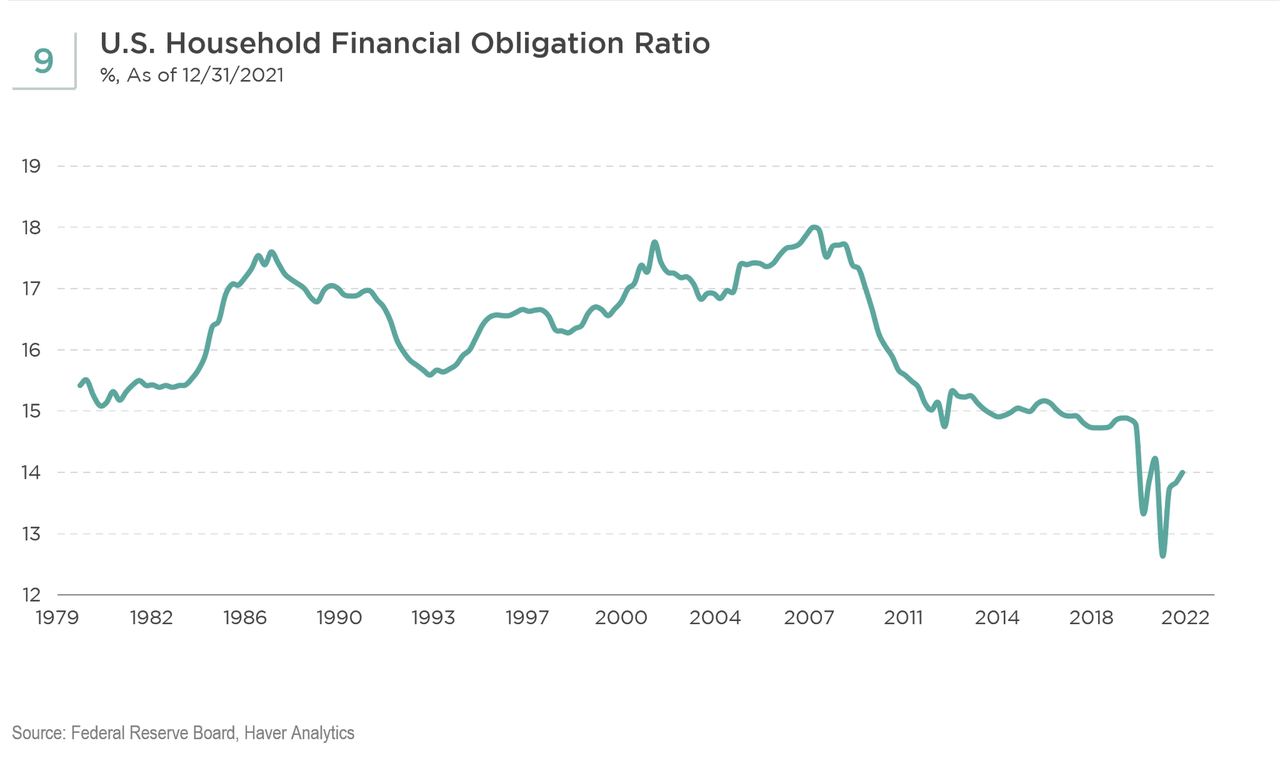
The labor market remains tight with more jobs available than people looking for work. Wage growth has been strong as well.
JPM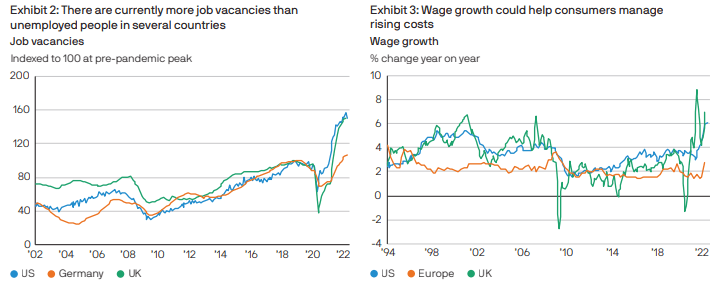
The recent rise in housing prices has pushed accumulated home equity to $25 trillion. High levels of home equity clearly reduces the risk of mortgages as it would mitigate the size of the loss, if any, on default. Excess savings of roughly $2.5 trillion also continue to provide buffers against rising food and energy costs.
A measure of consumer defaults is at low historical levels though it has begun to rise.
Bloomberg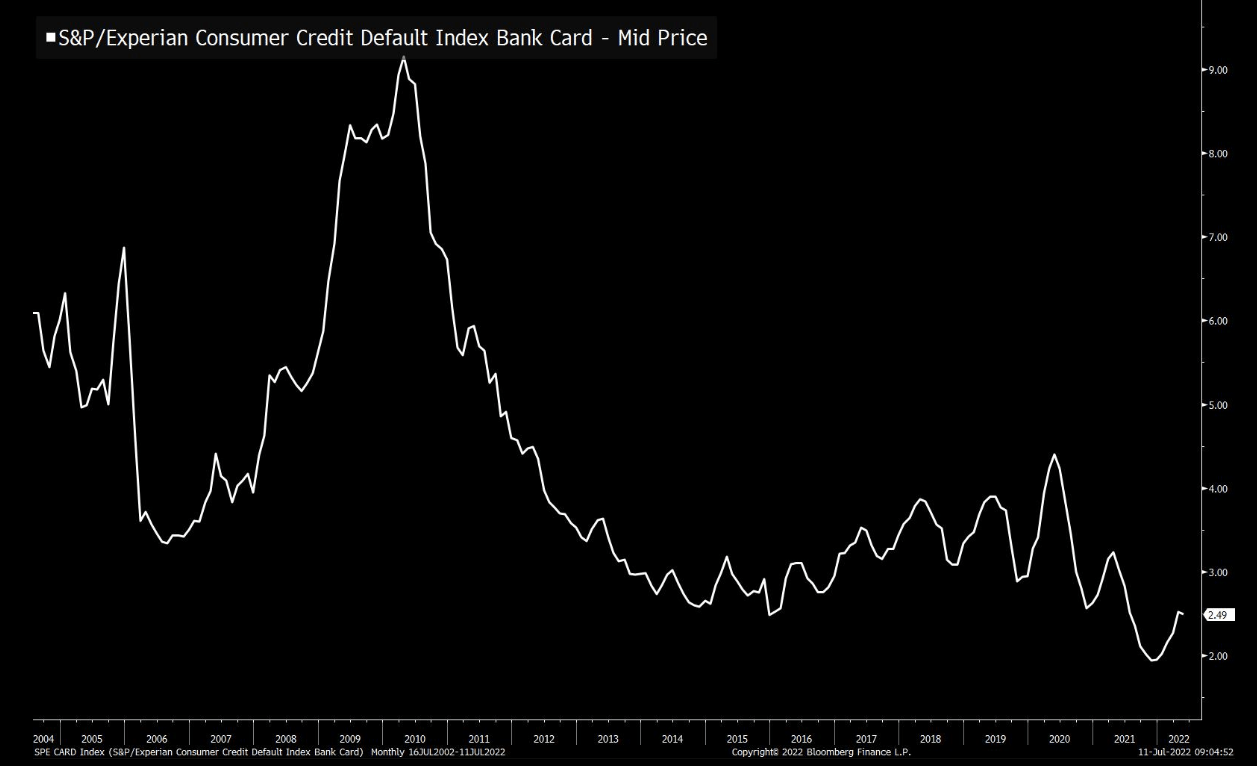
It is true that some stresses are appearing as delinquency levels in assets like subprime auto-backed loans in the lower income cohort are starting to rise. Foreclosures have also ticked up in Q1 though they remain at a low historic level.
Fed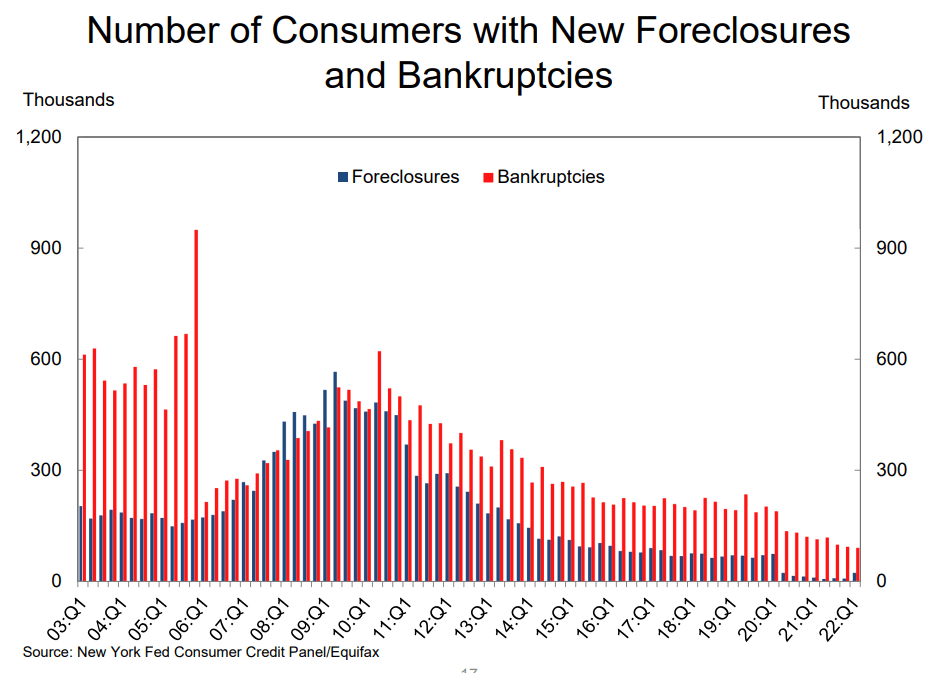
Overall, the economic picture for households is a decent one even if it is starting to deteriorate somewhat. The key point here is that valuations have, in our view, priced in a much more dire scenario than current data indicates. And even if data catches up with valuations, the current gap between valuations and current underlying losses is an unusually wide one, providing a significant margin of safety in case of future deterioration in fundamentals.
Income Profile
DMO has a very attractive income profile for the current environment. The fund does a good job breaking out its floating-rate holdings in its report which makes it easier to gauge how its fund profile will evolve in the near term.
First, about 80% of the fund’s net holdings are linked to short-term rates. In an environment of unusually sharp Fed rate hikes, this is an attractive element of the fund’s income profile. The 80% figure is net of a small number of inverse floating-rate securities whose coupons are inversely related to rates i.e. their coupons decrease when rates move higher.
Two, the fund’s floating rate assets are almost exclusively tied to 1-month Libor. This has two benefits. First, unlike 3-month Libor or 3-month term SOFR which is the primary base rate for most loans and preferreds, 1-month Libor (and its eventual replacement) resets monthly while 3-month floating-rates reset quarterly. This means that the fund’s income will more quickly reflect the Fed’s hiking trajectory. And while it’s true that 1-month Libor trades at a lower-level than 3-month Libor (due to the averaging of the rising Fed Funds rate), the two rates will converge once the Fed reaches the peak in its hiking rate.
Three, the predominant lack of Libor floors means the fund’s income trajectory is stronger with more of the rise in Libor getting passed through earlier. This is unlike the behavior of traded and private loans (i.e. those held by loan CEFs and BDCs) which only pass through the rise in Libor above the level of 0.5-1.5%. This means that DMO enjoyed a rise in its income pretty much from the start of the year.
Four, the fund did something very unusual and good in 2021 – it fixed its borrowing costs until May 2023 by moving from a floating-rate borrowing facility to a fixed-rate repo with an average rate of about 1.89%. To provide some context here – most taxable credit funds are paying over 3% on their borrowings (i.e. roughly 3M Libor + 0.8%) and this will continue to rise above 4% as the Fed’s policy rate is expected to move north of 3%.
Five, the fund has significantly increased its borrowings from the trough in 2020 which will clearly continue to add to its income. The fund’s relatively muted NAV drop this year of 9.8% is well below the 15.8% average of the Multi-sector space and about half of the PIMCO taxable suite. This low-beta NAV profile should allow the fund to maintain its borrowing profile rather than force it into a deleveraging, something we have already seen in the higher-octane PIMCO funds.
Six, the rise in short-term rates will normally put pressure on the borrower for the obvious reason that it increases the cost of borrowing. This means that, while floating-rate securities clearly benefit from the rise in short-term rates, their underlying quality typically worsens at the same time since higher coupons put additional stress on the borrower. However, in the case of the non-agency (i.e. private-label legacy RMBS securities issued by banks) and CRT securities (issued by US housing agencies Fannie Mae and Freddie Mac), the floating-rates are contractual and hedged out by the issuers. In short, we don’t expect the economic position of Freddie Mac to worsen all of a sudden because Libor has moved higher.
Finally, some loan borrowers may also find it advantageous to refinance or pay back the loan if they can either borrow at a lower spread over Libor or if they just don’t want to carry a higher interest expense and don’t have a strong need for the cash. CRTs, however, are not callable for 10 years which allows the lenders (i.e. DMO shareholders) to enjoy a potentially longer period of higher short-term rates.
Given the attractive features discussed above we need to deal with the elephant in the room which is that the fund’s net investment income has halved since its pre-COVID period and stands at an unimpressive 6.9% NAV NII yield. The fund’s distribution coverage is also relatively poor at around 70-75%.
The fund’s distribution profile also looks fairly grim with a steady downtrend over the last five years. The chart below clips special distributions at $0.3 for clarity to highlight the trend in the regular distribution.
Systematic Income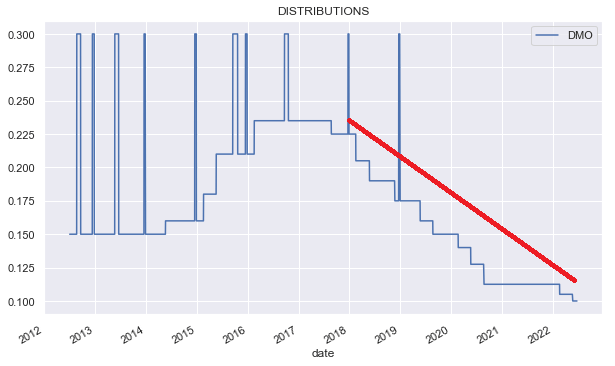
Let’s see if we can get a handle on this terrible distribution profile. To get a better sense of what’s going on let’s take a look at the recent downtrend in income (the Monthly NII row) shown in the table below which went from about $0.13 per quarter in 2019 to $0.07 as of Mar-2022. The fund’s current monthly distribution is $0.10.
Systematic Income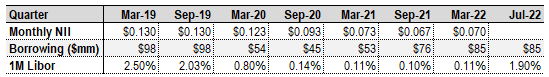
There are two key things that explain the steady downtrend in the fund’s income over this period in our view. The first is the fact that Libor went from 2.5% to near zero. And the second is that the fund’s borrowings were cut nearly in half by Q1-2021.
The fact that Libor has a strong impact on the fund’s income and distribution profile can also be seen in the chart above. Specifically, between 2014 and 2018, the fund’s distribution increased by 50%. This was the same period in which Libor went from close to zero to around 2.5%.
What makes us fairly upbeat about the fund’s income profile is that first, Libor is expected to peak above 3% this time around. And two, the fund’s borrowings have retraced to a level that is not all that far from before its deleveraging in 2020.
When we put all the pieces together what we see is that today (i.e. at 1M Libor of around 1.8%) the fund’s estimated monthly net income is closer to $0.093 (rather than $0.07 as of Q1) – giving us NAV NII yield of 8.4% and distribution coverage around 93%. When Libor rises to 3% the fund should be earning closer to $0.111 or a NAV NII yield of 10.1%. This would put the fund’s coverage north of 100%.
Systematic Income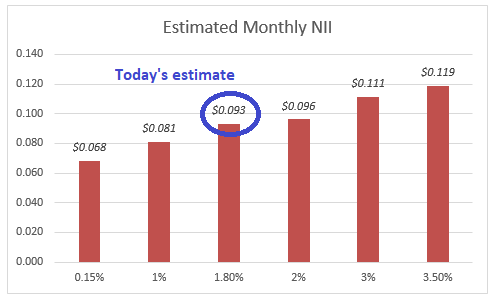
What is, perhaps more relevant, is that, once we take the fund’s wide discount into account, its covered yield (i.e. net investment income yield on price) is even higher due to the fund’s wide discount. We estimate its covered yield is currently closer to 9.4% and should rise to 11.2% at 1M Libor of 3%.
Taking a quick look at valuation – on this basis DMO also looks attractive. Its discount remains significantly wider of the sector average. Despite its outperformance this year and floating-rate profile, the discount differential against the sector has only widened this year, creating an attractive entry point in our view.
Systematic Income CEF Tool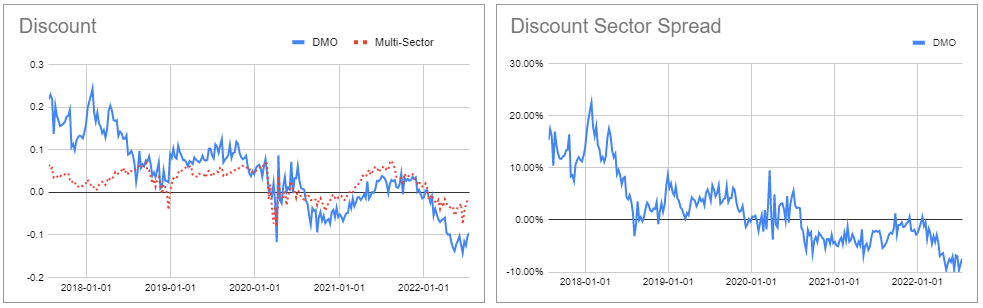
Takeaways
Overall, DMO presents an attractive choice in the multi-sector credit space for income investors. Its household risk profile is a diversifier in most income portfolios which are likely overweight corporate credit risk, at a time when housing equity is high and household balance sheets are relatively clean. The fund’s floating-rate profile will benefit from rising short-term rates (without putting a strain on the issuers of its holdings or households who are primarily in fixed-rate mortgages). Finally, its fixed leverage cost and attractive valuation offer additional arguments for an allocation.
One thing to watch out for investors is that DMO did not manage the COVID period very well, undertaking a kind of fire-sale forced deleveraging at the worst possible time, something we documented at the time. In our view, the current environment of a steady grind lower in risky assets makes the fund less susceptible to a similar outcome; however, this risk factor should be kept in mind.
Be the first to comment