

PM Images
Inflation came in hotter than expected, but the markets surprisingly rebounded, only to see a significant portion of Thursday’s gains washed away as the S&P 500 closed down -1.64% on the week. Over the past 3 weeks, the Dividend Harvesting Portfolio has gone from being down -12.65% (-$1,050.35) in week 83 to down -11.56% (-$971.36) in week 84 and finishing week 85 -11.19% (-$951.11). 2022 hasn’t been a great investment environment for capital appreciation as the S&P 500 is -25.30% on the year, but I believe it’s been a great environment for building long-term portfolios as many companies are trading at discounts. There are many opportunities for income investors to build out long-term positions in equities that have long track records of paying dividends while providing annual increases to their shareholders. I don’t know when the markets will rebound, but I will continue to happily allocate capital each week to build out the Dividend Harvesting Portfolio at lower valuations than I was paying this time last year.
At the end of week 85, the Dividend Harvesting Portfolio closed with an account value of $7,548.89. Its annual projected income increased to $622.75, which is a forward yield of 8.25%. 11 positions generated $22.54 in dividend income throughout week 85, and so far, I have collected $355.36 from 409 individual dividends, which have been reinvested throughout 2022. In week 85, I utilized the weekly allocated capital to increase my position in Verizon (VZ), Medical Properties Trust (MPW), New York Community Bancorp (NYCB), and National Retail Properties (NNN). I wrote a dedicated article last week on NNN (can be read here) and MPW (can be read here), outlining why I am still bullish on these REITs.
Steven Fiorillo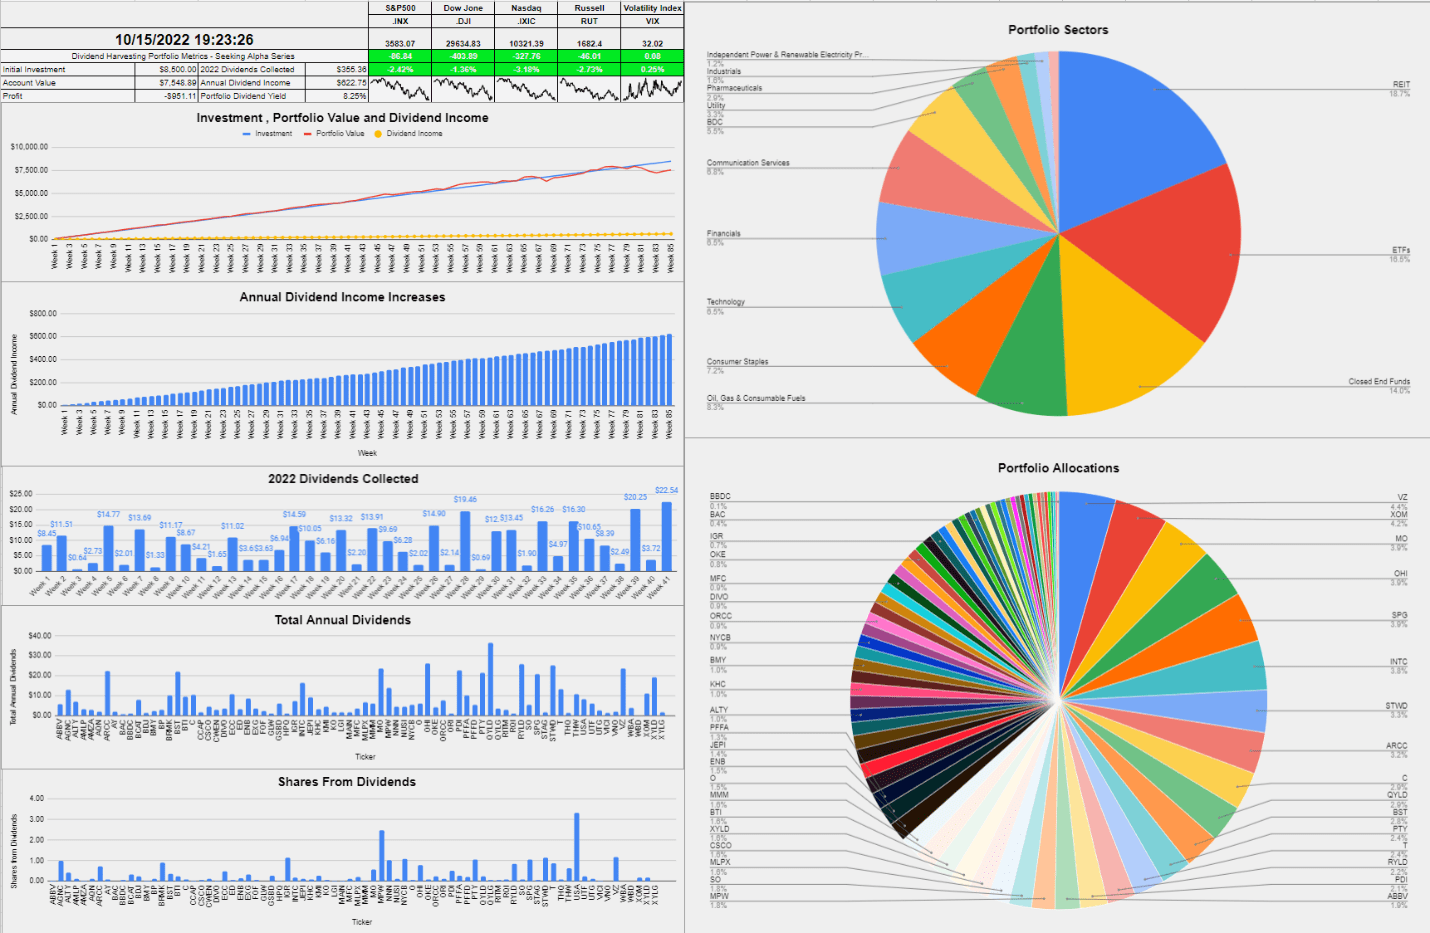
I allocate capital toward big tech, funds, dividends, and growth outside of my retirement accounts. These are not my only investments, but I did open a separate account, so I could easily track and document this series. I intentionally created broad diversification throughout the Dividend Harvesting portfolio so I could benefit from sector rotations and mitigate my downside risk. Investors who are too exposed to growth companies or large-cap tech have gotten crushed as the investment landscape changes. On the growth and tech side of my investments, I am feeling the pain as some of my favorite companies, including Alphabet (GOOGL) (GOOG), Amazon (AMZN), and Meta Platforms (META), have been taken to the woodshed.
I am going to address a question that continues to surface. I am not trying to beat the market with this portfolio. I love index funds and am invested in several index funds. I love dividend investing due to the stream of cash flow it generates. I don’t want 100% of my assets outside of real estate tied to an S&P index fund. I have created a personal investment strategy that works to achieve my investment goals, and having a stream of income generated from dividends is part of my investment strategy. Low-cost index funds are one of the best investments anyone can make in my opinion, and the Dividend Harvesting portfolio is not meant to be a substitute for an index fund. I have read many questions about dividend investing and wanted to start a portfolio from the ground up and document its progress to disprove many misconceptions, including that you need a large amount of seed capital to make dividend investing work for you.
This series has never been about hitting a target yield, generating a certain amount of profit, or beating the market. I had two specific goals with this series. The first was to create a blueprint for constructing a dividend portfolio by documenting the journey starting from the beginning. The second goal was to illustrate how allocating capital each week toward investing, regardless of the amount, would be beneficial in the long run.
Too many people are under the illusion that you need tens of thousands or even hundreds of thousands to benefit from investing. Instead of using my real dividend portfolio as an example, I decided to start a new account, fund it with $100, and add $100 weekly, providing a step-by-step guide to dividend investing. This methodology doesn’t have to be used for dividend investing, and it could be as simple as an S&P index fund or a Total Market fund. Hopefully, this series is inspiring people to invest in their future to attain financial freedom.
A Historical Recap of the Dividend Harvesting Portfolio’s Investment Principles and Historical Performance
Investment Objectives
- Income generation
- Downside mitigation through diversification
- Capital appreciation
Below are the fundamental rules I have put in place for this Portfolio:
- Allocate $100 weekly to this Portfolio
- Only invest in dividend-producing investments
- No position can exceed 5% of the Portfolio
- No sector can exceed 20% of the Portfolio
- All dividends & distributions are to be reinvested
Below is a chart that extends from week 1 through the current week to illustrate the Dividend Harvesting Portfolio’s Progression
- Blue line is my initial investment $100 in week 1, $1,000 in week 10, etc.
- Red line is the account value at the end of each week
- Yellow line is the annual dividend income the Dividend Harvesting Portfolio was projected to generate after that week’s investments and dividends reinvested
Steven Fiorillo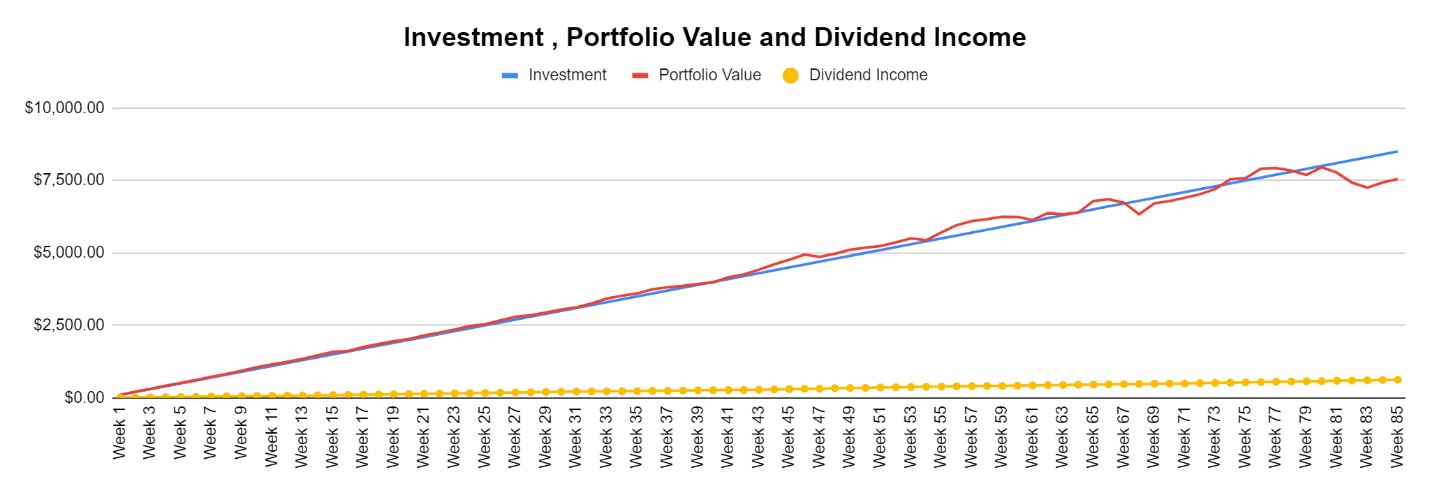
The Dividend Harvesting Portfolio Dividend Section
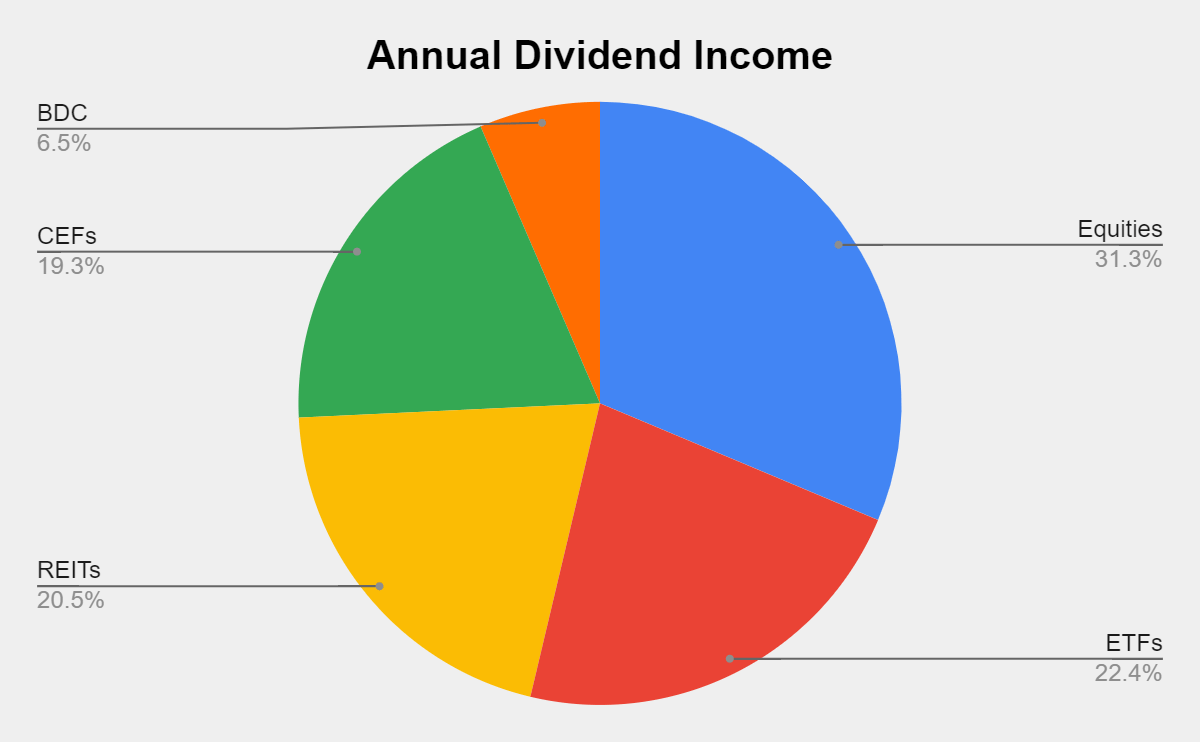
There is no longer an ETN section of the portfolio, and I am not sure if I will be adding ETNs again. Here is how much dividend income is generated per investment basket:
- Equities $195.07 (31.32%)
- ETFs $139.40 (22.38%)
- REITs $127.91 (20.54%)
- CEFs $120.01 (19.27%)
- BDC $40.36 (6.48%)
Steven Fiorillo Steven Fiorillo 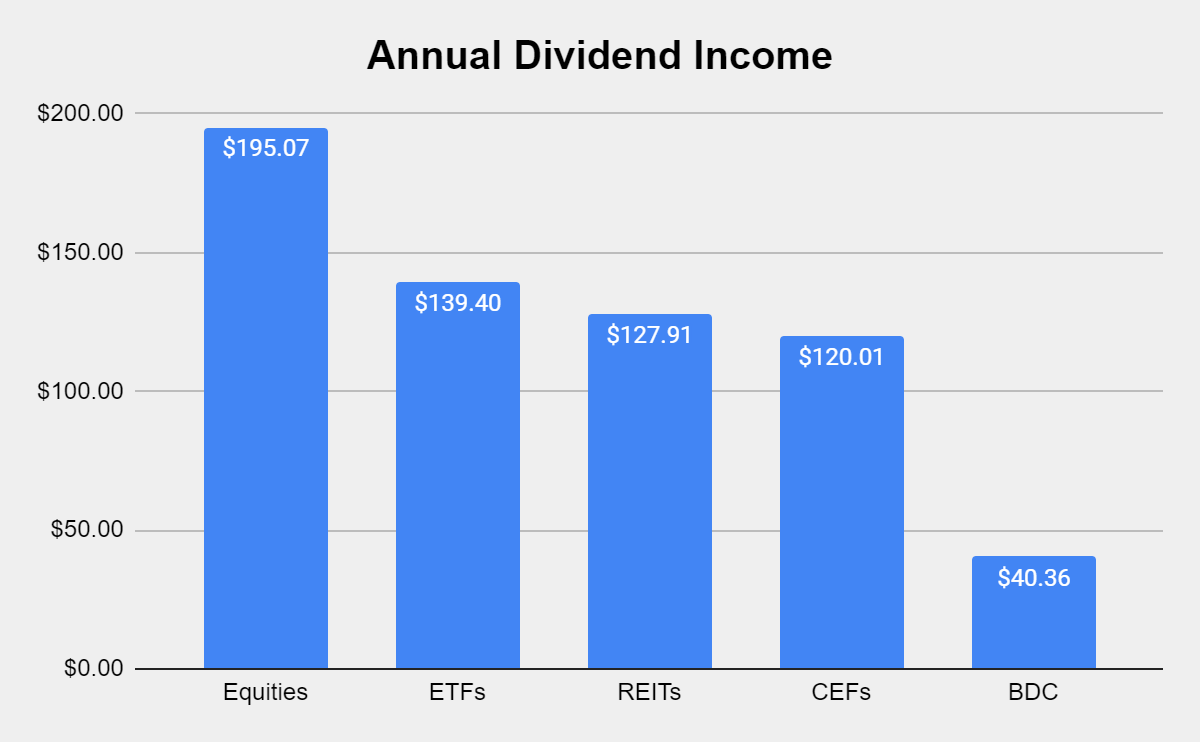
Collecting dividends can serve many functions in a portfolio. Some investors utilize dividends to supplement their income and live off. I am building a dividend portfolio for myself 30 years into the future. Since I am reinvesting every dividend, they serve multiple purposes today. In 2022 alone, I have collected $335.36 in dividend income from 409 dividends across 41 weeks. This has allowed the Dividend Harvesting portfolio to stay in the black while growing the snowball effect.
These dividends allow me to gain additional equity in my investments while increasing my future cash flow in down markets. This style of investing isn’t for everyone, but if you’re looking to generate consistent cash flow while mitigating downside risk, this method has worked for me. I am hoping to collect between $450 and $500 in dividends in 2022, which will be reinvested, and finish the year generating >$700 in annual dividends.
Steven Fiorillo 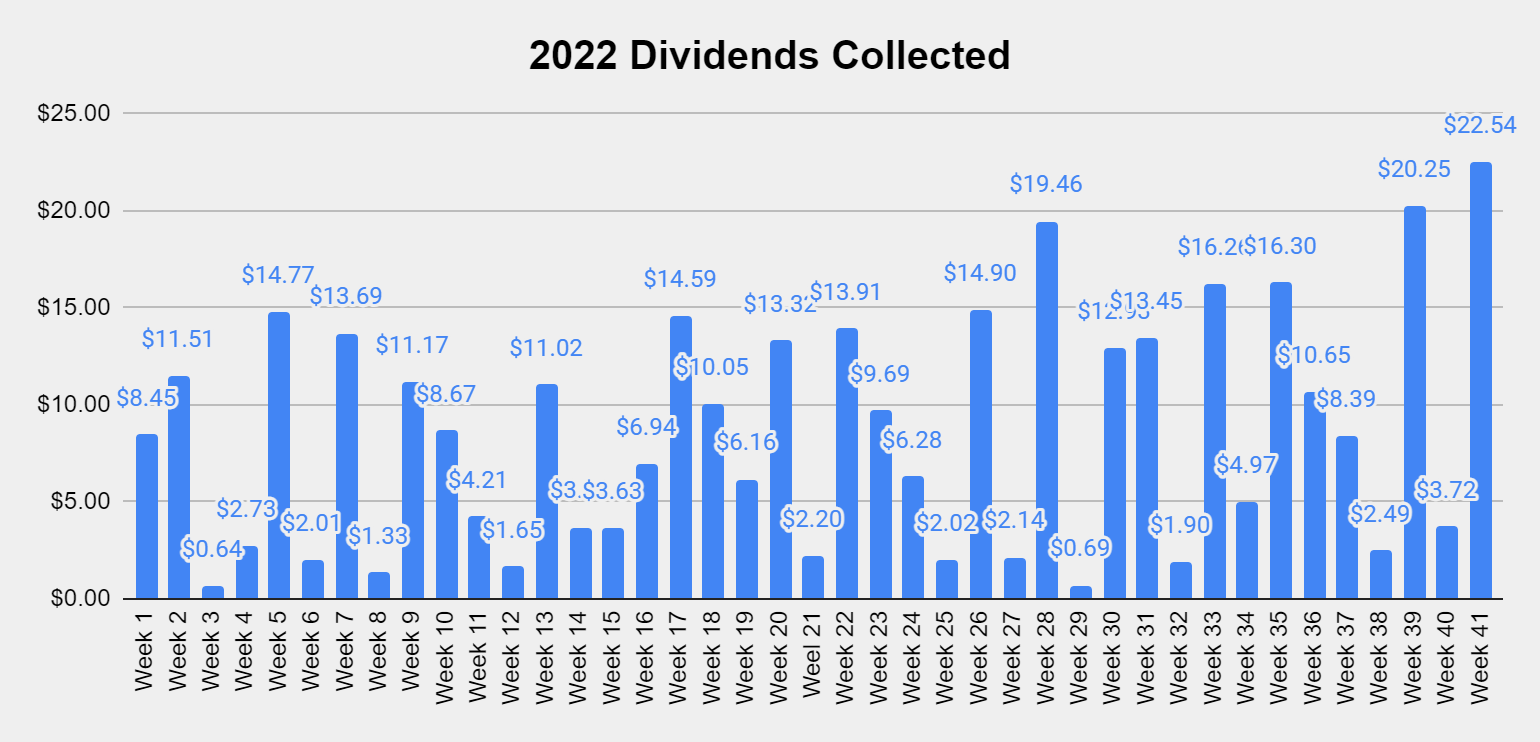
This next chart illustrates my monthly YoY dividend income progression. Since I started this series in April of 2021, that is where the dividend income starts, illustrated by the blue bars. My dividend income has increased substantially as April’s income has grown by 886.2% YoY, March 585.52% YoY, June 476.52% YoY, July’s 254.25% YoY, and August 247.13%.
The month of September just finished, and I collected $47.96 in dividend income. This is a YoY increase of $35.45 or 283.37%.
Steven Fiorillo 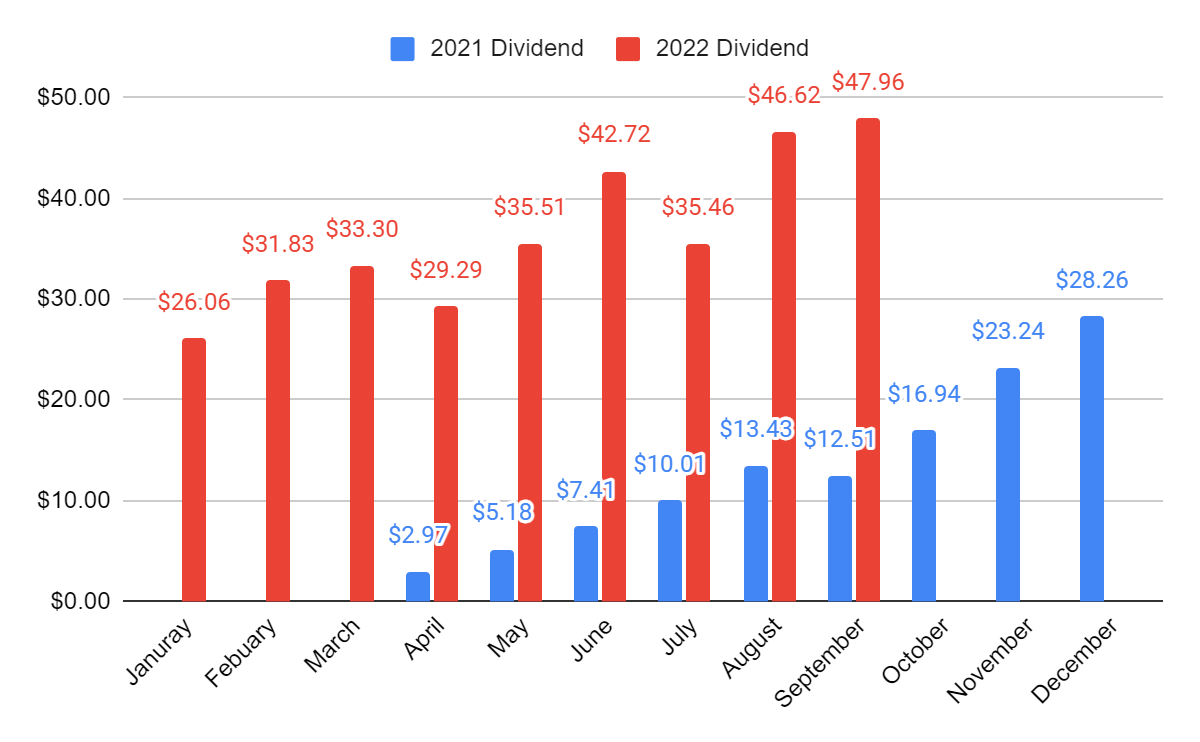
The Dividend Harvesting Portfolio is producing 588 annual dividends. I am not expecting this to change as I am focusing on dollar cost averaging on current positions.
Steven Fiorillo 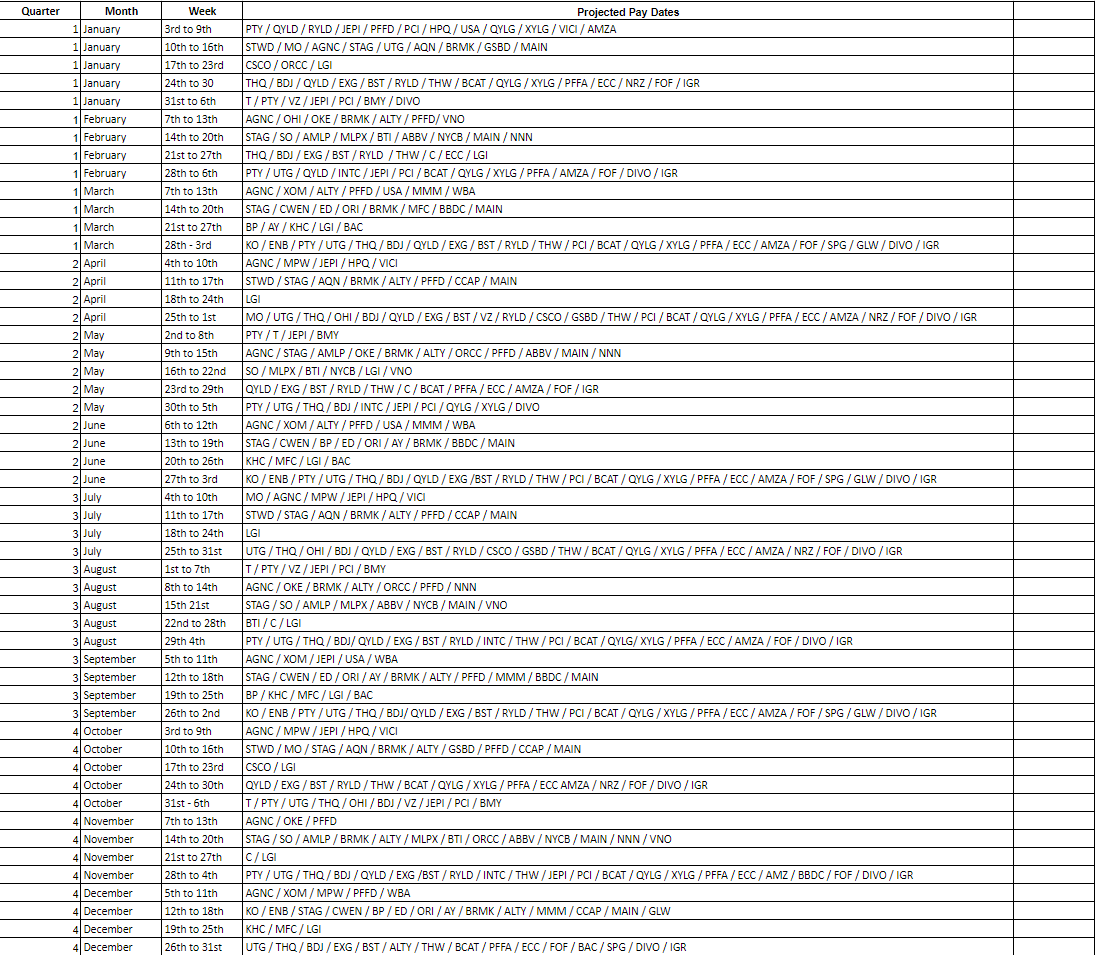
The goal of generating enough income from the dividends to purchase an additional share per year has been the never-ending project of this portfolio. There are now 12 total positions generating at least 100% of their share value in dividends within the Dividend Harvesting portfolio. This could fluctuate due to market volatility, but I am looking to have as many positions generating at least 1 share annually from their dividends as I can.
Steven Fiorillo 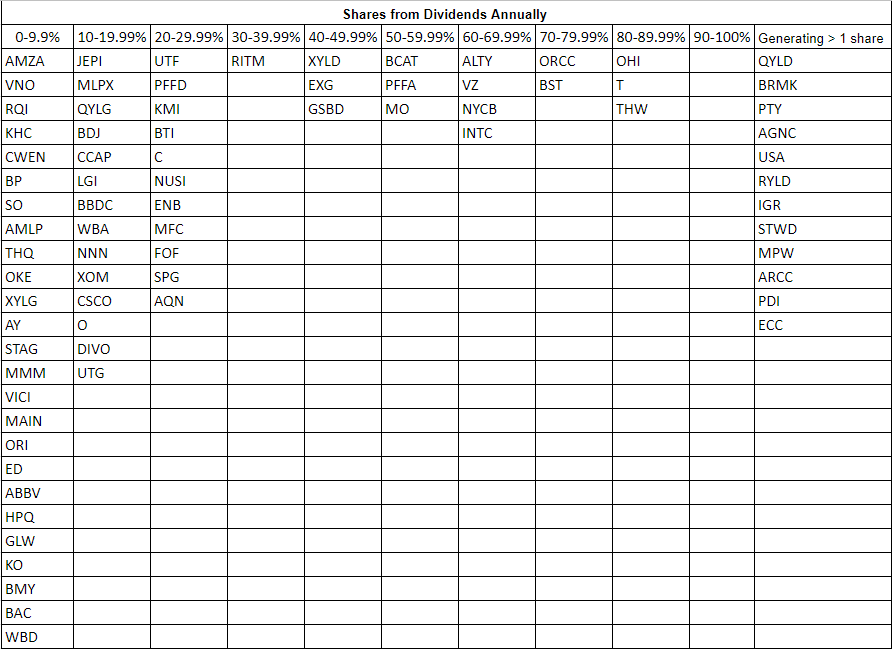
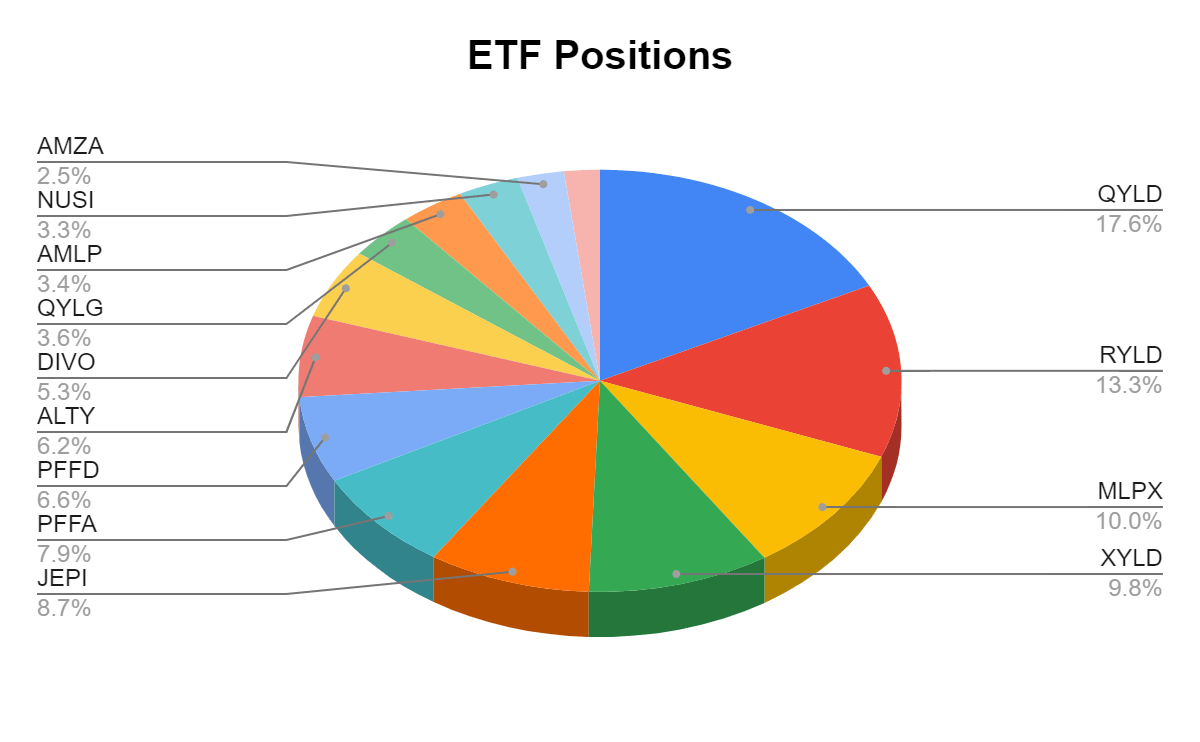
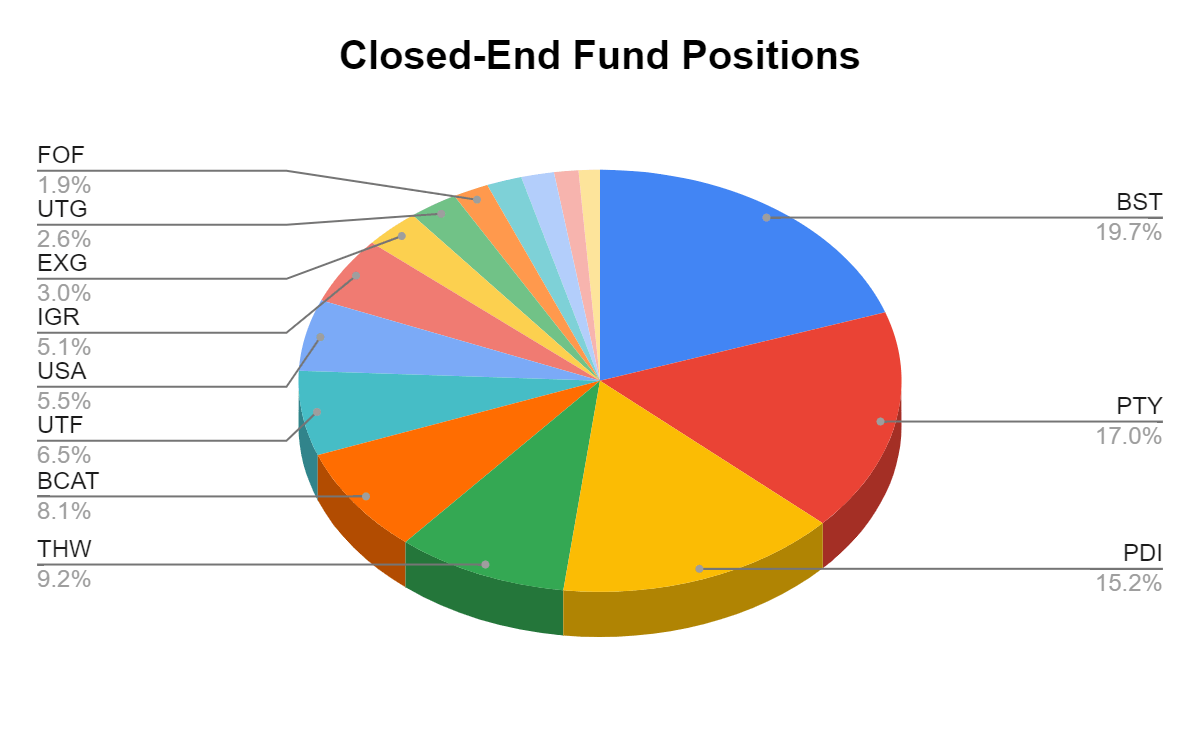
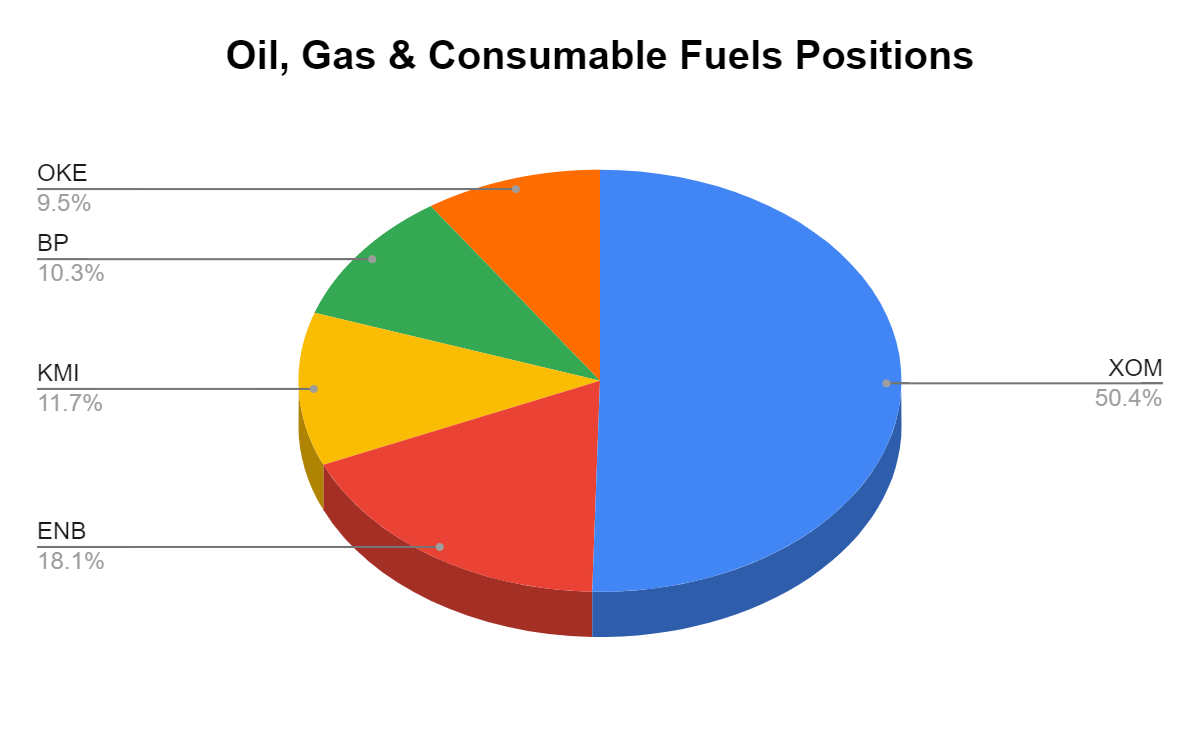
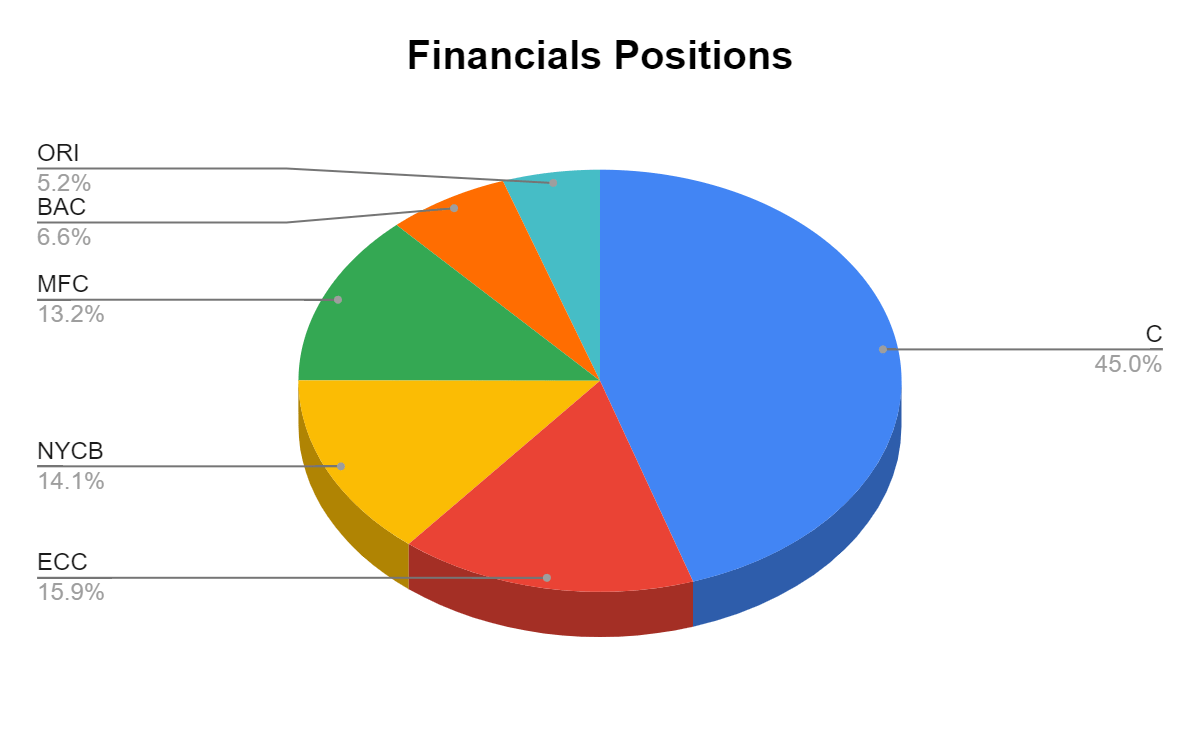
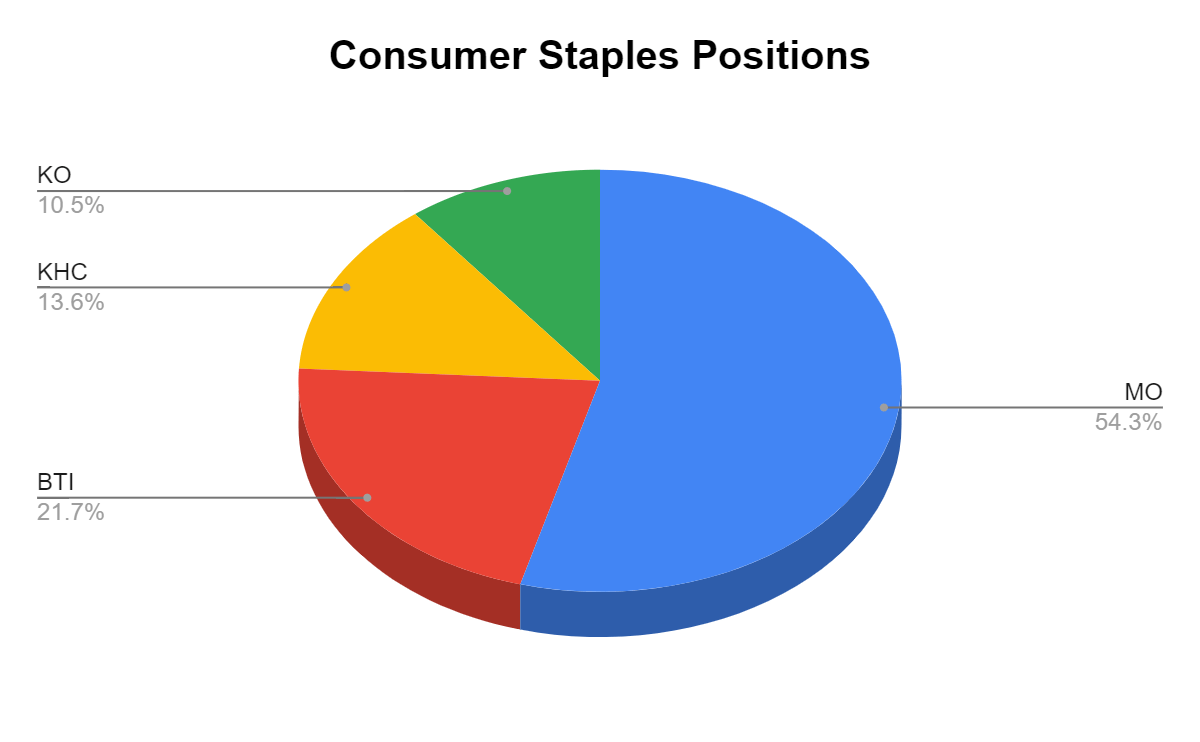
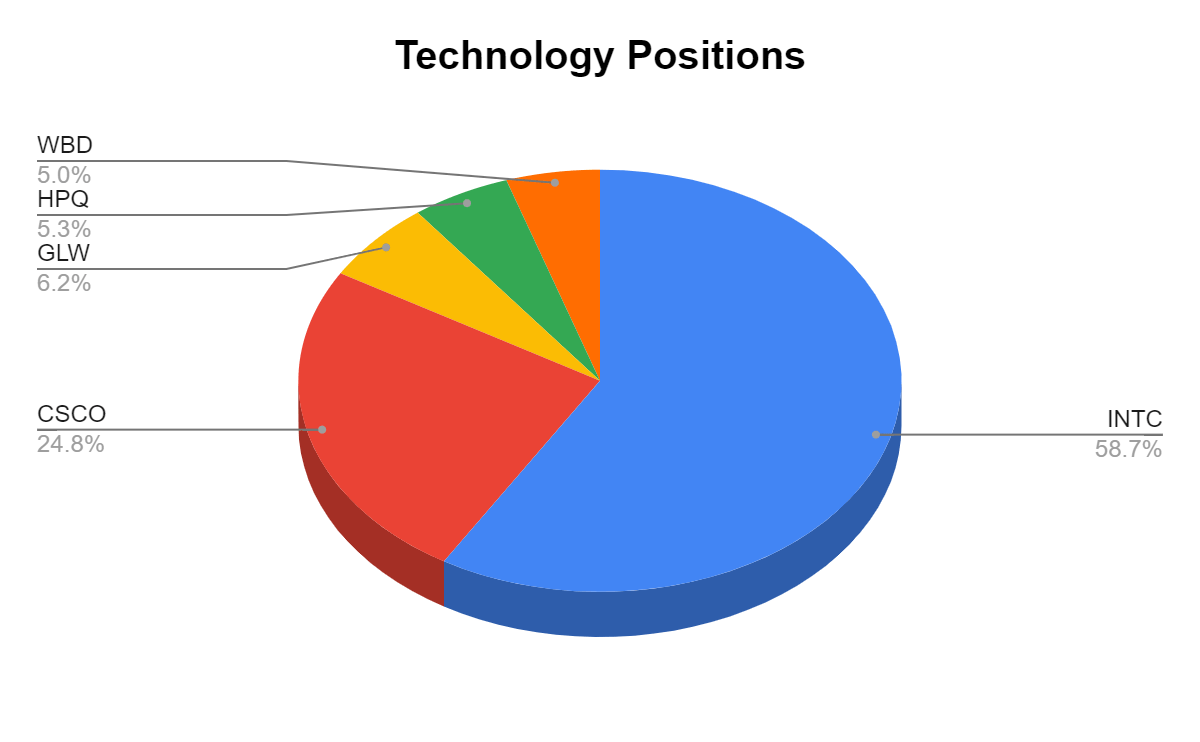
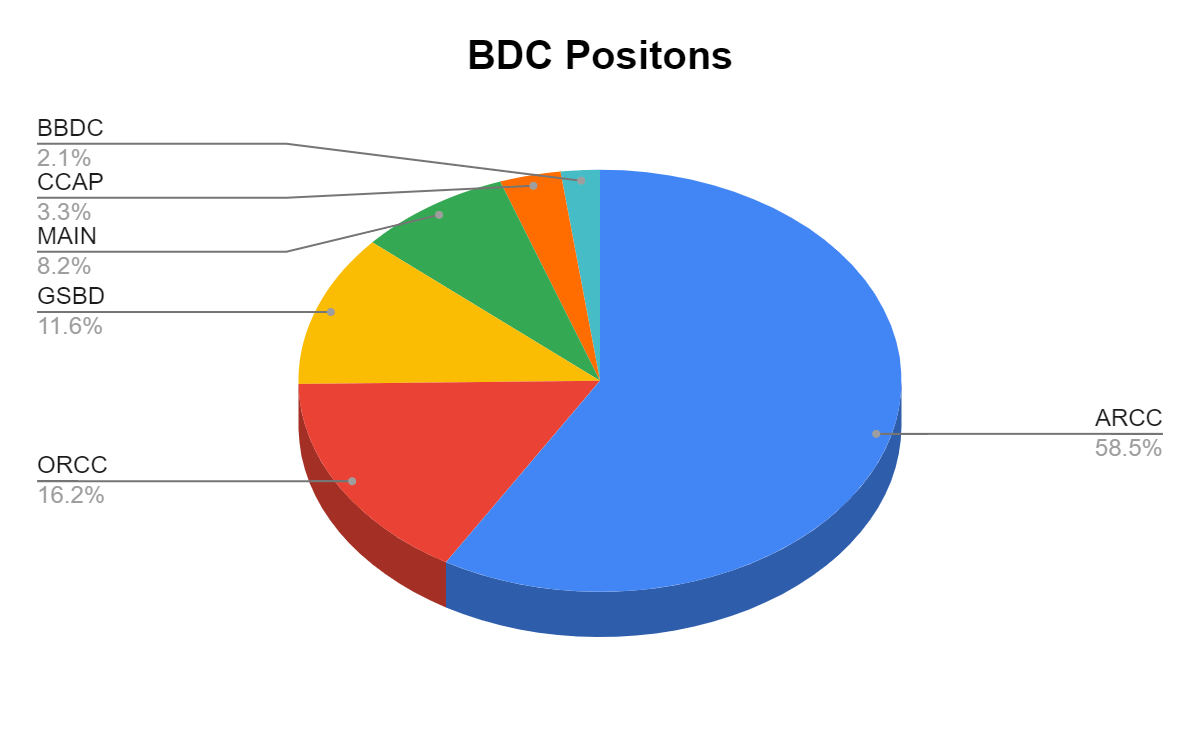
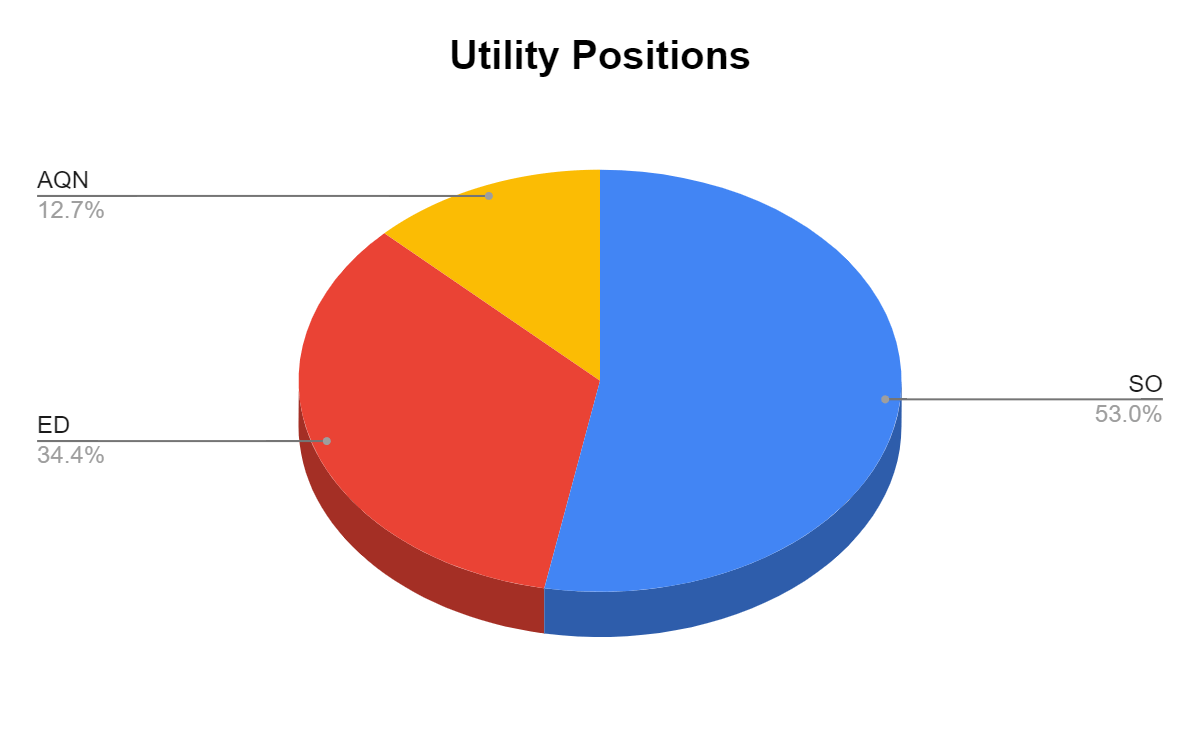
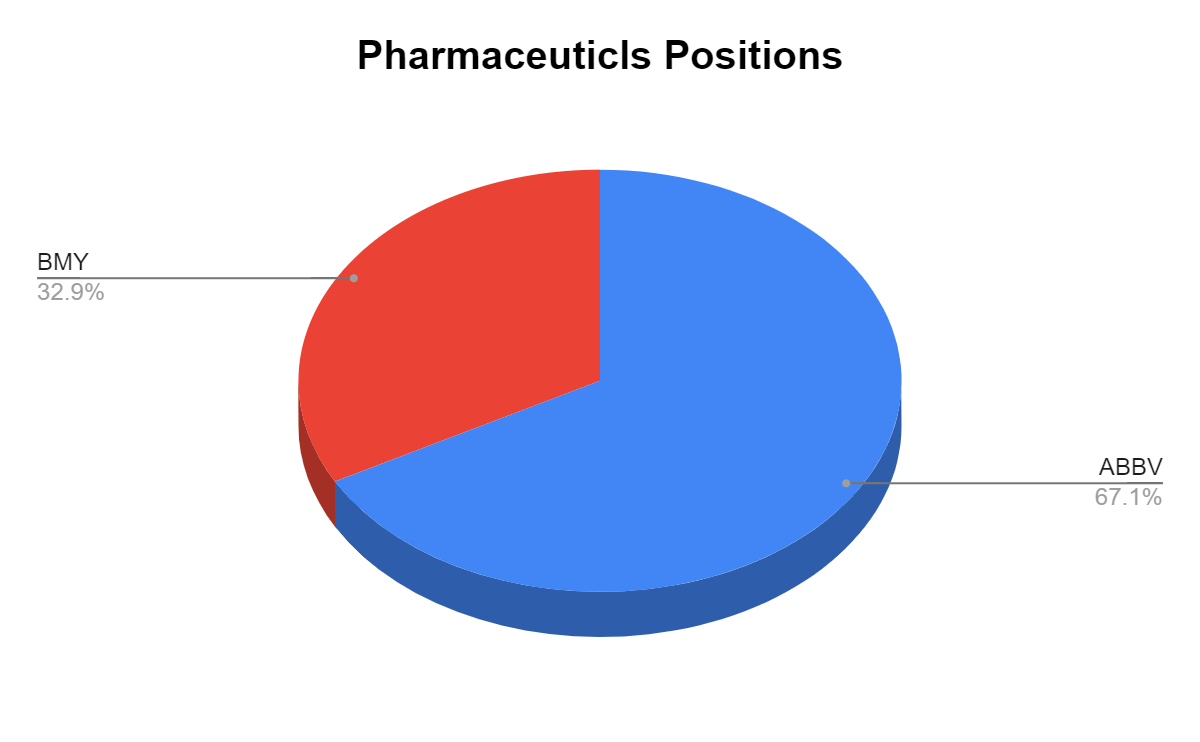
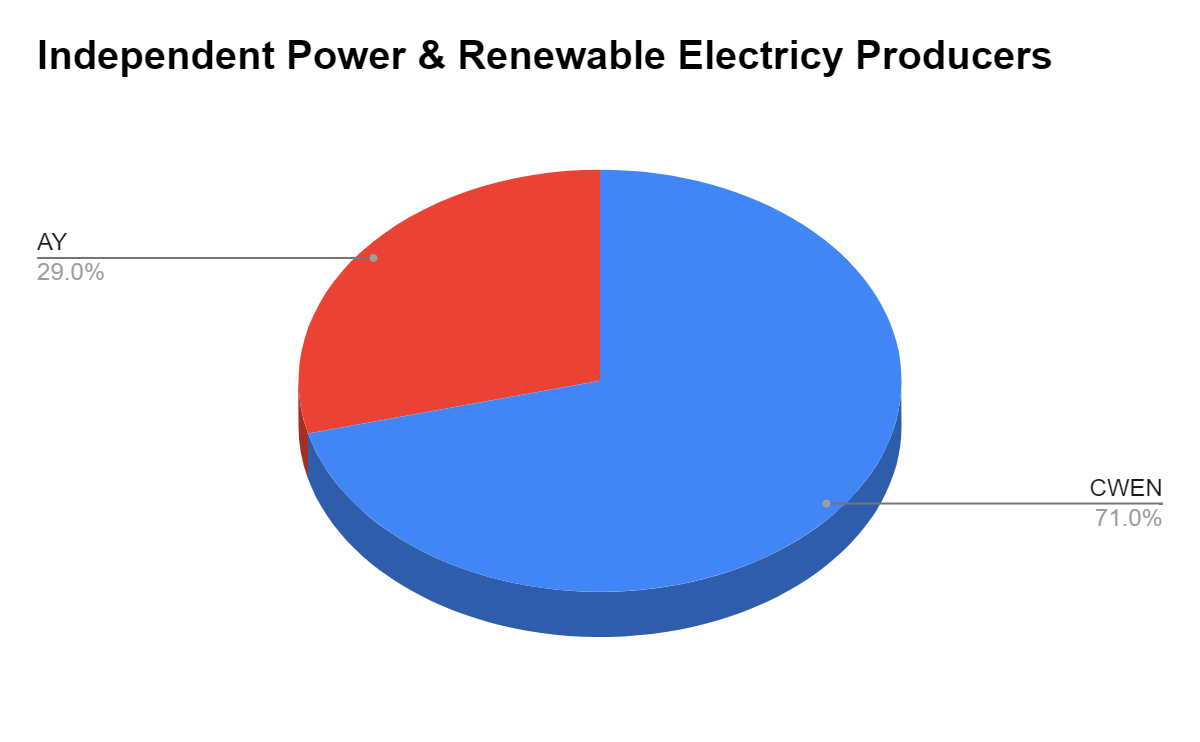
The Dividend Harvesting Portfolio Composition
Many of the readers have asked if I could break down the individual positions within these sectors. I created pie charts for each individual sector and have illustrated how much each position represents of that sector of the Dividend Harvesting portfolio. Since I only have 1 position in Food & Staple Retailing and Industrials, I did not make a chart for those. 3M (MMM) and Walgreens Boots Alliance (WBA) represent 100% of those sectors. The charts will follow the normal portfolio total I have constructed. Please keep the ideas coming, as I am happy to add as much detail to this series as I can.
Steven Fiorillo 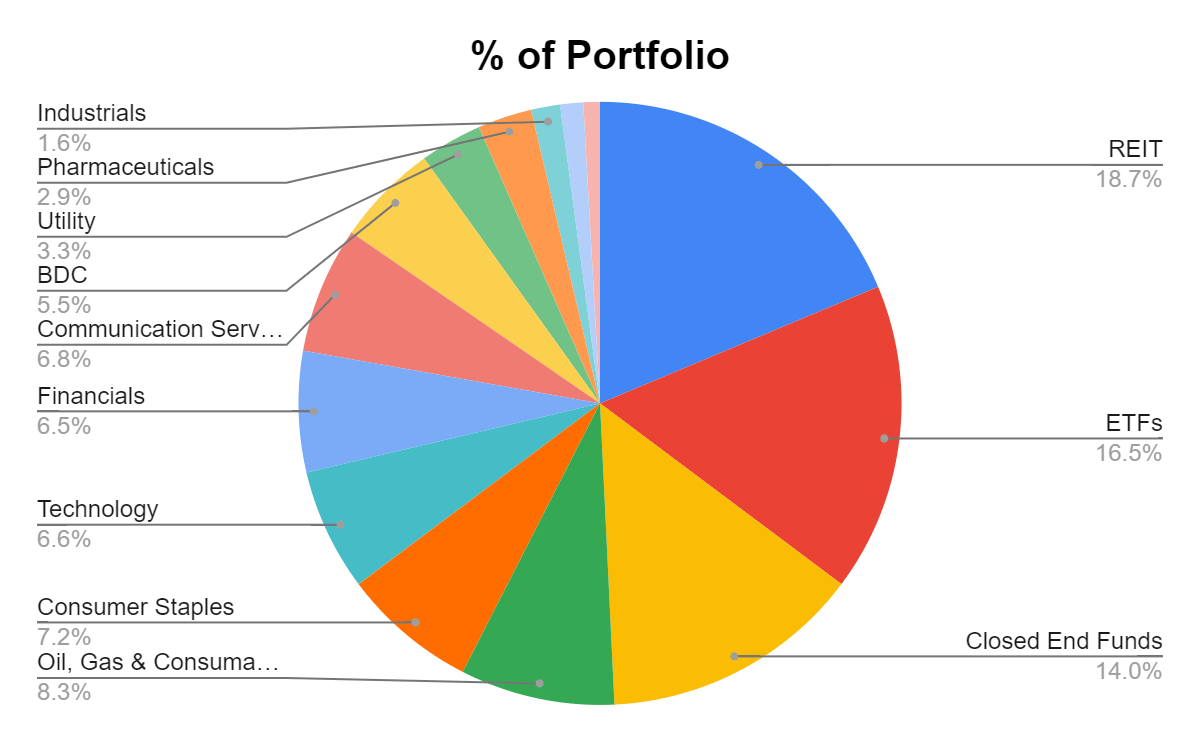
In week 85, REITs remained the largest segment and grew a bit closer to my 20% threshold for an individual sector weight within the Dividend Harvesting Portfolio. Individual equities make up 45.25% of the portfolio and generate 31.32% of the dividend income, while ETFs, CEFs, REITs, BDCs, and ETNs represent 54.75% of the portfolio and generate 68.68% of the dividend income. I have a 20% maximum sector weight, so when a singular sector gets close to that level, I make sure capital is allocated away from that area to balance things out. In 2022, I will make an effort to even out these portfolio percentages. As more capital is deployed, the bottom half of the portfolio weighting will increase.
|
Industry |
Investment |
Portfolio Total |
% of Portfolio |
|
REIT |
$1,410.02 |
$7,548.89 |
18.68% |
|
ETFs |
$1,248.58 |
$7,548.89 |
16.54% |
|
Closed End Funds |
$1,057.39 |
$7,548.89 |
14.01% |
|
Oil, Gas & Consumable Fuels |
$625.12 |
$7,548.89 |
8.28% |
|
Consumer Staples |
$546.67 |
$7,548.89 |
7.24% |
|
Technology |
$494.36 |
$7,548.89 |
6.55% |
|
Financials |
$489.42 |
$7,548.89 |
6.48% |
|
Communication Services |
$512.34 |
$7,548.89 |
6.79% |
|
BDC |
$415.00 |
$7,548.89 |
5.50% |
|
Utility |
$251.49 |
$7,548.89 |
3.33% |
|
Pharmaceuticals |
$219.26 |
$7,548.89 |
2.90% |
|
Industrials |
$117.38 |
$7,548.89 |
1.55% |
|
Independent Power & Renewable Electricity Producers |
$93.11 |
$7,548.89 |
1.23% |
|
Food & Staple Retailing |
$66.91 |
$7,548.89 |
0.89% |
|
Cash |
$1.33 |
$7,548.89 |
0.02% |
Steven Fiorillo Steven Fiorillo Steven Fiorillo Steven Fiorillo Steven Fiorillo Steven Fiorillo Steven Fiorillo Steven Fiorillo Steven Fiorillo Steven Fiorillo Steven Fiorillo Steven Fiorillo 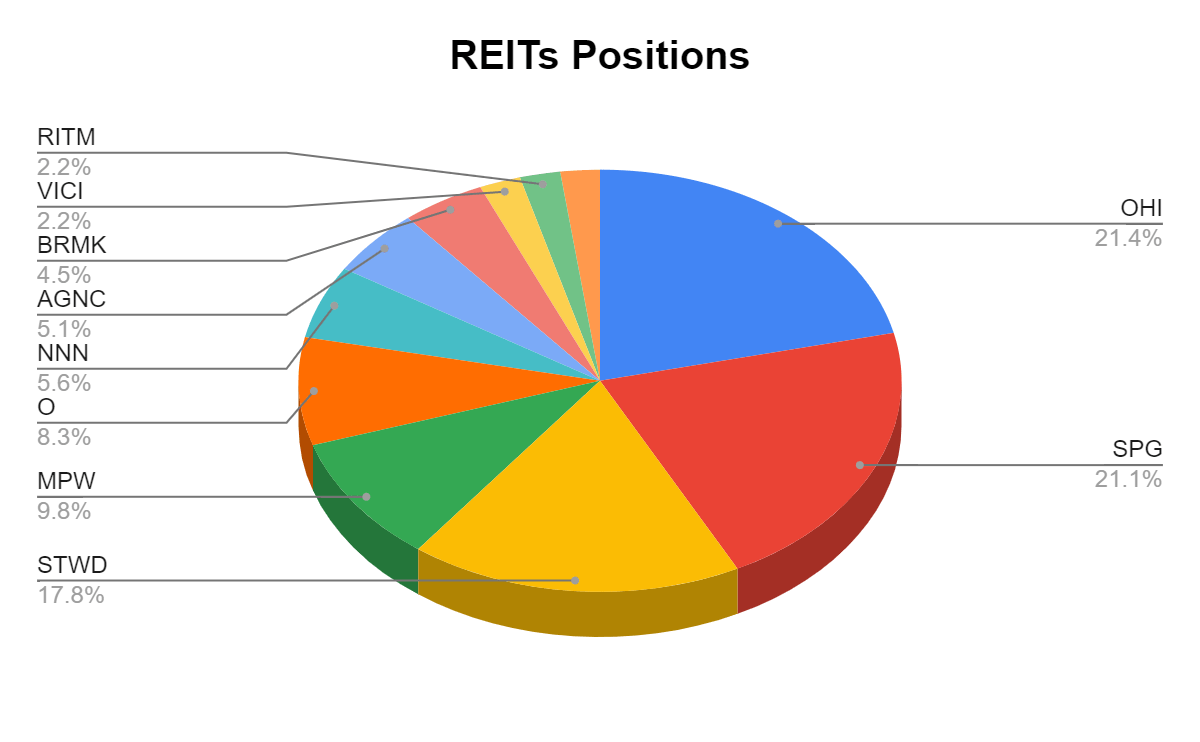
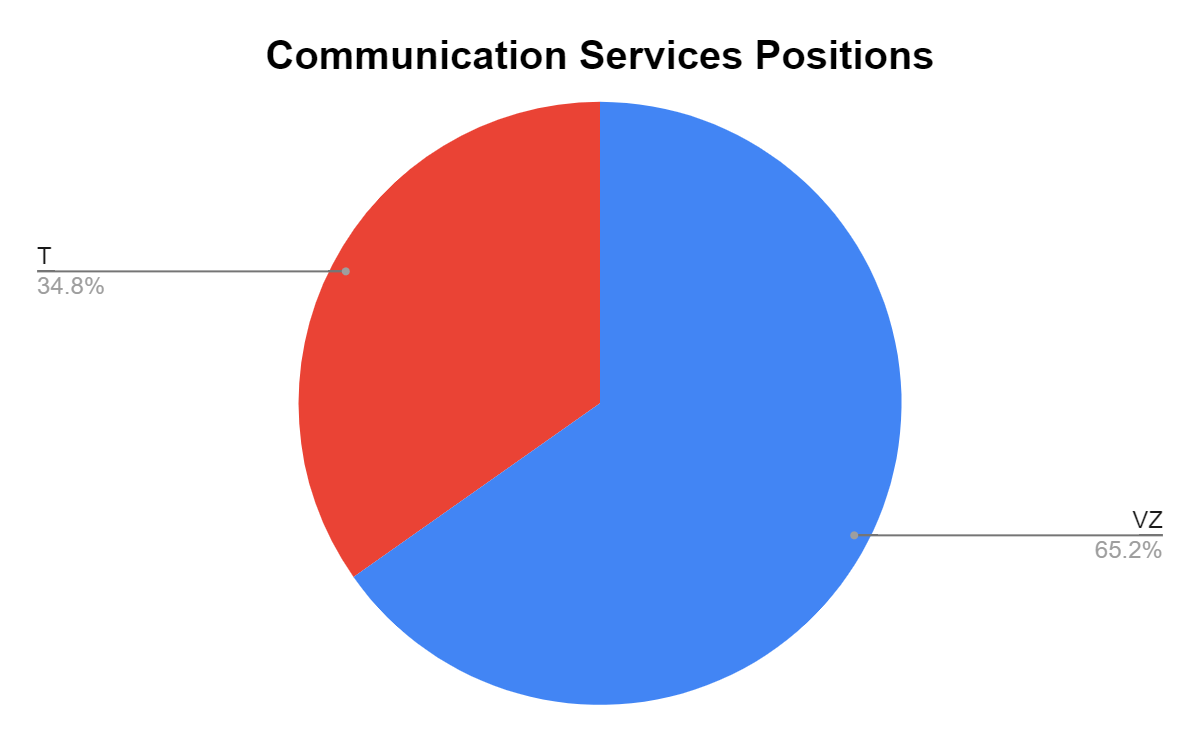
In week 85, VZ regained the top spot as my largest position in the Dividend Harvesting Portfolio. I really didn’t want to add another share to VZ at this time, but with as low as it dropped, I was compelled to add to the position. The portfolio has become a bit more top-heavy, and I will do my best to try and even things out a bit in the coming weeks.
Steven Fiorillo 
Week 85 Additions
In week 85, I used the $100 of allotted capital to increase my position in the following companies:
- Verizon
- New York Community Bancorp
- Medical Properties Trust
- National Retail Properties
Verizon
- VZ has declined by -30.63% in 2022, pushing its yield to 7.17%. VZ has increased its dividend for 18 consecutive years, and has a 47.58% payout ratio. VZ is currently trading at 10.40x its free cash flow (FCF) and it was very hard for me not to add a share at these levels. I will probably add another share of VZ prior to the end of the year, but I do want to try and balance out the upper end of the Dividend Harvesting Portfolio before I do.
New York Community Bank
- NYCB reports earnings on 10/26 and I have a feeling that the rising rate environment will be good for NYCB. NYCB yields 7.96% and has a payout ratio of 52.71%. I plan on adding a few more shares while it’s still undervalued. NYCB trades at a -37.02% discount to book and has an equity-to-market cap ratio of 171.42x.
Medical Properties Trust
- Well, I have been wrong on MPW the entire way down, but I am still adding shares. Like many other contributors on Seeking Alpha, I believe MPW is grossly undervalued. MPW is now yielding 10.68%, and I will continue to add shares until it appreciates enough that it’s yield no longer exceeds 7%.
National Retail Properties
- REITs have gotten crushed during the rate hikes, and NNN has significantly declined. NNN is yielding 5.71% and has provided 33 years of consecutive dividend increases. NNN has operated through worse economies than we are facing today, and this REIT will be just fine. I will probably add another share sooner than later.
Week 86 Game Plan
Currently, I am considering adding to my positions in Southern Company (SO), Enbridge (ENB), and Walgreens Boots Alliance (WBA). WBA just had a good earnings report so I am leaning toward adding a share there, and with SO and ENB coming down off their highs, they are looking interesting. If I go with ENB, I will probably also add a share to Kinder Morgan (KMI) as there will be capital left over.
Conclusion
The markets aren’t out of the woods yet, and while the bear market continues, I will be adding to my positions each week. After 85 weeks, I am generating $622.75 in annual dividends from the Dividend Harvesting Portfolio, and I am looking forward to each week’s progression. There is probably a low percentage of investors who are in the green throughout 2022, and this style of investing has allowed me to mitigate the downside through diversification and reinvesting the dividends. Please leave your feedback and suggestions in the comment section as I look forward to interacting with everyone.
Be the first to comment