

kanawatvector
The 6 consecutive weeks of closing in the red have finally come to an end as the Dividend Harvesting Portfolio finished in the black at the close of week 74. It went from being down -$97.40 (-1.33%) in week 73 to being up $144.58 (1.95%) in week 74. This brings the Dividend Harvesting portfolio’s overall percentage of closing in the black to 89.19% (66/74). You never know if a bottom has been reached until several weeks or even several months into the future, and I feel that a sustainable rally could be forming in the markets. If the next CPI print comes in lower than 9.1% and core CPI falls for a 4th straight month, I think the markets will continue their rally into the fall. 2022 has been difficult for many investors, but I look at weakness as an opportunity as my time horizon is decades into the future. I believe I have added too many undervalued positions, and the Dividend Harvesting portfolio is structured to do well in an appreciating environment while generating substantial income, which gets reinvested back into those positions. I feel that this Portfolio has mitigated downside risk exceptionally well and if the bottom hasn’t been reached, it will continue to navigate the waters close to my level of invested capital.
In week 74, I added to my positions in Verizon (VZ), AT&T (T), the BlackRock Science and Technology Trust (BST), and the Global X Nasdaq 100 Covered Call ETF (QYLD). The Dividend Harvesting portfolio’s projected annual income is now $523.26, which is a forward yield of 6.94% across 78 income-producing positions. I have collected $234.44 in dividend income throughout 2022, with dividends being paid each week. If a rally continues and the Dividend Harvesting portfolio appreciates in value, I would expect the forward yield to decline. Ultimately, I would like this Portfolio to generate a minimum of 5-6% in annual income based on its portfolio value, not invested capital. I plan on continuing this series and allocating $100 per week to this project for years to come. This investment strategy isn’t glamorous, and it won’t appeal to everyone. Dividend investing can be tedious and sometimes feel like a slow grind. I am building this Portfolio out with 3 specific investment objectives in this order, 1st is to generate dividend income, 2nd is to mitigate downside risk during market declines, and 3rd is to generate capital appreciation. After 74 weeks, I feel this has been a success across the board.
I allocate capital toward big tech, funds, dividends, and growth outside of my retirement accounts. These are not my only investments, but I did open a separate account, so I could easily track and document this series. I intentionally created broad diversification throughout the Dividend Harvesting portfolio so I could benefit from sector rotations and mitigate my downside risk. Investors who are too exposed to growth companies or large-cap tech have gotten crushed as the investment landscape changes. On the growth and tech side of my investments, I am feeling the pain as some of my favorite companies, including Alphabet (GOOGL) (GOOG), Amazon (AMZN), and Meta Platforms (META), have been taken to the woodshed.
This series has never been about hitting a target yield, generating a certain amount of profit, or beating the market. I had two specific goals with this series. The first was to create a blueprint for constructing a dividend portfolio by documenting the journey starting from the beginning. The second goal was to illustrate how allocating capital each week toward investing, regardless of the amount, would be beneficial in the long run.
Too many people are under the illusion that you need tens of thousands or even hundreds of thousands to benefit from investing. Instead of using my real dividend portfolio as an example, I decided to start a new account, fund it with $100, and add $100 weekly, providing a step-by-step guide to dividend investing. This methodology doesn’t have to be used for dividend investing, and it could be as simple as an S&P index fund or a Total Market fund. Hopefully, this series is inspiring people to invest in their future to attain financial freedom.
Steven Fiorillo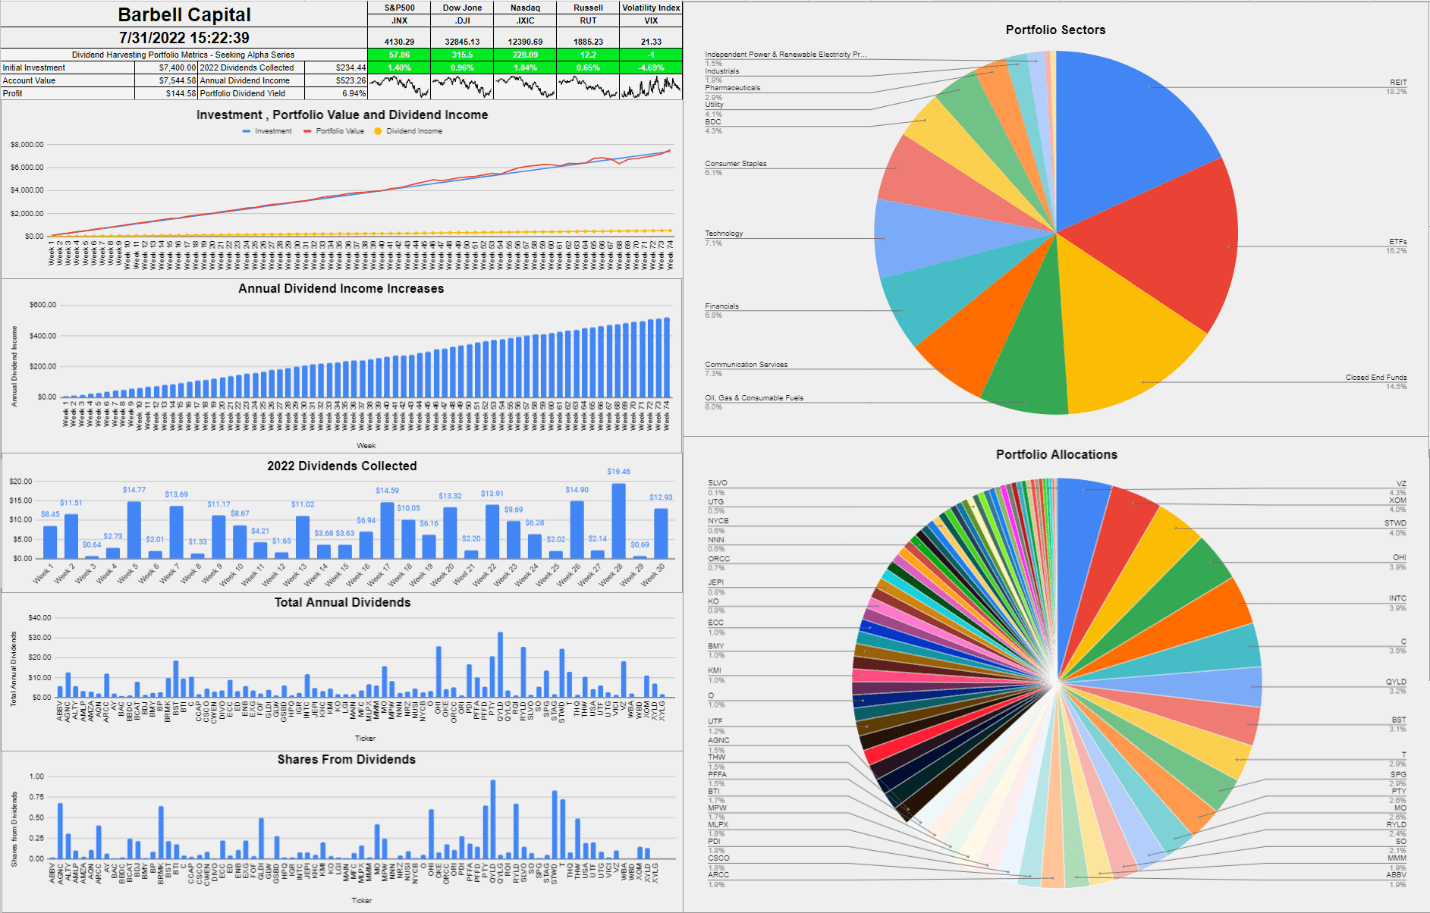
A Historical Recap Of The Dividend Harvesting Portfolio’s Investment Principals and Historical Performance
Investment Objectives
- Income generation
- Downside mitigation through diversification
- Capital appreciation
Below are the fundamental rules I have put in place for this Portfolio:
- Allocate $100 weekly to this Portfolio
- Only invest in dividend-producing investments
- No position can exceed 5% of the Portfolio
- No sector can exceed 20% of the Portfolio
- All dividends & distributions are to be reinvested
Below is a chart that extends from week 1 through the current week to illustrate the Dividend Harvesting Portfolio’s Progression
- Blue line is my initial investment $100 in week 1, $1000 in week 10, etc.
- Red line is the account value at the end of each week
- Yellow line is the annual dividend income the Dividend Harvesting Portfolio was projected to generate after that week’s investments and dividends reinvested
Steven Fiorillo
The Dividend Harvesting Portfolio Dividend Section
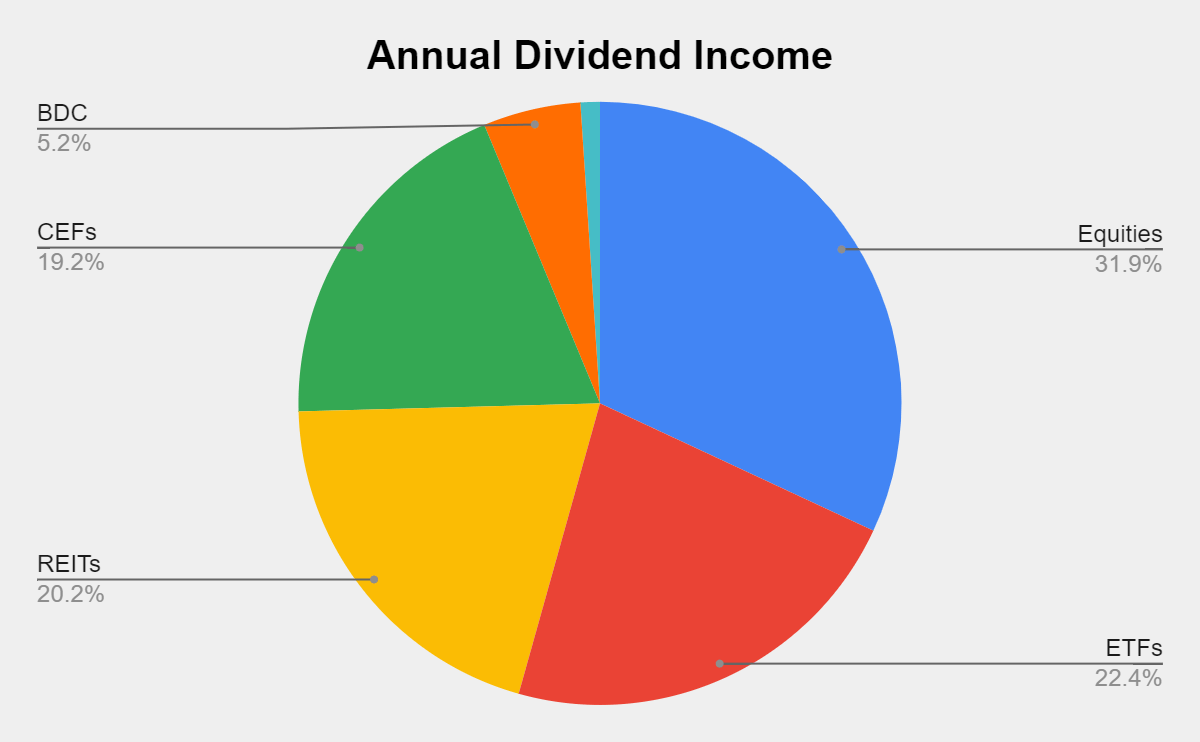
Here is how much dividend income is generated per investment basket:
- Equities $167.11 (31.94%)
- ETFs $117.26 (22.41%)
- REITs $105.85 (20.23%)
- CEFs $100.23 (19.15%)
- BDC $27.38 (5.23%)
- ETNs $5.43 (1.04%)
Steven Fiorillo Steven Fiorillo
Collecting dividends can serve many functions in a portfolio. Some investors utilize dividends to supplement their income and live off. I am building a dividend portfolio for myself 30 years into the future. Since I am reinvesting every dividend, they serve multiple purposes today. In 2022 alone, I have collected $234.44 in dividend income from 290 dividends across 30 weeks. This has allowed the Dividend Harvesting portfolio to stay in the black while growing the snowball effect.
These dividends allow me to gain additional equity in my investments while increasing my future cash flow in down markets. This style of investing isn’t for everyone, but if you’re looking to generate consistent cash flow while mitigating downside risk, this method has worked for me. I am hoping to collect between $450-$500 in dividends in 2022, which will be reinvested, and finish the year generating >$700 in annual dividends.
Steven Fiorillo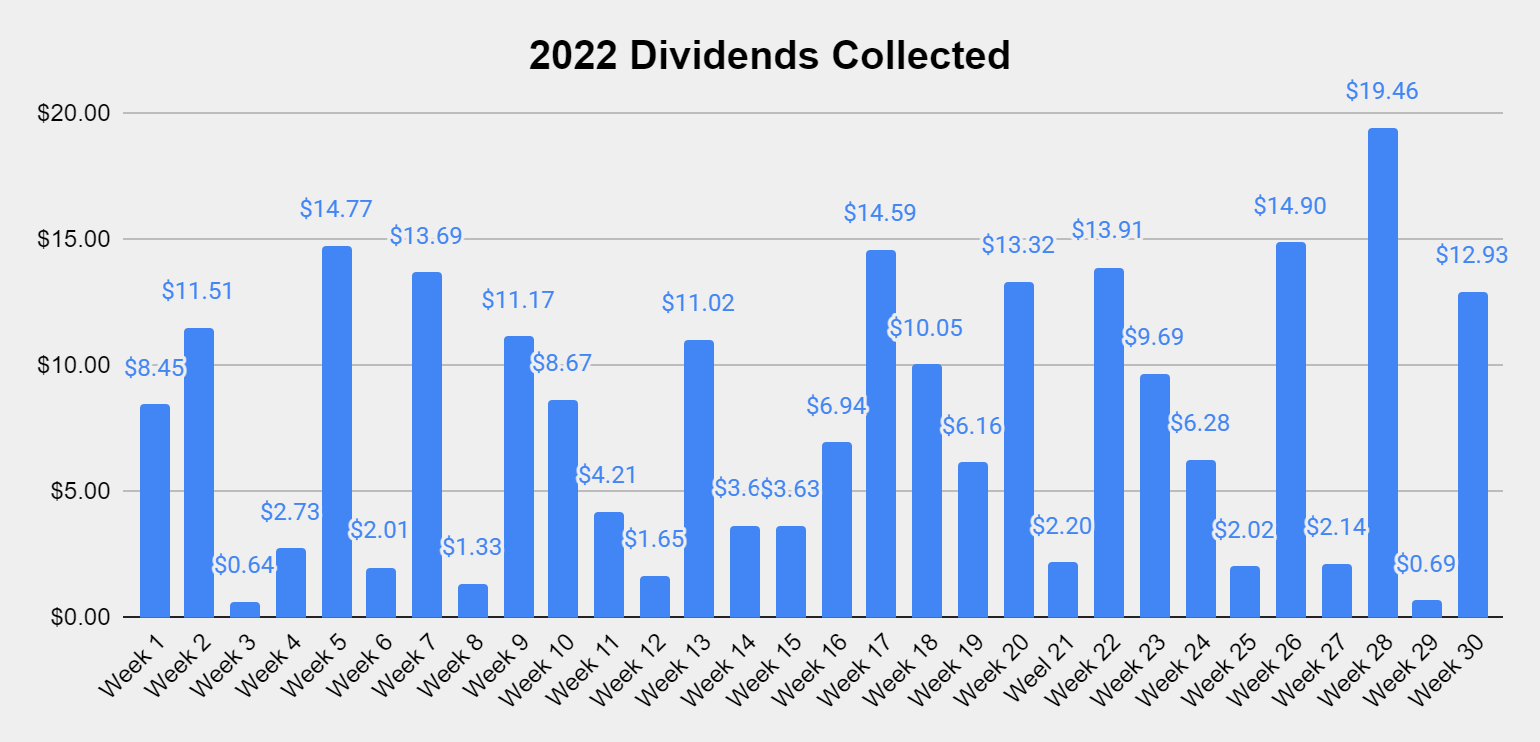
The never-ending stream of dividend income keeps flowing into my account through weekly dividends. After adding WBA and NNN to the Dividend Harvesting portfolio in week 73, there are 584 annual dividends being produced. Each week income comes rolling in, and the snowball effect amplifies little by little.
Steven Fiorillo
The goal of generating enough income from the dividends to purchase an additional share per year has been the never-ending project of this Portfolio. There are now 6 positions that are generating at least 1 share annually through their dividends, which include Starwood Property Trust (STWD), PIMCO Corporate & Income Opportunity Fund (PTY), Broadmark Realty Capital (BRMK), AGNC Investment Corp. (AGNC), the Global X Russell 2000 Covered Call ETF (RYLD), and the Global X NASDAQ 100 Covered Call ETF (QYLD). I am trying to get more of the current positions over the finish line. Eventually, more positions will generate one share per year in dividend income.
|
Shares from Dividends Annually |
||||||||||
|
0-9.9% |
10-19.99% |
20-29.99% |
30-39.99% |
40-49.99% |
50-59.99% |
60-69.99% |
70-79.99% |
80-89.99% |
90-100% |
Generating > 1 share |
|
CSCO |
C |
NRZ |
VZ |
ALTY |
GLDI |
THW |
ECC |
OHI |
PTY |
|
|
BBDC |
MFC |
IGR |
MO |
MPW |
BCAT |
T |
PDI |
QYLD |
||
|
AMZA |
FOF |
NYCB |
SLVO |
PFFA |
BST |
ARCC |
BRMK |
|||
|
BP |
MLPX |
KMI |
GSBD |
EXG |
USA |
RYLD |
||||
|
LGI |
XYLD |
PFFD |
INTC |
ORCC |
STWD |
|||||
|
KHC |
AQN |
BTI |
AGNC |
|||||||
|
JEPI |
QYLG |
NUSI |
||||||||
|
AMLP |
BDJ |
UTF |
||||||||
|
UTG |
ENB |
|||||||||
|
CWEN |
SPG |
|||||||||
|
SO |
XOM |
|||||||||
|
THQ |
CCAP |
|||||||||
|
OKE |
DIVO |
|||||||||
|
RQI |
||||||||||
|
XYLG |
||||||||||
|
AY |
||||||||||
|
WBA |
||||||||||
|
STAG |
||||||||||
|
NNN |
||||||||||
|
VICI |
||||||||||
|
MMM |
||||||||||
|
ORI |
||||||||||
|
O |
||||||||||
|
ABBV |
||||||||||
|
MAIN |
||||||||||
|
ED |
||||||||||
|
HPQ |
||||||||||
|
BMY |
||||||||||
|
GLW |
||||||||||
|
KO |
||||||||||
|
BAC |
||||||||||
|
WBD |
||||||||||
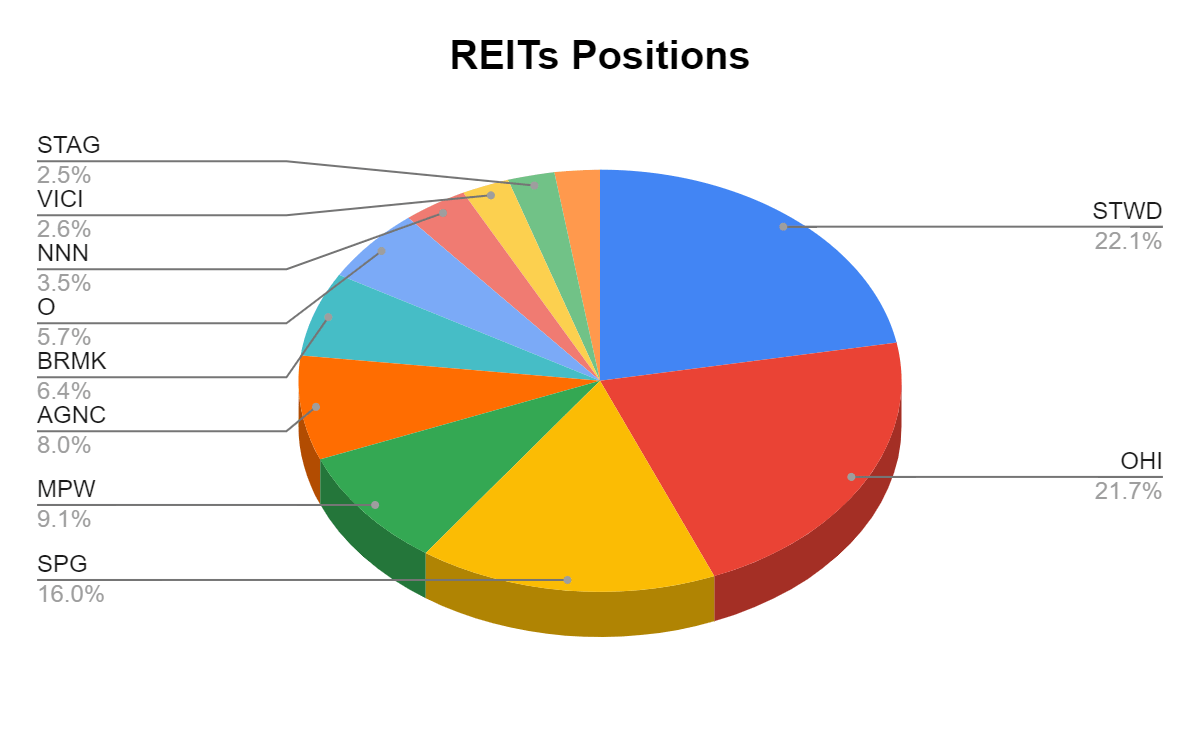
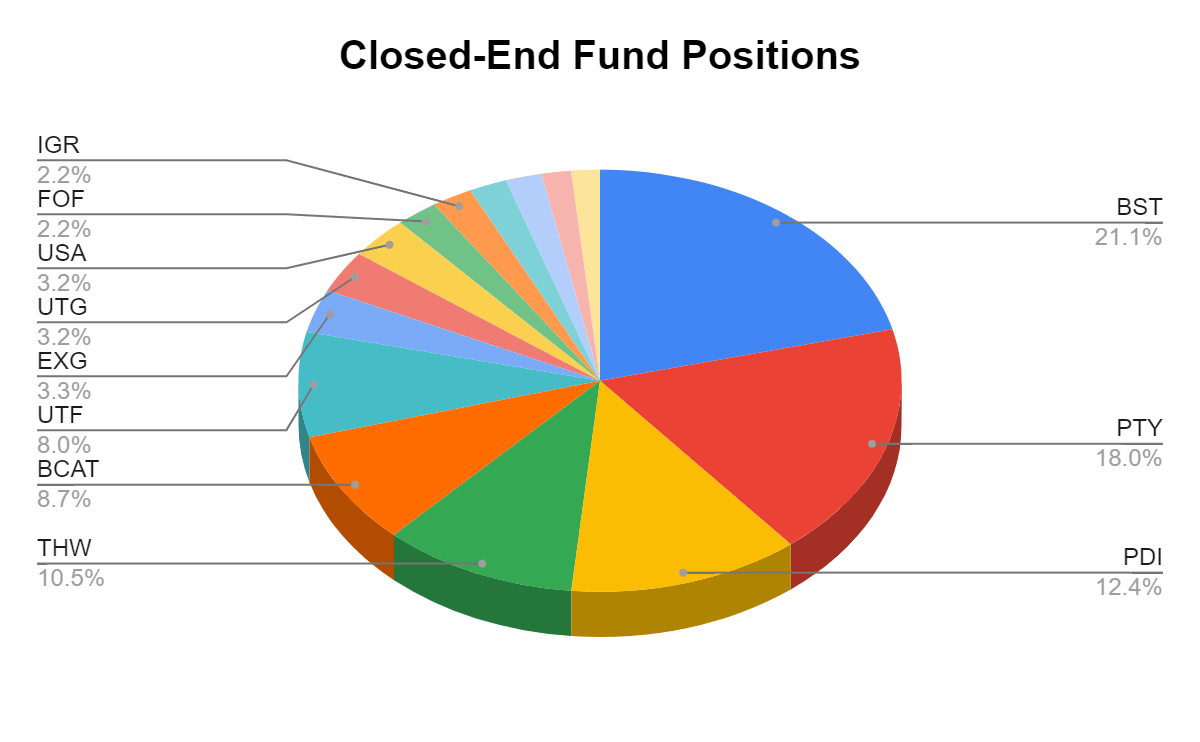
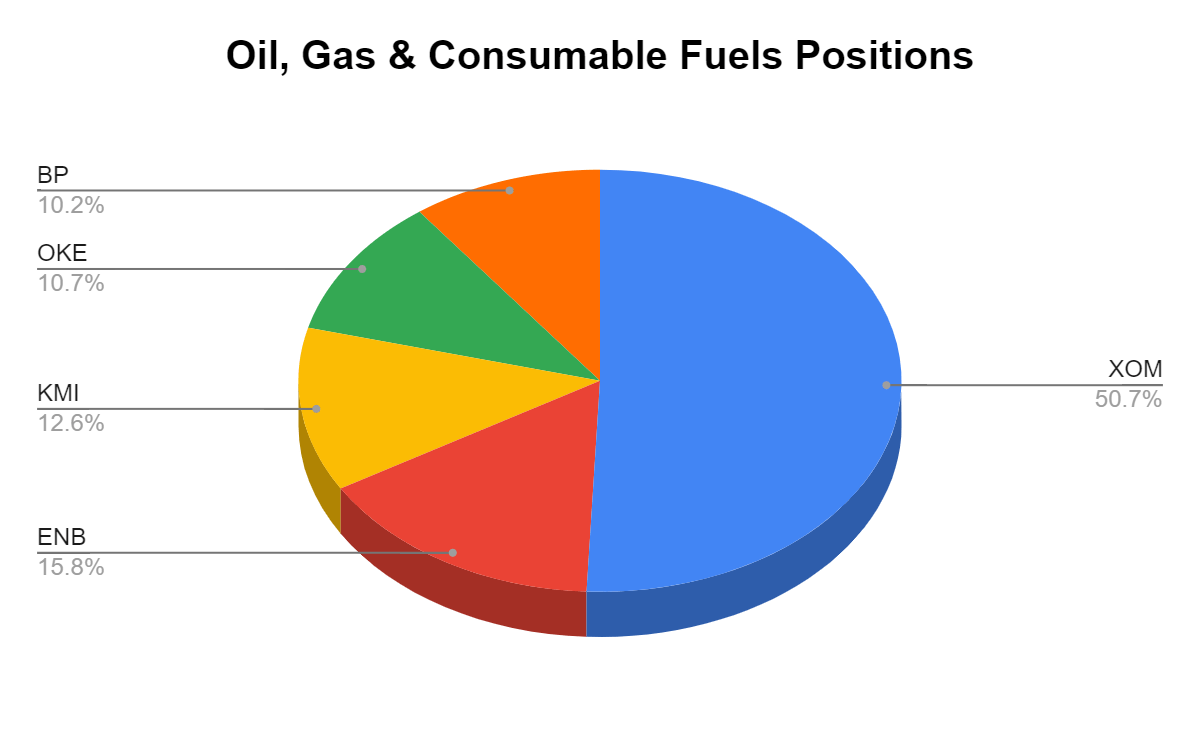
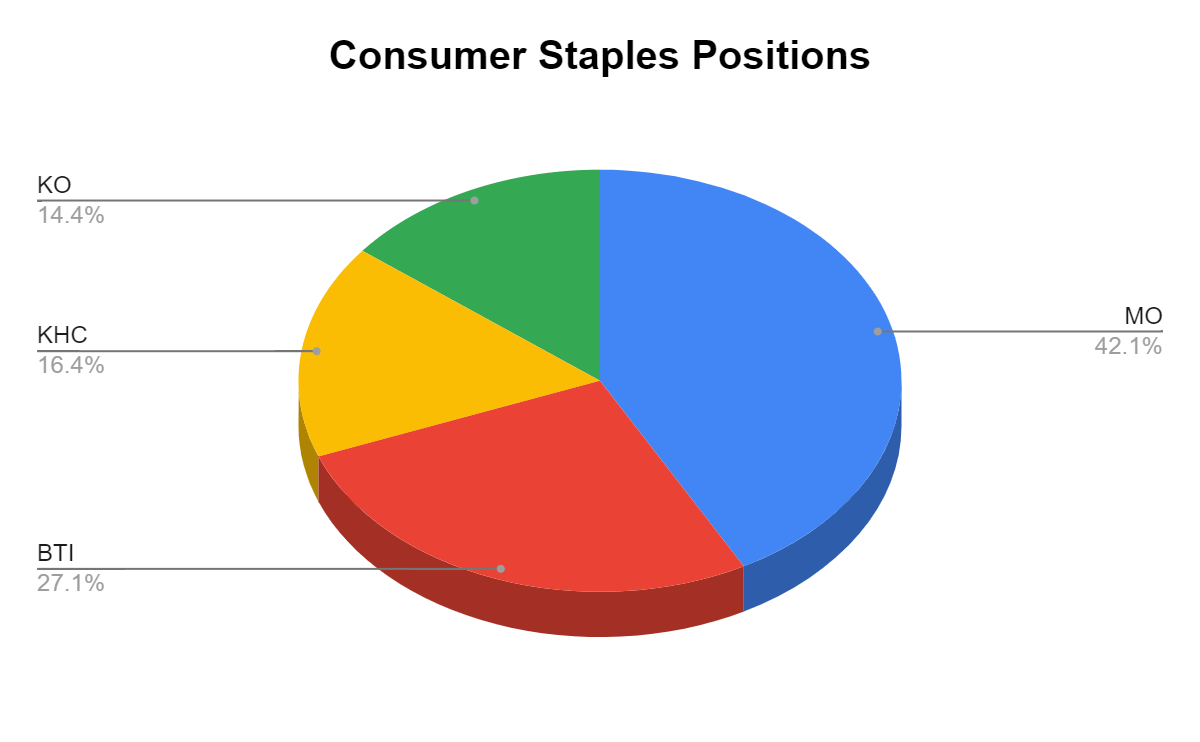
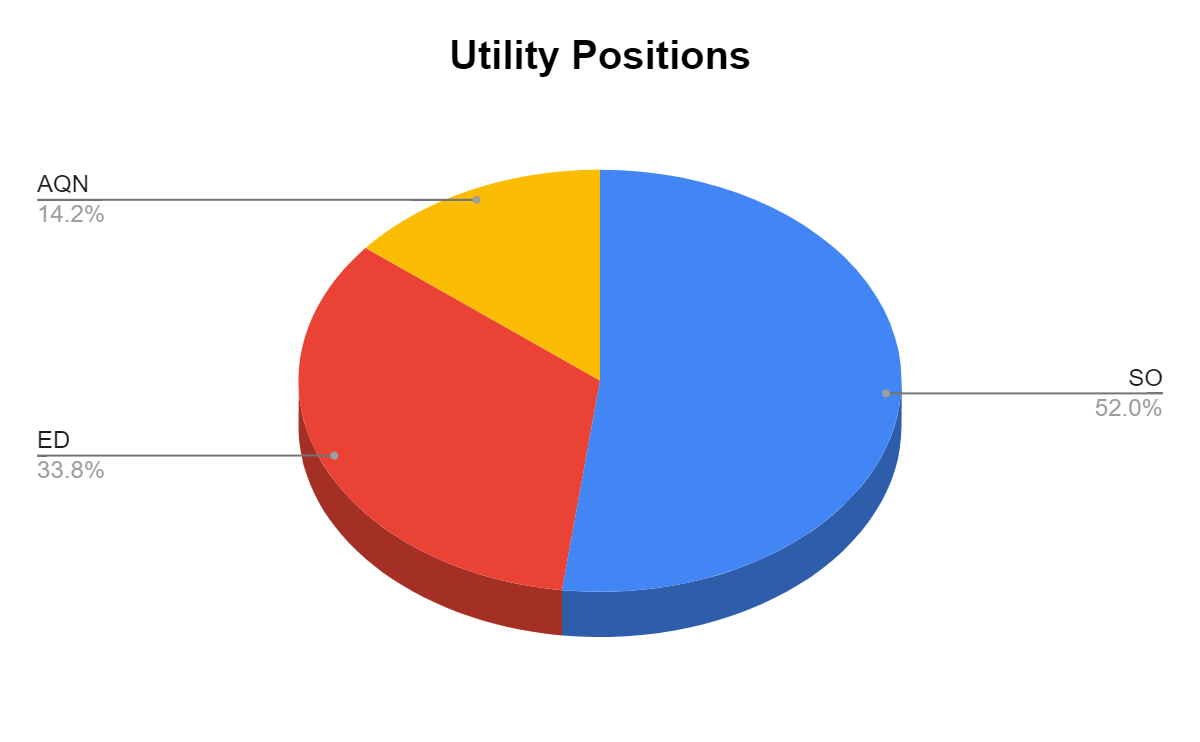
The Dividend Harvesting Portfolio Composition
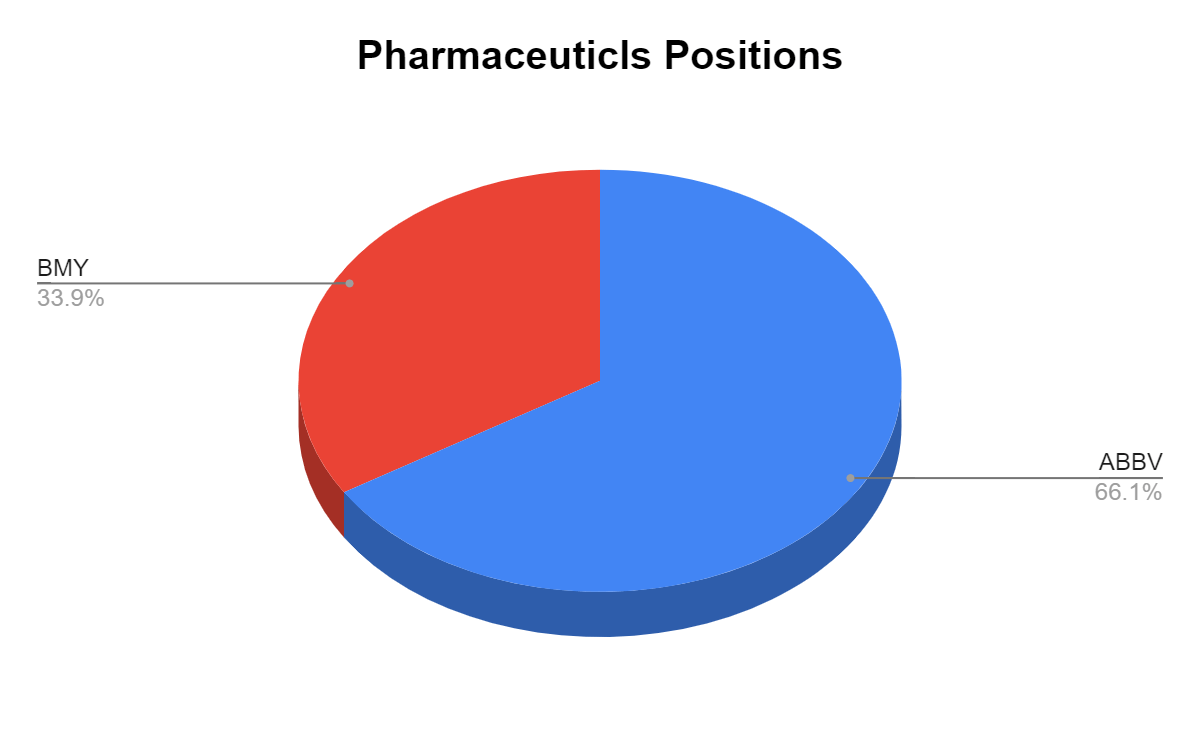
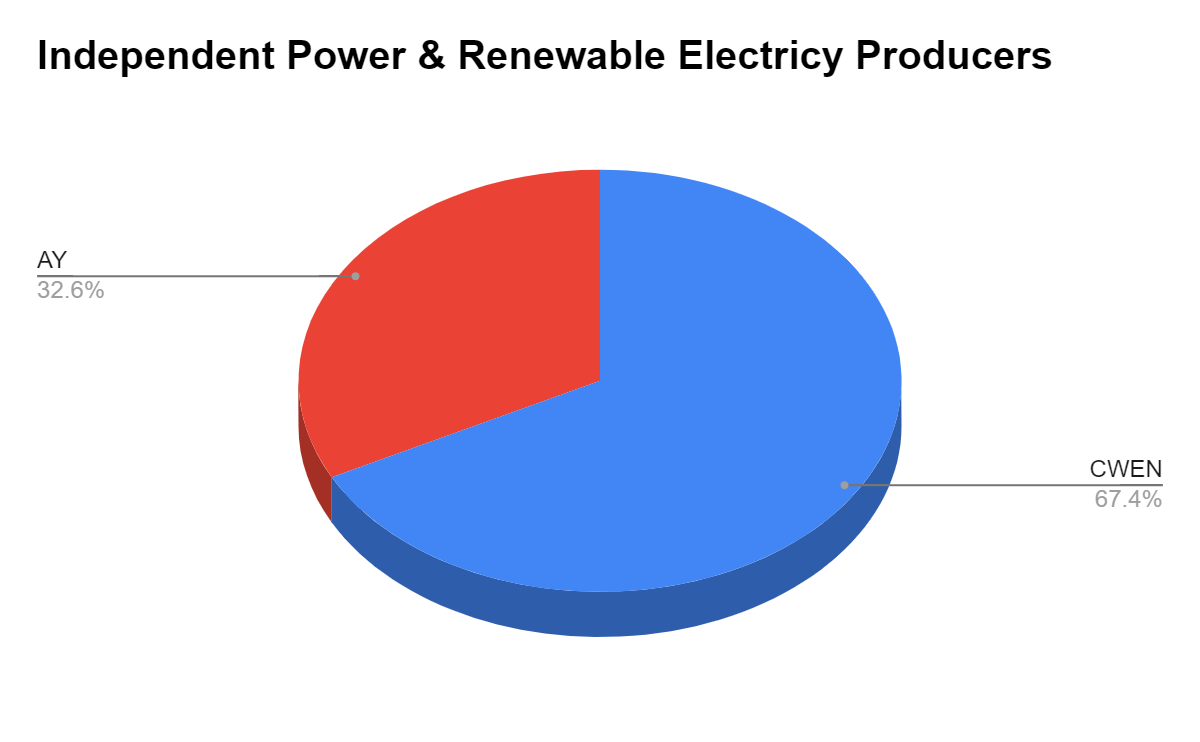
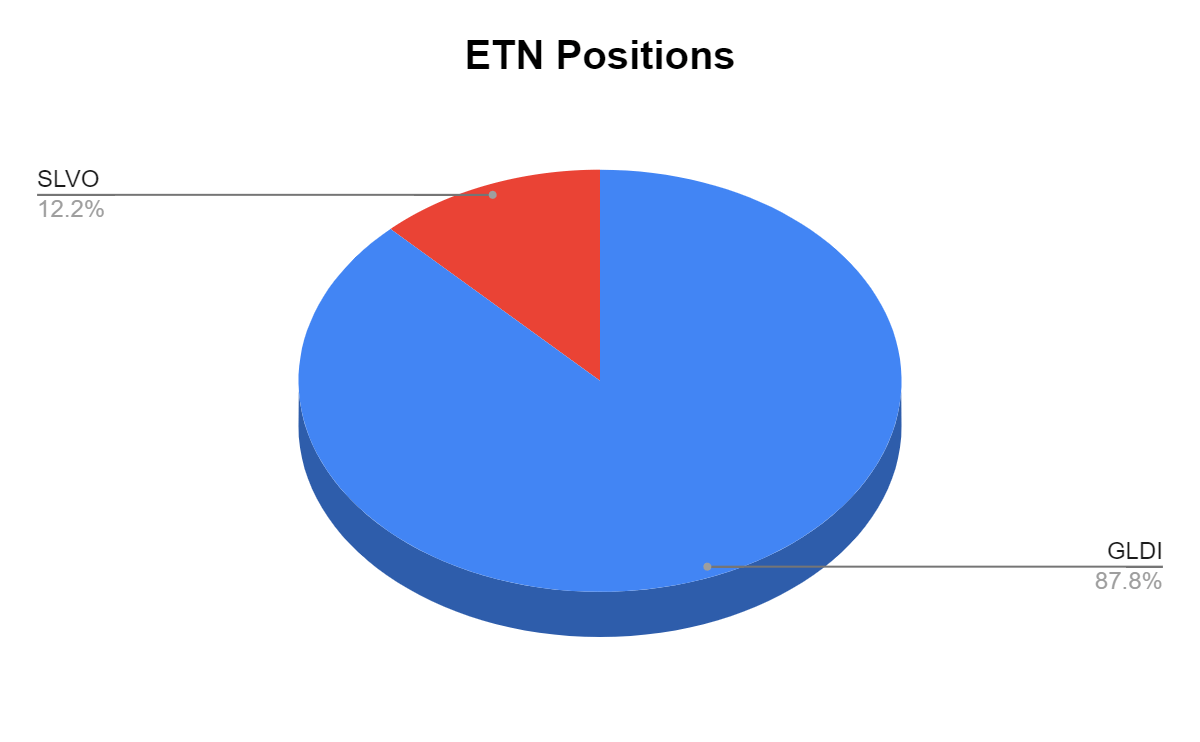
Many of the readers have asked if I could break down the individual positions within these sectors. I created pie charts for each individual sector and have illustrated how much each position represents of that sector of the Dividend Harvesting portfolio. Since I only have 1 position in Food & Staple Retailing and Industrials, I did not make a chart for those. 3M (MMM) and Walgreens Boots Alliance (WBA) represent 100% of those sectors. The charts will follow the normal portfolio total I have constructed. Please keep the ideas coming, as I am happy to add as much detail to this series as I can.
Steven Fiorillo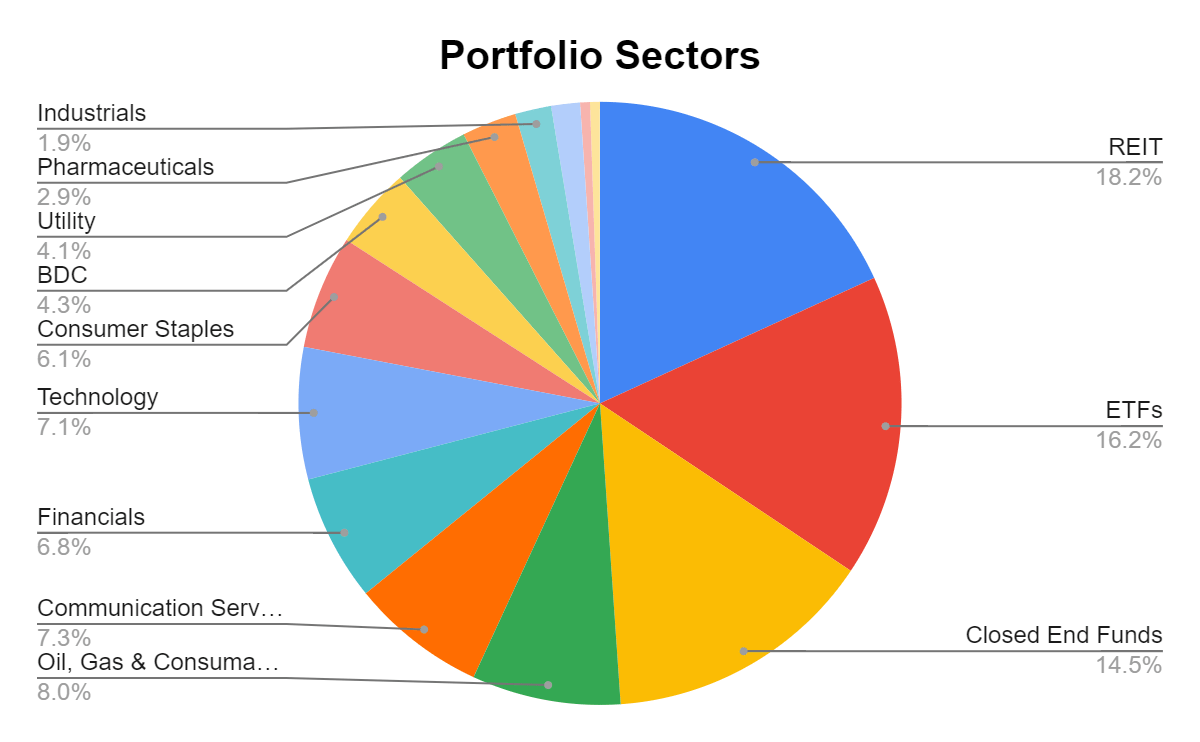
In week 74, ETFs reclaimed the top sector spot of the Dividend Harvesting portfolio as they represented 18.17% of the total positions, while ETFs dropped back to 2nd place, accounting for 16.20%. Individual equities make up 46.21% of the Portfolio and generate 31.94% of the dividend income, while ETFs, CEFs, REITs, BDCs, and ETNs represent 53.79% of the Portfolio and generate 68.06% of the dividend income. I have a 20% maximum sector weight, so when a singular sector gets close to that level, I make sure capital is allocated away from that area to balance things out. In 2022, I will make an effort to even out these portfolio percentages. As more capital is deployed, the bottom half of the portfolio weighting will increase.
|
Industry |
Investment |
Portfolio Total |
% of Portfolio |
|
REIT |
$1,370.76 |
$7,544.58 |
18.17% |
|
ETFs |
$1,222.36 |
$7,544.58 |
16.20% |
|
Closed End Funds |
$1,096.89 |
$7,544.58 |
14.54% |
|
Oil, Gas & Consumable Fuels |
$601.76 |
$7,544.58 |
7.98% |
|
Communication Services |
$548.21 |
$7,544.58 |
7.27% |
|
Financials |
$511.93 |
$7,544.58 |
6.79% |
|
Technology |
$533.06 |
$7,544.58 |
7.07% |
|
Consumer Staples |
$460.71 |
$7,544.58 |
6.11% |
|
BDC |
$328.01 |
$7,544.58 |
4.35% |
|
Utility |
$307.37 |
$7,544.58 |
4.07% |
|
Pharmaceuticals |
$221.12 |
$7,544.58 |
2.93% |
|
Industrials |
$146.25 |
$7,544.58 |
1.94% |
|
Independent Power & Renewable Electricity Producers |
$116.55 |
$7,544.58 |
1.54% |
|
Food & Staple Retailing |
$39.62 |
$7,544.58 |
0.53% |
|
ETN |
$38.85 |
$7,544.58 |
0.51% |
|
Cash |
$1.14 |
$7,544.58 |
0.02% |
Here is a breakdown of each position within each sector of the Dividend Harvesting portfolio:
Steven Fiorillo Steven Fiorillo Steven Fiorillo Steven Fiorillo Steven Fiorillo Steven Fiorillo Steven Fiorillo Steven Fiorillo Steven Fiorillo Steven Fiorillo Steven Fiorillo Steven Fiorillo Steven Fiorillo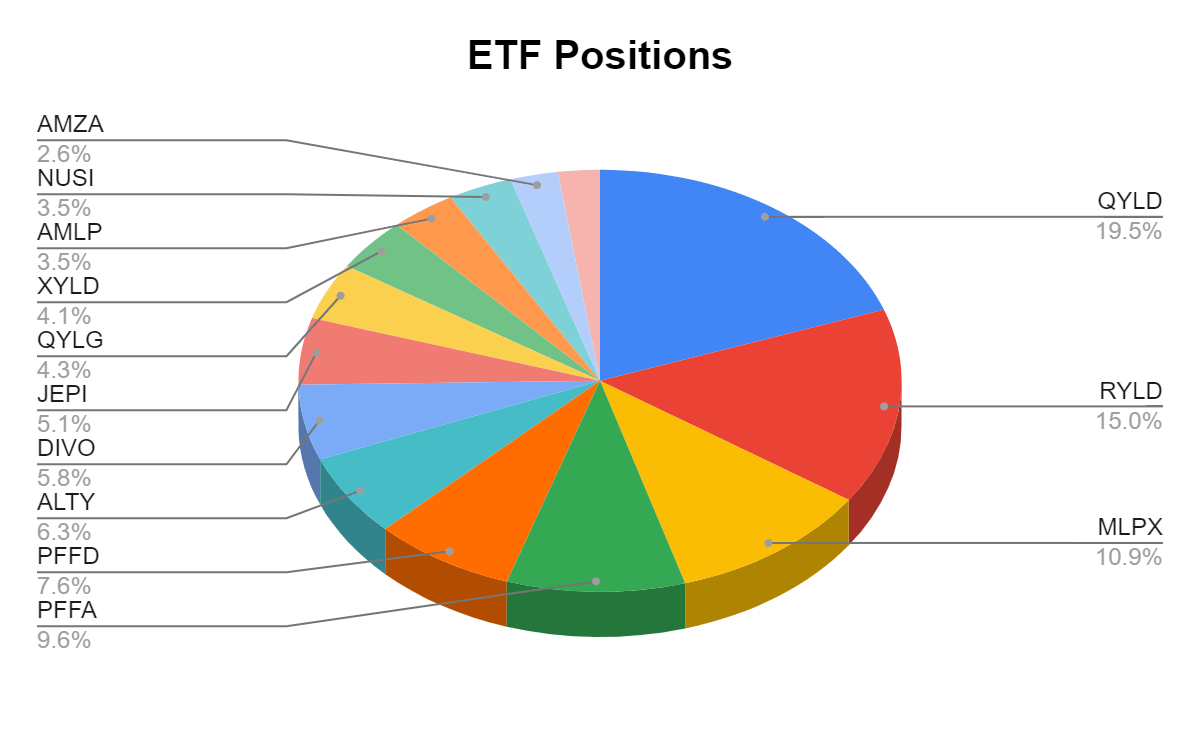
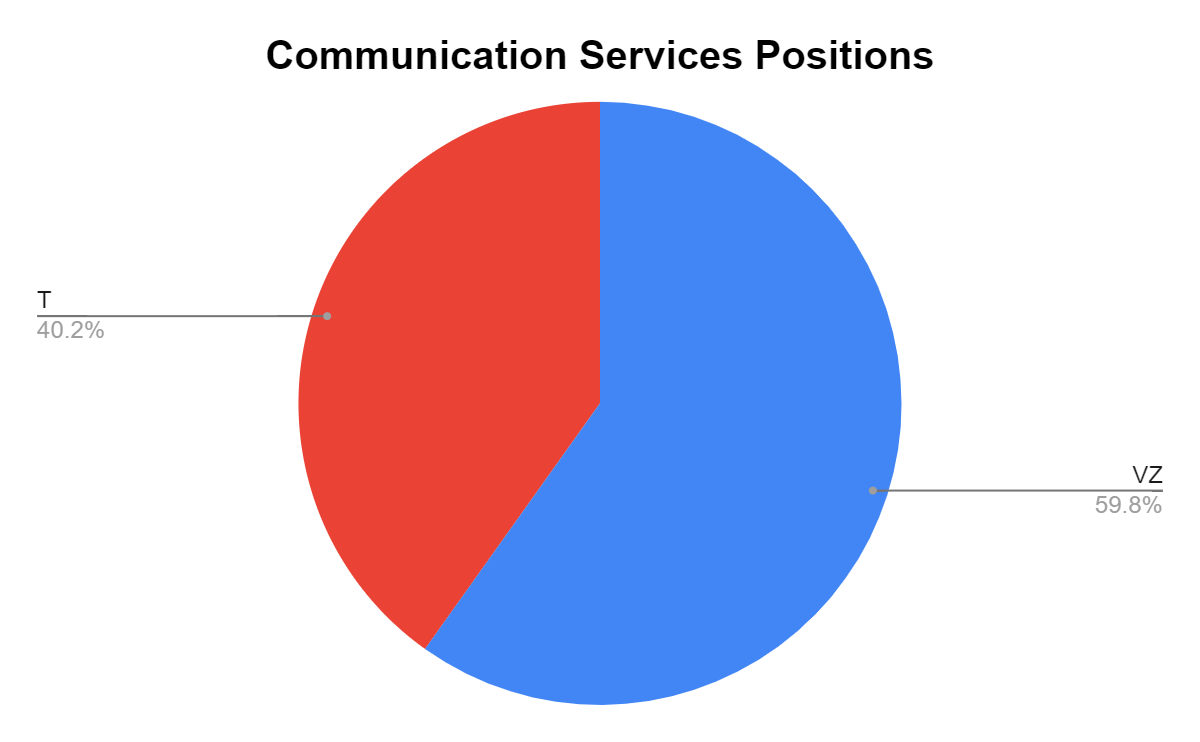

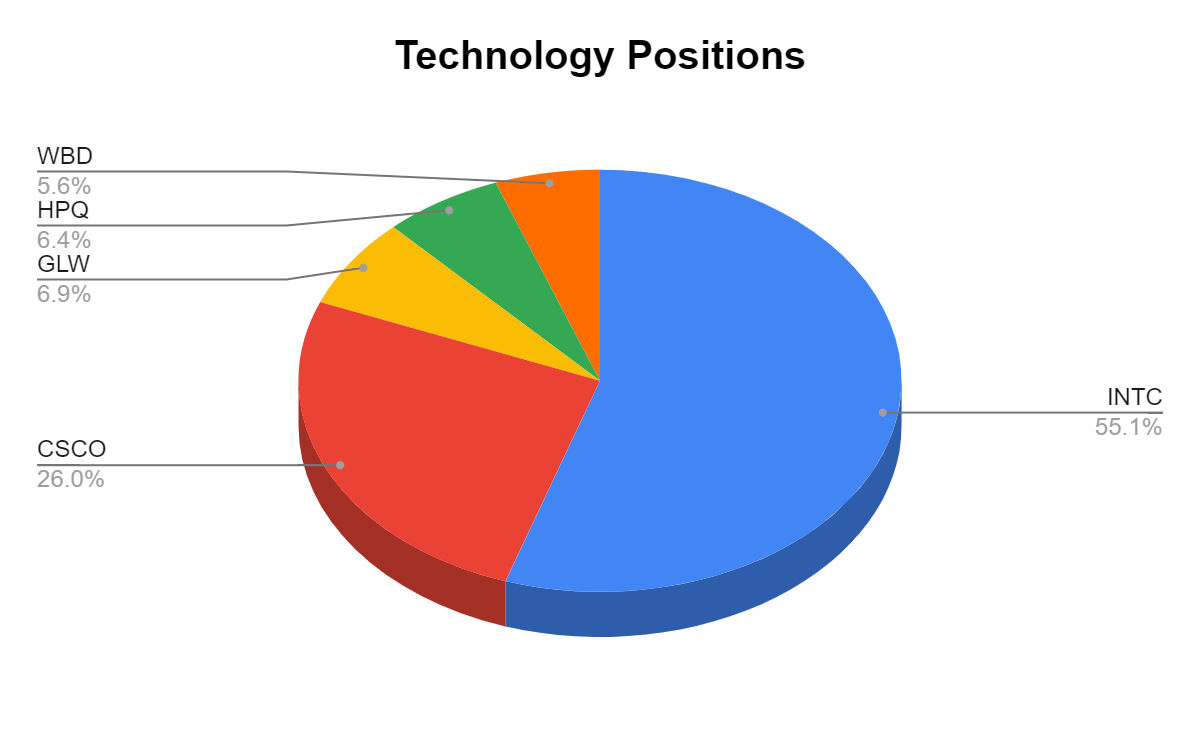

In week 74, Intel Corporation (INTC) got hammered as their Q2 earnings were a disaster. This correlated to INTC declining substantially and going from the Dividend Harvesting portfolio’s largest position in week 73 at 4.40% to its 5th largest position in week 74 at 3.89%. This is important for investors to notice. INTC was the largest position and declined by -8.56% on Friday the 29th. Due to my vast diversification and sticking to my rule of not letting a position exceed 5% of the Portfolio, INTC’s decline didn’t severely impact me, and the Dividend Harvesting portfolio rallied with the markets and closed in the black at the close of week 74. VZ is my largest position, and the top 10 positions are starting to round out quite nicely.
Steven Fiorillo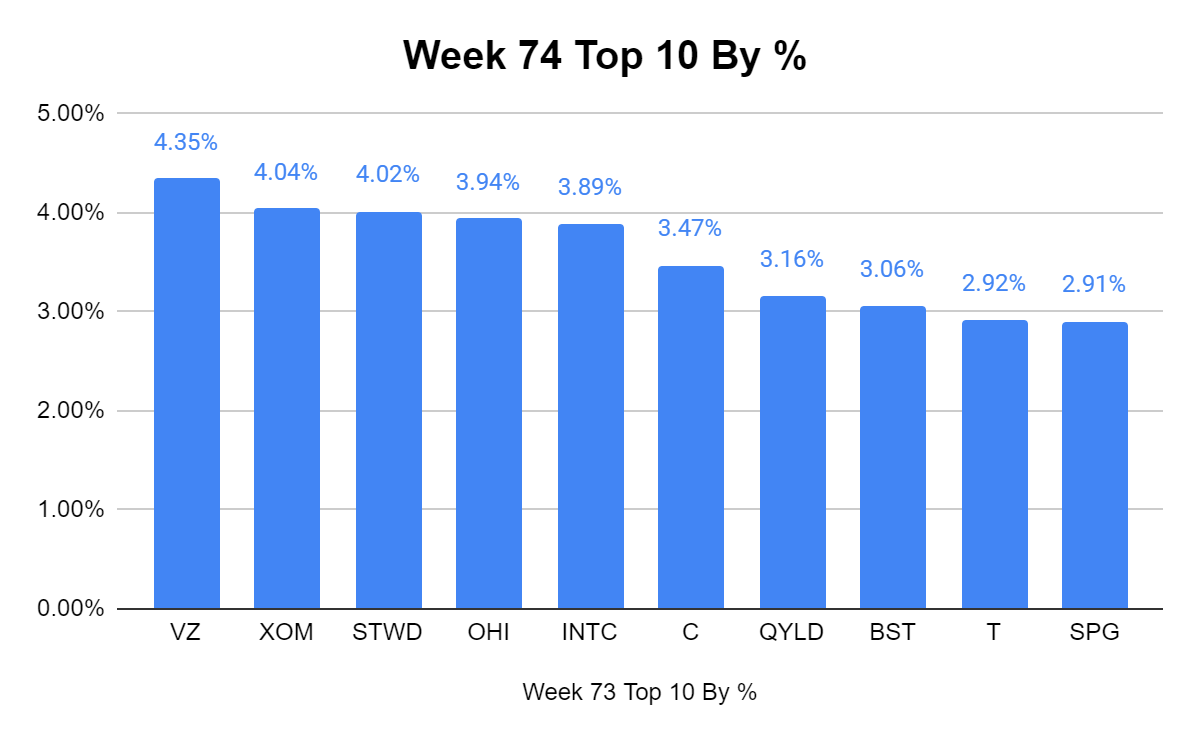
Week 74 Additions
In week 74 I added to my current positions of:
- Verizon (VZ)
- AT&T (T)
- BlackRock Science and Technology Trust (BST)
- Global X Nasdaq 100 Covered Call ETF (QYLD)
Verizon
- Shares of VZ declined after an earnings miss and lowered forward guidance. I felt it was an opportunity to increase my position at a lower price as I believe VZ will be higher in the future and continue to increase its annual dividend. If VZ stays in the mid $40s I will gladly add again in the near future
AT&T
- I wrote a dedicated article on T (can be read here) after their top and bottom line beat the other day. T declined significantly after lower guidance on 2022’s FCF level. T’s yield was pushed past 6%, and I think this is an opportunity. In the long run T should be fine, and I think the market is just being over dramatic as T can do nothing correct in its eyes.
BlackRock Science and Technology Trust
- I recently wrote an article on BST (can be read here) on 7/26 before big tech earnings were announced. I had indicated that I thought BST was in a good position to rally if big tech had a strong earnings season, and since the article was released, BST is up 7.46% compared to the S&P 500’s change of 4.47%. BST is still yielding 7.95%, and I think there is still a lot of future opportunity in this CEF. I will probably add another share in the weeks to come.
Seeking Alpha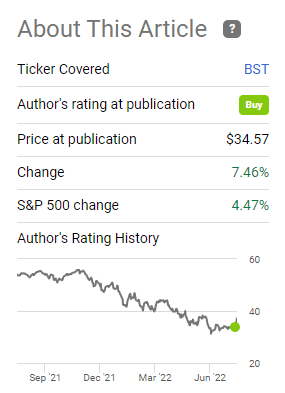
Global X Nasdaq 100 Covered Call ETF
- I am a fan of the Global X Covered Call ETFs. I wanted to add another share of QYLD prior to big techs earnings for the same reasons as I did with BST. I think QYLD will rebound with the markets, and I love the double-digit yield.
Week 75 Gameplan
Nothing is set in stone, but I am leaning toward adding 1 share of INTC, Ares Capital (ARCC), and the Global X S&P 500 Covered Call ETF (XYLD).
Conclusion
The Dividend Harvesting portfolio has clawed its way back to positive territory and snapped a 6-week losing streak. It’s now in the black by $144.58, generating a projected $523.26 annual dividend. I couldn’t be happier with this portfolio’s progress and results as it delivers on my investment objectives. I am building a portfolio of income-producing assets I want to own and constructing a personalized ETF. Please leave all of your questions in the comment section and ideas for future investments. In week 80, I will be allocating the investment capital toward positions suggested by the readers of this series. Thank you for continuing to read this series, and I look forward to interacting with everyone in the comment section.
Be the first to comment