


Lemon_tm
Overview
In this series of articles, I will be reviewing Dividend Champions from a specific industry and selecting stocks as long-term buys, current holds, or stocks to avoid based on a variety of financial and valuation metrics. More information regarding the Dividend Champions list can be found here.
I believe that one of the best ways to improve is by looking back and reviewing your past work. For the first 4 parts of this series, I reviewed the successes/failures from my original articles in 2017 and using those reviews to update the metrics used to have a more reliable indicator of future returns. You can click on these links to see Part 1, Part 2, and Part 3 of this series.
Starting with Part 5 of this series I will be applying the updated metrics and scoring system (determined through parts 1 and 4 of this series) and using that to rank Dividend Champions in other industries. For part 7, I will be looking at the eight Dividend Champion stocks in the Machinery industry and they include:
- Caterpillar (CAT)
- Donaldson Company (DCI)
- Dover (DOV)
- Franklin Electric (FELE)
- Graco (GGG)
- Illinois Tool Works (ITW)
- Lincoln Electric Holdings (LECO)
- Nordson (NDSN)
- Parker-Hannifin (PH)
- Stanley Black & Decker (SWK)
- Tennant Company (TNC)
Updating The Scoring System
In my original articles from 2017, I used the following metrics to rank stocks: Revenue Growth, Earnings Growth, ROA, ROE, ROIC, Dividend Yield, Dividend Growth, PE Ratio, and Price to Book Value.
I will be using a similar ranking system as I used 5 years ago with a few tweaks based on the review of results from the first four articles of the original series of articles. These updates include:
- Revenue/Earnings Growth – The time frame of these 2 metrics will be shortened from 5 years to 3 years to place more importance on recent growth
- Dividend Growth – This metric will be weighted so that its impact on the total score is reduced by 50%.
- PE Ratio – In the original article, I ranked the stocks based on the trailing PE ratio. For this new series of articles, I will be using its normalized PE ratio to help determine the company’s long-term value.
- Price to Book Value – This metric will be weighted in the same manner as dividend growth
In addition to these updates, I will be adding two additional metrics from YCharts to the rankings of these stocks:
- Fundamental Score – additional details on this score can be found here.
- Momentum Score – additional details on this score can be found here.
Starting in Part 3 of this series of articles, I have also started applying the same weight to the ROA, ROE, and ROIC metrics that have been applied to the Dividend Growth and Price to Book Value metrics. Also, based on feedback received from part 6 of this series, I will also be reviewing any special dividends that have been declared by these stocks over the past five years and including those in the dividend metrics.
The New Metrics
Revenue Growth
This chart shows the revenue growth of each stock over the past three years.
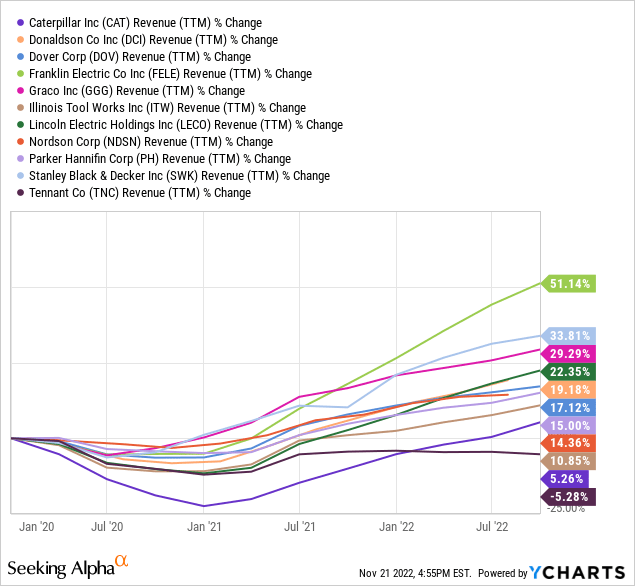
Looking at the chart above, you can see that Franklin Electric has seen the most impressive revenue growth over the past five years, considerably higher than the other 10 stocks. Tennant Company is the only stock out of the 11 to have seen a decline in revenue during this time period.
Earnings Growth
This chart shows the earnings growth of each stock over the past three years.
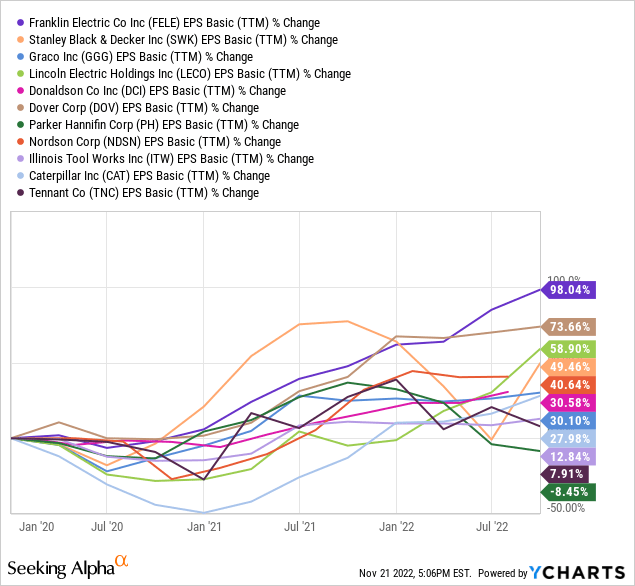
Franklin Electric once again ranks 1st out of the group of stocks in terms of earnings growth and once again only 1 stock, Parker-Hannifin this time, has seen negative growth during this time period.
Return on Assets
This chart shows the current ROA value of each stock.
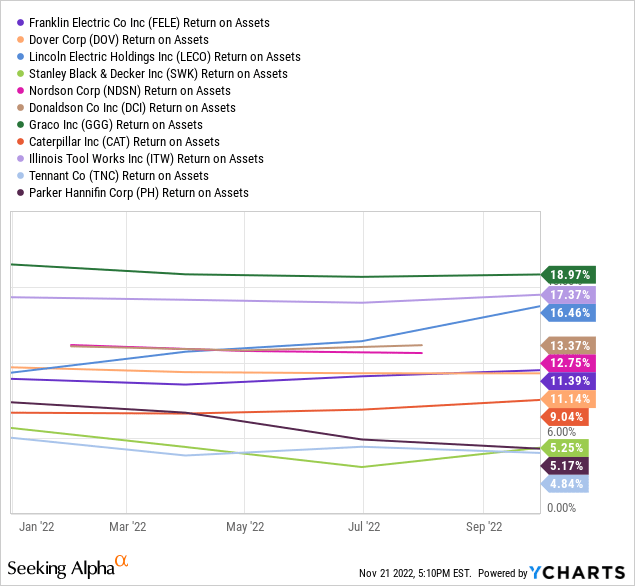
Graco currently has the highest ROA value of 18.97%, while Tennant has the lowest value of 4.84%.
Return on Equity
This chart shows the current ROE value of each stock.
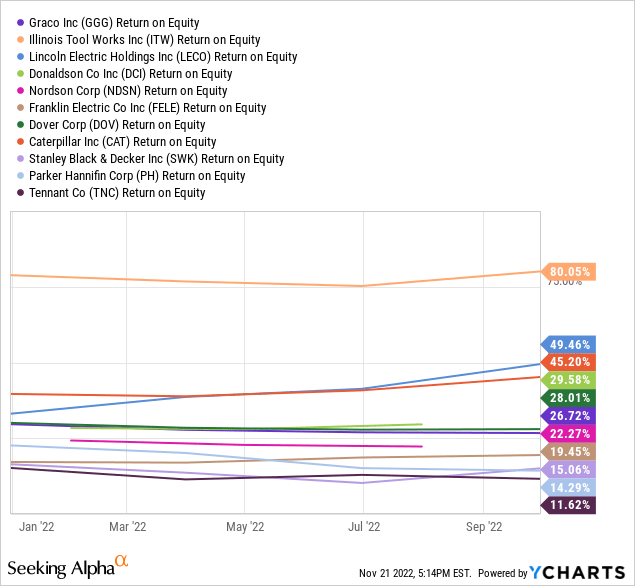
Illinois Tool Works ranks 1st in terms of ROE with a value of 80.05% and Tennant once again ranks last with an ROE value of 11.62%.
Return on Invested Capital
This chart shows the current ROIC value of each stock.
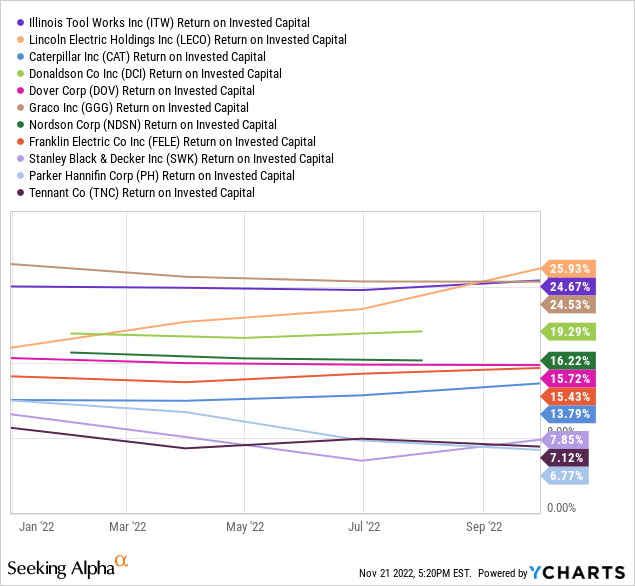
Similar to both ROA and ROE, the ROIC values of these 11 stocks are fairly evenly distributed between the top and bottom-ranked stocks. The top three ranked stocks are all within 1.5% of each other with Lincoln Electric coming out on top and the same is true of the bottom three stocks with Parker Hannifin coming out on the bottom.
Dividend Yield
Before looking at the dividend metrics, I checked to see if any of these stocks had declared a special dividend in the last five years so that I could include those in the calculation of the dividend metrics, but none of these stocks had any special dividends declared.
This chart shows the current dividend yield of each stock.
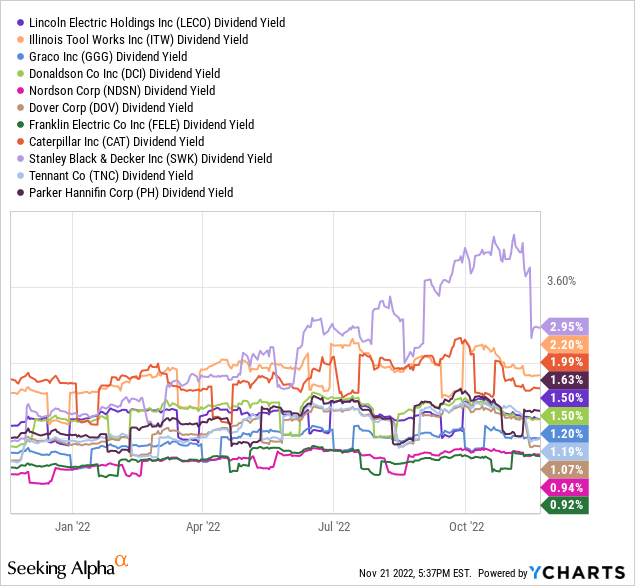
Stanley Black & Decker currently has the highest yield at 2.95%, while Nordson and Franklin Electric have the lowest yields at 0.94% and 0.92% respectively.
Dividend Growth
Listed below is each stock ranked in order of its 5-year dividend growth rate.
- Nordson – 14.45%
- Parker Hannifin – 13.72%
- Franklin Electric – 13.05%
- Illinois Tool Works – 12.73%
- Graco – 11.84%
- Lincoln Electric Holdings – 9.86%
- Caterpillar – 8.31%
- Dover – 6.77%
- Stanley Black & Decker – 5.99%
- Donaldson Company – 5.01%
- Tennant Company – 3.55%
Normalized P/E ratio
This chart shows the normalized P/E ratio of each stock.
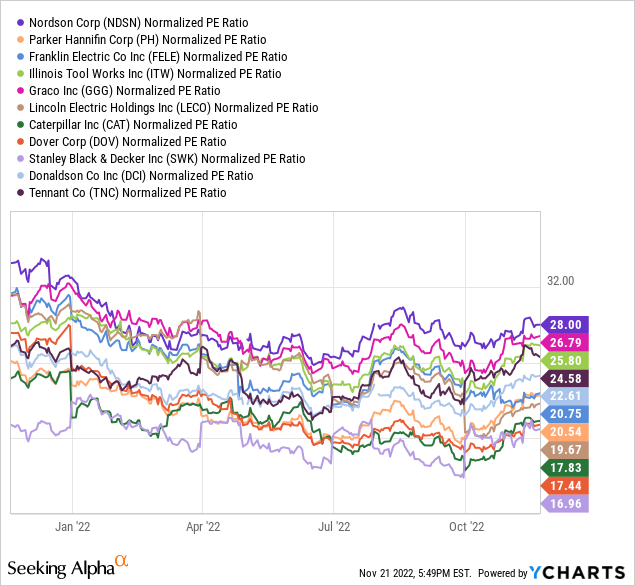
Based on the normalized P/E ratio of each stock, Stanley Black and Decker appears to be the most attractively priced stock while Nordson appears to be the least attractively valued.
Price to Book Value
This chart shows the price-to-book value of each stock.
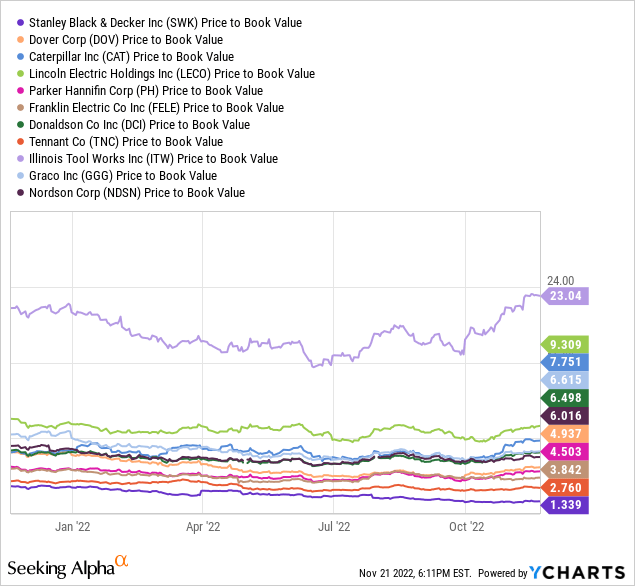
Based on the price-to-book value of each stock it appears that Stanley Black & Decker is once again the most attractively priced stock, while Illinois Tool Works appears to be the least attractively priced with a price-to-book value nearly 3 times higher than the next closest stock.
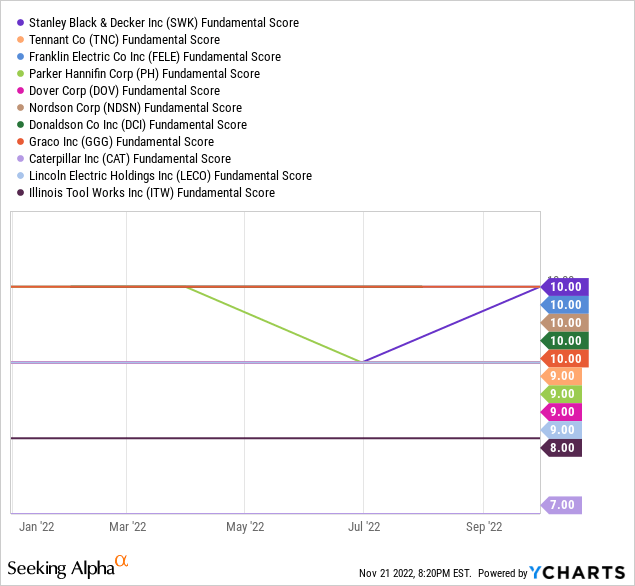
Fundamental Score
In terms of fundamental scores, each of the 11 stocks had scores of 9 or 10 with the exception of Illinois Tool Works (with a score of 8) and Caterpillar (with a score of 7).
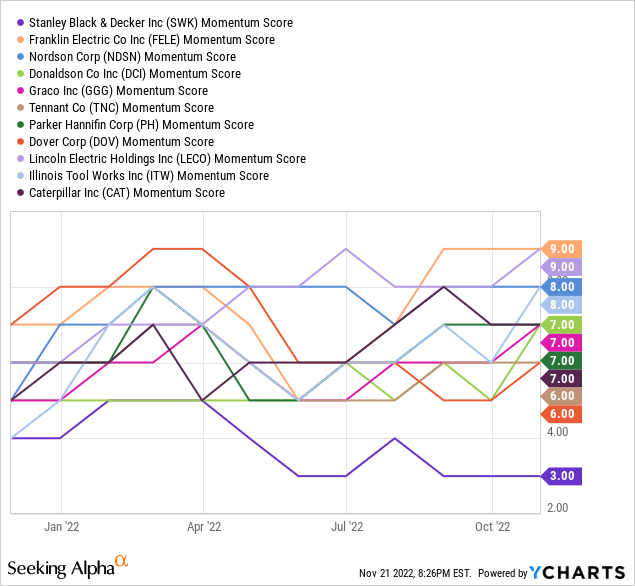
Momentum Score
Looking at the momentum scores, there was a wider range of scores compared to the fundamental scores. Franklin Electric and Lincoln Electric Holdings both had scores of 9, while at the other end of the spectrum Stanley Black & Decker had a score of 3.
Score Rankings
In the table below, you will see the 11 stocks and their rankings across each of the metrics outlined above. The stocks are sorted in terms of total overall scores.
| Stock | Revenue Growth Ranking | Earnings Growth Ranking | ROA Ranking | ROE Ranking | ROIC Ranking | Dividend Yield Ranking | Dividend Growth Ranking | Normalized PE Ratio Ranking | Price to Book Value Ranking | Fundamental Score | Momentum Score | Total Score |
| Lincoln Electric Holdings, Inc. | 8 | 9 | 4.5 | 5 | 5.5 | 6.5 | 3 | 8 | 1 | 9 | 9 | 68.5 |
| Franklin Electric Co., Inc. | 11 | 11 | 3 | 2 | 2.5 | 1 | 4.5 | 6 | 4.5 | 10 | 9 | 64.5 |
| Stanley Black & Decker, Inc. | 10 | 8 | 1.5 | 1.5 | 1.5 | 11 | 1.5 | 11 | 5.5 | 10 | 3 | 64.5 |
| Dover Corporation | 6 | 10 | 2.5 | 3.5 | 3 | 3 | 2 | 10 | 3.5 | 9 | 6 | 58.5 |
| Donaldson Company, Inc. | 7 | 6 | 4 | 4 | 4 | 6.5 | 1 | 5 | 2.5 | 10 | 7 | 57 |
| Graco Inc. | 9 | 5 | 5.5 | 3 | 4.5 | 5 | 3.5 | 2 | 2 | 10 | 7 | 56.5 |
| Illinois Tool Works Inc. | 3 | 3 | 5 | 5.5 | 5 | 10 | 4 | 3 | 0.5 | 8 | 8 | 55 |
| Caterpillar Inc. | 2 | 4 | 2 | 4.5 | 2 | 9 | 2.5 | 9 | 1.5 | 7 | 7 | 50.5 |
| Nordson Corporation | 4 | 7 | 3.5 | 2.5 | 3.5 | 2 | 5.5 | 1 | 3 | 10 | 8 | 50 |
| Parker-Hannifin Corporation | 5 | 1 | 1 | 1 | 0.5 | 8 | 5 | 7 | 4 | 9 | 7 | 48.5 |
| Tennant Company | 1 | 2 | 0.5 | 0.5 | 1 | 4 | 0.5 | 4 | 5 | 9 | 6 | 33.5 |
Conclusion
The top 3 stocks
Looking at the table above, you can see that the three stocks with the highest overall scores include:
- Lincoln Electric Holdings – Total Score of 68.5
- Franklin Electric – Total Score of 64.5
- Stanley Black & Decker – Total Score of 64.5
Lincoln Electric Holdings took the top spot by performing well across the board in each metric with the exception of Price to Book Value in which it ranked next to last. Franklin Electric had the highest revenue and earnings growth out of the 11 stocks but did not rank as well in terms of the ROA, ROE, and ROIC metrics. It also ranked last in dividend yield. Like Lincoln Electric, Stanley Black and Decker also performed well across the majority of metrics. If it wasn’t for the low momentum score of Stanley Black and Decker it would have most likely been the top-ranked stock.
The next 7 stocks
The score range between the next 7 stocks is only 10 points with Dover ranking 4th overall with a score of 58.5 and Parker Hannifin ranking 10th overall with a score of 48.5. Each of these stocks has positives and negatives going for them when looking across the board. For example, Graco has strong revenue growth and a top fundamental score. Dover has had the second-best earnings growth out of the 11 stocks over the past three years and is attractively valued when looking at its normalized P/E ratio. Nordson has the highest 5-year dividend growth rate of the 11 stocks and a top fundamental score of 10.
Some negatives would include Donaldson Company’s low dividend growth compared to most of the other stocks, Parker-Hannifin’s low earnings growth, and Caterpillar’s low revenue growth.
The last stock
The lowest-scoring stock is Tennant Company with a total score of 33.5 (15 points lower than the 10th-ranked stock). Tennant ranked last or second to last in seven of the eleven metrics reviewed, including both revenue and earnings growth.
Tennant is currently ranked as a buy from both SA Authors and Wall Street, but I don’t agree with that sentiment.
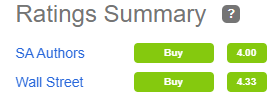
Seeking Alpha
Based on the poor financials and overall performance of Tennant I don’t think its current trend is likely to turn around any time soon. The company lowered both its earnings and revenue full-year guidance significantly with its latest quarterly results. I agree with SA’s quant rating of ‘hold‘ for those already invested in this stock, but for others, I see no reason to buy this stock as a long-term investment when in my opinion the other 10 stocks reviewed in this article are better options in one way or another.
Final Thoughts
I think the remaining ten stocks are all suitable investment options for long-term investors based on their individual goals even if the top 3 ranked stocks are perhaps not the best options. For example, some may be weary of the 3rd ranked stock considering the recent poor performance of Stanley Black & Decker (down over 56% year to date), but I believe the current price makes it likely that long-term investors will be rewarded. SWK was ill-prepared for the pandemic-related issues it has faced, but I think a return to normalcy will also be a return to greater profitability for this stock.
Nordson is worth taking a look at for dividend growth investors as it has the highest 5-year dividend growth rate of the 11 stocks and considering its recent share buyback and strong quarterly results, I don’t see any reason that trend won’t continue.
As always, I suggest individual investors perform their own research before making any investment decisions. For part 8 of this series, I will be ranking the 6 Dividend Champion stocks in the REIT industry.
Be the first to comment