

Lemon_tm
Overview
In this series of articles, I will be reviewing Dividend Champions from a specific industry and selecting stocks as long-term buys, current holds, or stocks to avoid based on a variety of financial and valuation metrics. More information regarding the Dividend Champions list can be found here.
I believe that one of the best ways to improve is by looking back and reviewing your past work. For the first 4 parts of this series, I reviewed the successes/failures from my original articles in 2017 and using those reviews to update the metrics used to have a more reliable indicator of future returns. You can click on these links to see Part 1, Part 2, and Part 3 of this series.
Starting with Part 5 of this series I will be applying the updated metrics and scoring system (determined through parts 1 and 4 of this series) and using that to rank Dividend Champions in other industries. For part 6, I will be looking at the eight Dividend Champion stocks in the Insurance industry and they include:
- Aflac (AFL)
- Brown & Brown (BRO)
- Chubb Limited (CB)
- Cincinnati Financial (CINF)
- Erie Indemnity (ERIE)
- Old Republic International (ORI)
- RLI (RLI)
- RenaissanceRe Holdings (RNR)
Updating The Scoring System
In my original articles from 2017, I used the following metrics to rank stocks: Revenue Growth, Earnings Growth, ROA, ROE, ROIC, Dividend Yield, Dividend Growth, PE Ratio, and Price to Book Value.
I will be using a similar ranking system as I used 5 years ago with a few tweaks based on the review of results from the first four articles of the original series of articles. These updates include:
- Revenue/Earnings Growth – The time frame of these 2 metrics will be shortened from 5 years to 3 years to place more importance on recent growth
- Dividend Growth – This metric will be weighted so that its impact on the total score is reduced by 50%.
- PE Ratio – In the original article, I ranked the stocks based on the trailing PE ratio. For this new series of articles, I will be using its normalized PE ratio to help determine the company’s long-term value.
- Price to Book Value – This metric will be weighted in the same manner as dividend growth
In addition to these updates, I will be adding two additional metrics from YCharts to the rankings of these stocks:
- Fundamental Score – additional details on this score can be found here.
- Momentum Score – additional details on this score can be found here.
Starting in Part 3 of this series of articles, I have also started applying the same weight to the ROA, ROE, and ROIC metrics that have been applied to the Dividend Growth and Price to Book Value metrics.
The New Metrics
Revenue Growth
This chart shows the revenue growth of each stock over the past three years.
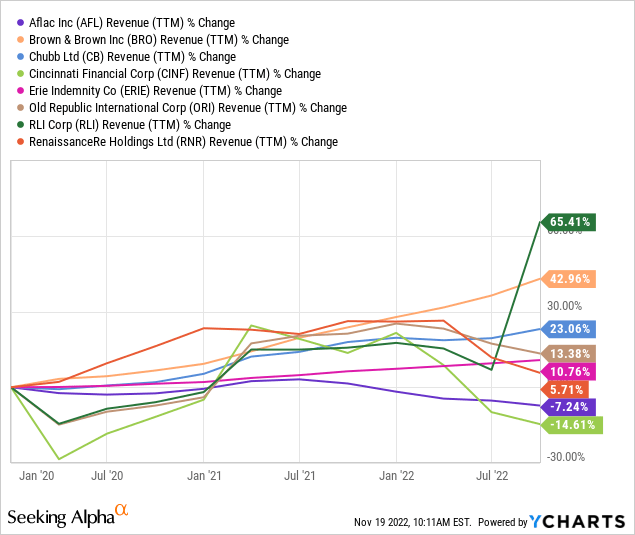
You can see that RLI has seen the highest revenue growth, mainly due to its impressive results this year. Brown & Brown has also seen impressive revenue growth during this time and its growth has been more consistent. On the other end of the spectrum, Aflac and Cincinnati Financial are the two stocks that have seen declines in revenue over the past three years.
Earnings Growth
This chart shows the earnings growth of each stock over the past three years.
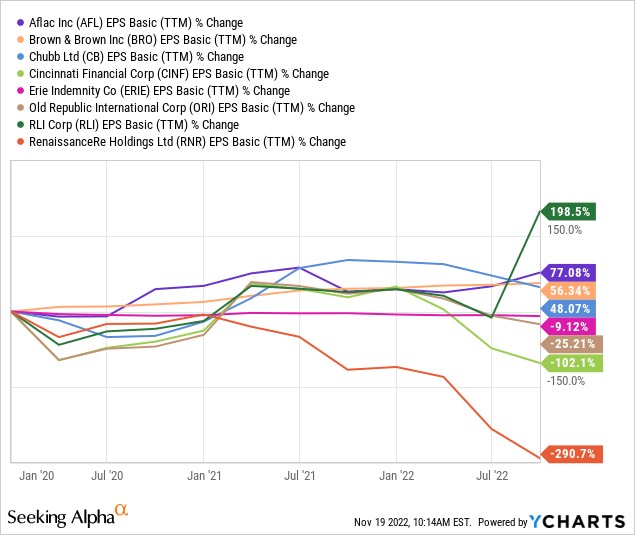
RLI once again has the highest return over the past three years, but Aflac this time comes in second with impressive earnings growth. Out of the eight stocks, four of them have seen declines in earnings over the past three years. These include Erie Indemnity, Old Republic International, Cincinnati Financial, and RenaissanceRe Holdings.
Return on Assets
This chart shows the current ROA value of each stock.
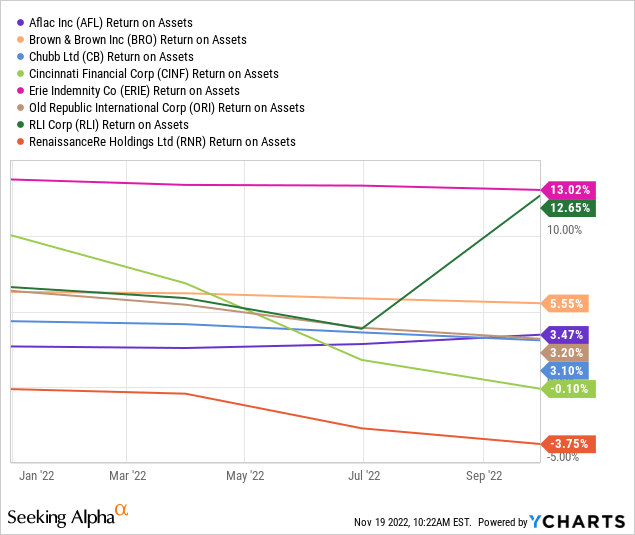
Erie Indemnity and RLI have the two highest ROA values out of the eight stocks, while Cincinnati Financial and RenaissanceRe Holdings are the two stocks with negative ROA values.
Return on Equity
This chart shows the current ROE value of each stock.
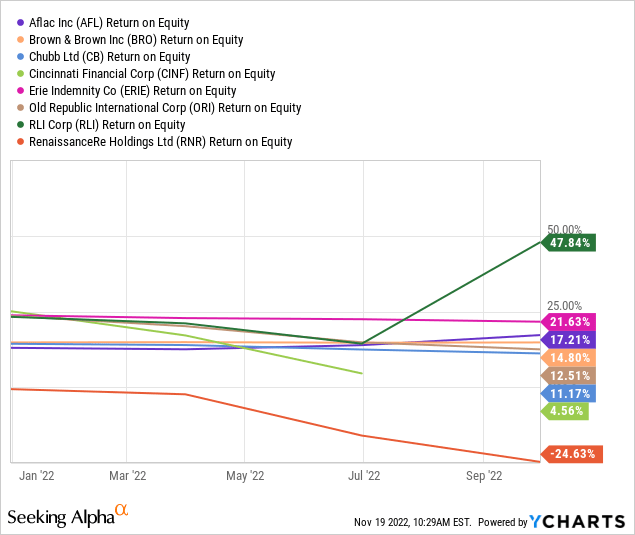
The eight stocks are similarly ranked in terms of ROE with only RLI/Erie Indemnity and Aflac/Brown & Brown swapping spots in comparison to their ROA rankings. The four bottom stocks remained in the same positions with RenaissanceRe Holdings being the only stock with a negative value.
Return on Invested Capital
This chart shows the current ROIC value of each stock.
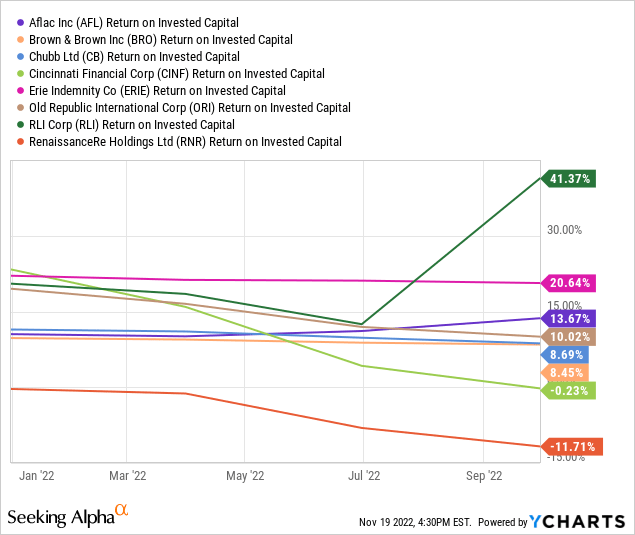
RLI once again is ranked on top in terms of ROIC, with Cincinnati Financial and RenaissanceRe Holdings being the two stocks with negative values.
Dividend Yield
This chart shows the current dividend yield of each stock.
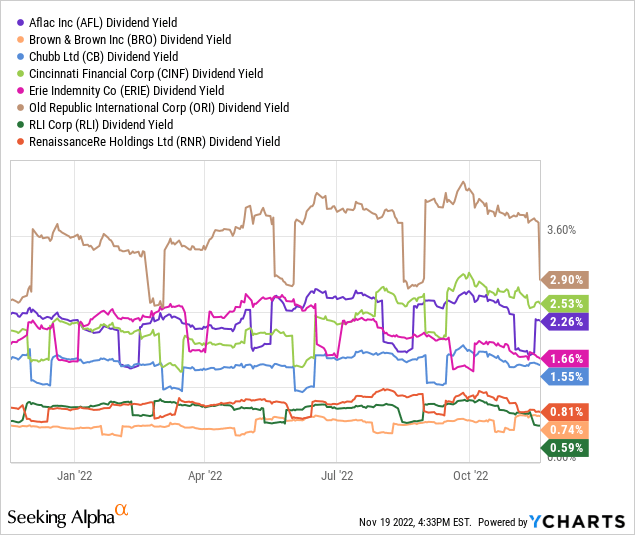
Old Republic has the highest current yield at nearly 3%, while RLI has the lowest yield at 0.59%.
Dividend Growth
Listed below is each stock ranked in order of its 5-year dividend growth rate.
- Aflac – 12.96%
- Brown & Brown – 8.77%
- Erie Indemnity – 7.24%
- Cincinnati Financial – 6.4%
- RLI – 4.46%
- Old Republic International – 3.74%
- Chubb – 3.09%
- RenaissanceRe Holdings – 2.97%
Normalized PE ratio
This chart shows the normalized PE ratio of each stock.
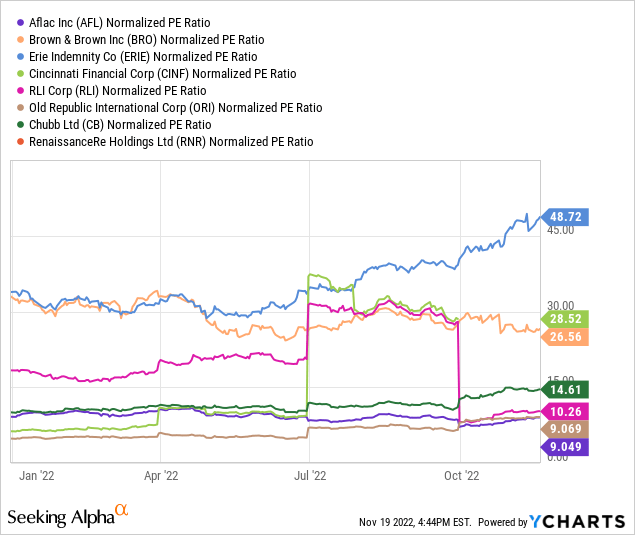
Based on these valuations, Aflac and Old Republic appear to be attractively valued, while Erie Indemnity appears to be the most overvalue stock with a normalized PE value well above the other seven stocks.
Price to Book Value
This chart shows the price-to-book value of each stock.
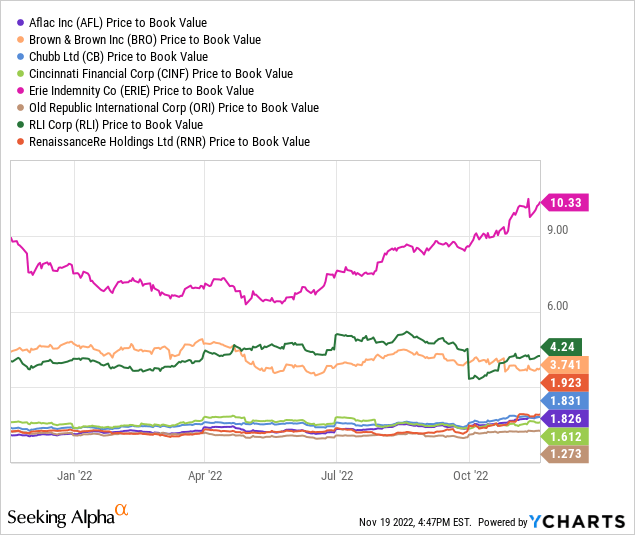
Based on price-to-book value, Old Republic and Cincinnati Financial appear to be the most attractively valued stocks, while Erie Indemnity is once again the most overvalued stock with a price to book value greater than the other seven stocks.
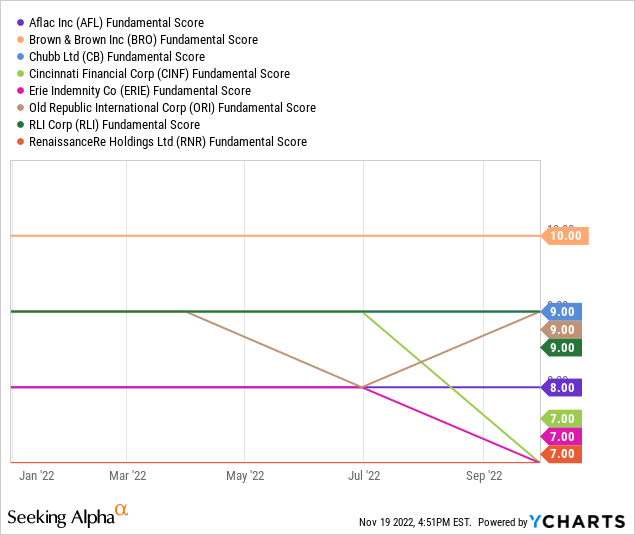
Fundamental Score
In terms of fundamental scores, Brown & Brown is the only stock with a high score of 10. Three of the remaining stocks have scores of 9, three more of scores of 7, and Aflac sits in the middle alone with a score of 8.
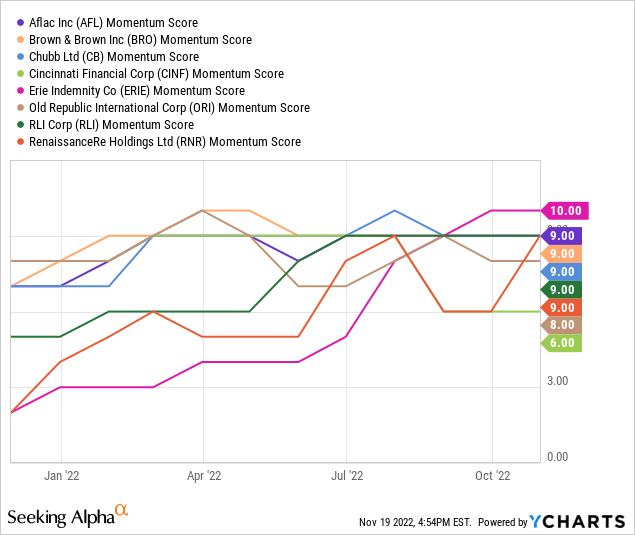
Momentum Score
In terms of momentum scores, Erie Indemnity has the highest score of 10, with five of the remaining stocks holding a score of 9. The bottom two stocks are Old Republic International with a score of 8 and Cincinnati Financial with a score of 6.
Score Rankings
In the table below, you will see the 8 stocks and their rankings across each of the metrics outlined above. The stocks are sorted in terms of total overall scores.
| Stock | Revenue Growth Ranking | Earnings Growth Ranking | ROA Ranking | ROE Ranking | ROIC Ranking | Dividend Yield Ranking | Dividend Growth Ranking | Normalized PE Ratio Ranking | Price to Book Value Ranking | Fundamental Score | Momentum Score | Total Score |
| RLI Corp. | 8 | 8 | 3.5 | 4 | 4 | 1 | 2 | 6 | 1 | 9 | 9 | 55.5 |
| Aflac Incorporated | 2 | 7 | 2.5 | 3 | 3 | 6 | 4 | 8 | 3 | 8 | 9 | 55.5 |
| Old Republic International Corporation | 5 | 3 | 2 | 2 | 2.5 | 8 | 1.5 | 7 | 4 | 9 | 8 | 52 |
| Brown & Brown, Inc. | 7 | 6 | 3 | 2.5 | 1.5 | 2 | 3.5 | 3 | 1.5 | 10 | 9 | 49 |
| Chubb Limited | 6 | 5 | 1.5 | 1.5 | 2 | 4 | 1 | 5 | 2.5 | 9 | 9 | 46.5 |
| Erie Indemnity Company | 4 | 4 | 4 | 3.5 | 3.5 | 5 | 3 | 1 | 0.5 | 7 | 10 | 45.5 |
| Cincinnati Financial Corporation | 1 | 2 | 1 | 1 | 1 | 7 | 2.5 | 2 | 3.5 | 7 | 6 | 34 |
| RenaissanceRe Holdings Ltd. | 3 | 1 | 0.5 | 0.5 | 0.5 | 3 | 0.5 | 4 | 2 | 7 | 9 | 31 |
Conclusion
The top 2 stocks
Looking at the table above, you can see that RLI and Aflac tied for 1st place with a top score of 55.5. RLI had the highest revenue/earnings growth of the eight reviewed stocks, while Aflac scored well in a number of metrics including earnings growth, ROE, ROIC, Dividend Yield, and PE ratio.
The middle 4 stocks
The score ranges between the top stocks and the next four are not that wide. The final scores for the middle four stocks are:
- Old Republic International – Total score of 52
- Brown & Brown – Total score of 49
- Chubb – Total score of 46.5
- Erie Indemnity – Total score of 45.5
Old Republic’s revenue and earnings growth hasn’t been all that impressive, but its high dividend yield and attractive valuation helped it secure the number 3 spot in the rankings.
The bottom 2 stocks
Both Cincinnati Financial and RenaissanceRe Holdings score very low compared to the other stocks with total scores of 34 and 31 respectively. RenaissanceRe Holdings scored dead last in 6 of the 11 scored metrics, while Cincinnati Financial scored last in 3 of them and second to last in several others. Cincinnati Financial does have a decent dividend yield of 2.53% going for it, which might make it somewhat attractive to dividend investors, but considering Old Republic’s yield is 2.9% with stronger revenue/earnings growth and a more attractive valuation, I don’t see any reason long term investors should select either of these bottom two stocks as suitable investment options.
Final Thoughts
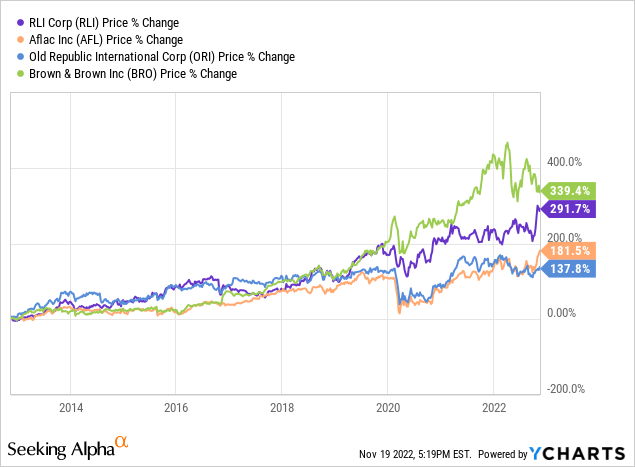
While RLI and Aflac tied for the highest ranking, I also believe that Old Republic and Brown & Brown are strong investment options for long terms investors as well. For Old Republic, I like its high dividend yield (compared to others in the industry) and attractive valuation. For Brown & Brown, I kind of think of it as the tortoise from that goes slow and steady but eventually wins the race. It has seen long-term consistency in terms of revenue and earnings growth and has the 2nd best 5-year dividend growth rate out of the eight stocks. Looking at the chart below, you can see that it has actually seen the best price appreciation over the past ten years out of the top 4 ranked stocks.
My favorite picks for this group of stocks are the top four ranked stocks, but Chubb and Erie Indemnity are also decent investment options. I don’t love Chubb’s low dividend growth and feel that Erie Indemnity is overvalued at the moment, but they are definitely good stocks to keep on the radar. I feel that currently the bottom two stocks should be avoided as long-term investment options.
As always, I suggest individual investors perform their own research before making any investment decisions. For part 7 of this series, I will be ranking the 11 Dividend Champion stocks within the Machinery industry.
Be the first to comment