


Dmytro Aksonov/E+ via Getty Images
I have recently written articles reviewing multiple high-yielding exchange-traded funds (“ETFs”) such as the Schwab U.S. Dividend Equity ETF (SCHD), the Vanguard High Dividend Yield ETF (VYM) and the SPDR Portfolio S&P 500 High Dividend ETF (SPYD). A reader recently sent me a message asking me to review the iShares Core Dividend Growth ETF (NYSEARCA:NYSEARCA:DGRO) and compare it to the other funds I have recently reviewed.
From my analysis below, I find the iShares Core Dividend Growth ETF is a fine challenger to SCHD, with strong historical returns and risk metrics that are only slightly behind that of SCHD. However, it does have a materially lower distribution yield. YTD, it has underperformed peer funds due to its underweight in energy stocks. Overall, I would still prefer SCHD given its higher historical returns and better risk metrics.
Fund Overview
The iShares Core Dividend Growth ETF seeks to provide exposure to companies with a history of consistently growing dividends. The fund has $23 billion in assets.
Strategy
The DGRO ETF seeks to achieve its investment objective by tracking the Morningstar US Dividend Growth Index, which is an index that seeks to measure the performance of U.S. companies selected based on a consistent history of growing dividends. Companies eligible for the index must have at least 5 years of uninterrupted annual dividend growth and must have an earnings payout ratio less than 75%. Companies in the top decile by dividend yield are excluded prior to the dividend growth and payout ratio screens.
Portfolio Holdings
The DGRO ETF has a total of 413 holdings and Figure 1 shows the fund’s sector allocation. Compared to the S&P 500 Index, DGRO is overweight Financials (20% vs. 11% for the S&P 500), Healthcare (18% vs. 14%), Consumer Staples (11% vs. 7%), and Industrials (13% vs. 8%). The fund is underweight Technology (20% vs. 28%), Consumer Discretionary (8% vs. 12%), Communications (2% vs. 8%), and Energy (1% vs. 4%). Interestingly, despite high dividend yields, the fund is underweight telecom and energy stocks. This is likely due to the consistent growth filter screening out energy stocks and the dividend yield and payout filter screening out telecom stocks.
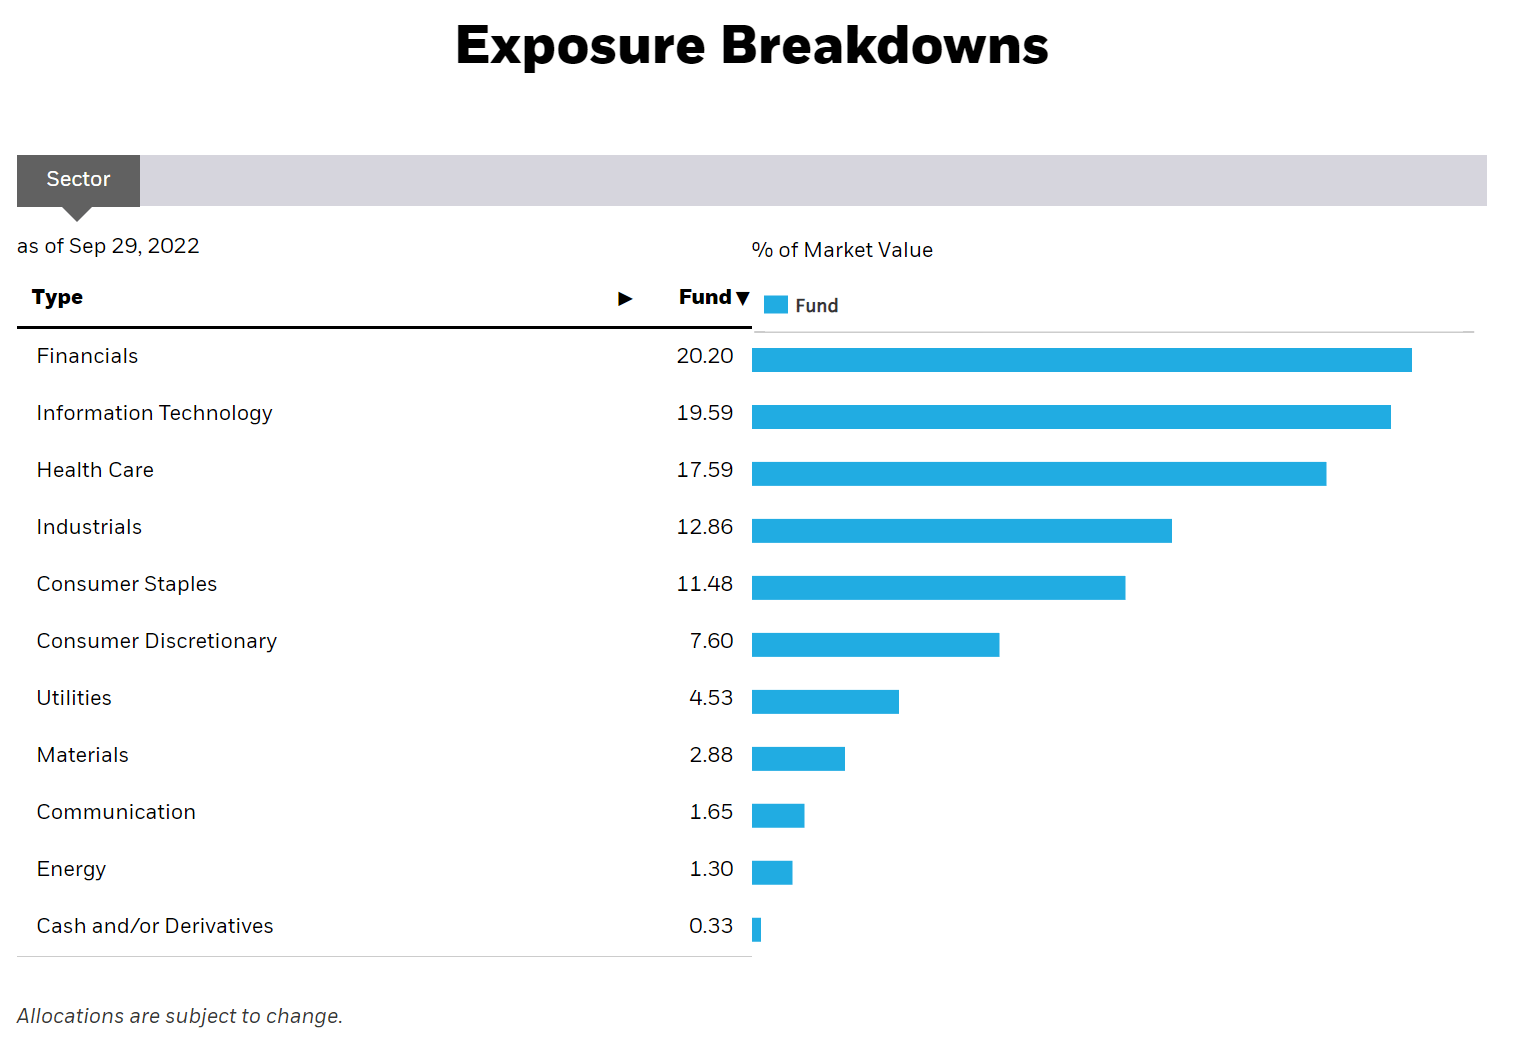
Figure 1 – DGRO Sector Allocation (ishares.com)
Style-wise, the DGRO fund screens as large-cap value, as shown in Figure 2.
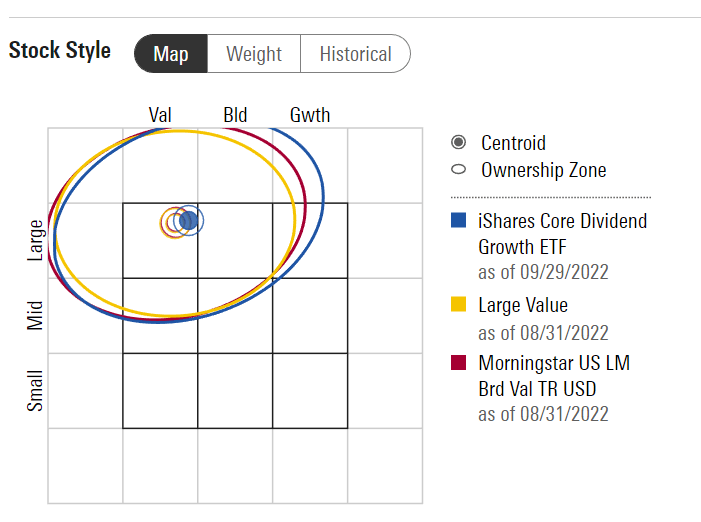
Figure 2 – DGRO Investment Style (morningstar.com)
Figure 3 shows DGRO’s top 10 positions. Combined, the top 10 positions account for 24.9% of the fund’s assets.
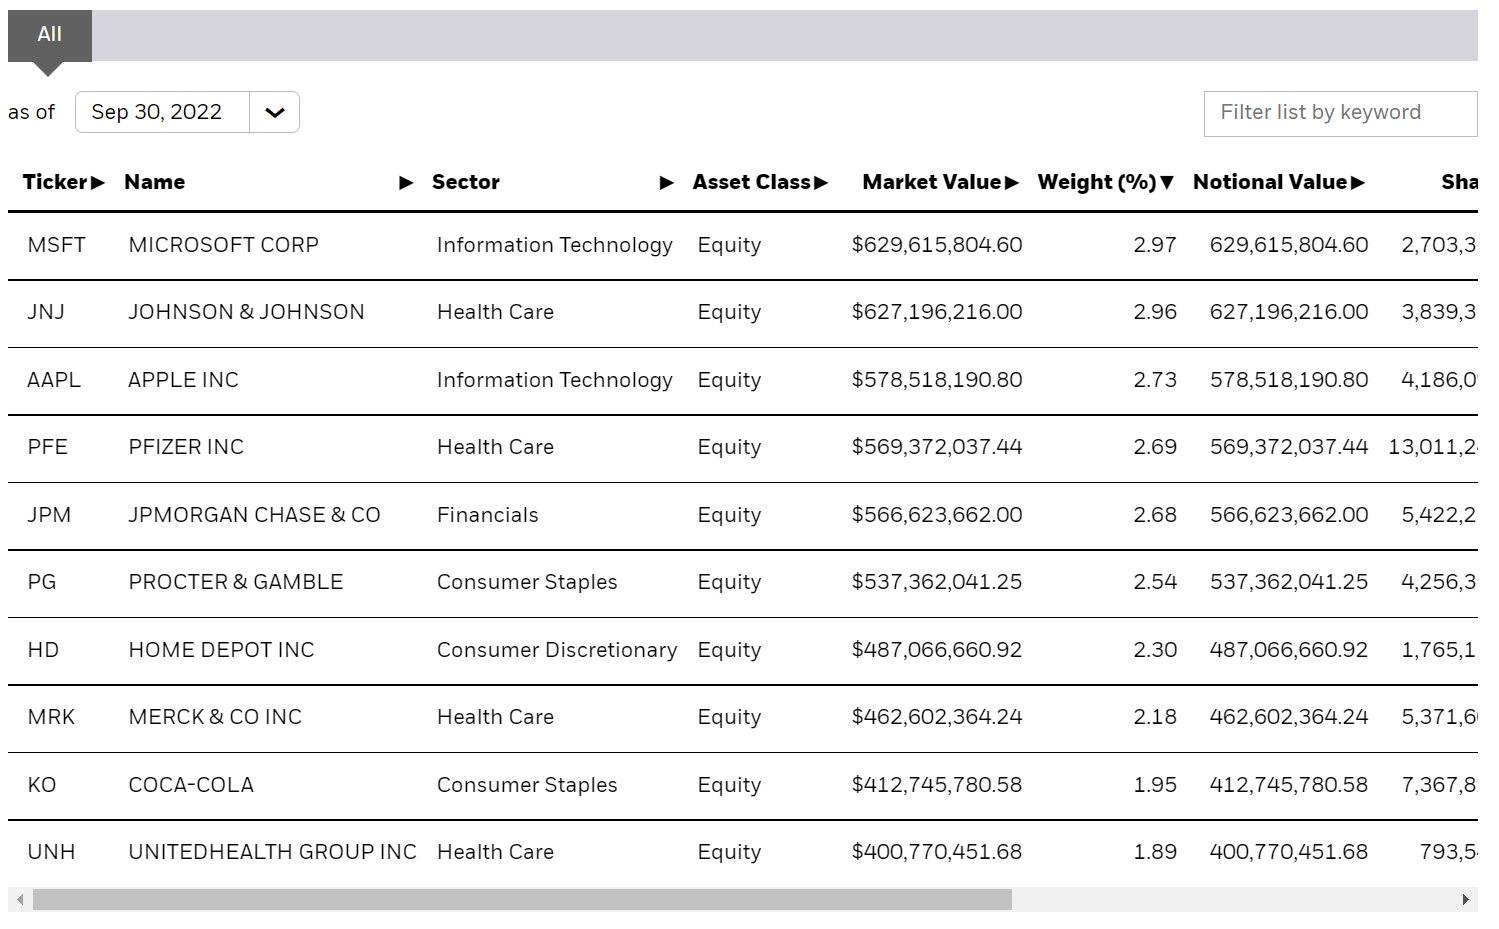
Figure 3 – DGRO Top 10 Positions (ishares.com)
Returns
The DGRO ETF has strong historical performance, with 3 and 5Yr Average Annual returns of 11.0% and 11.5% to August 31, 2022 (Figure 4). This is comparable to the S&P 500’s return of 12.2% and 11.7% for comparable time periods.
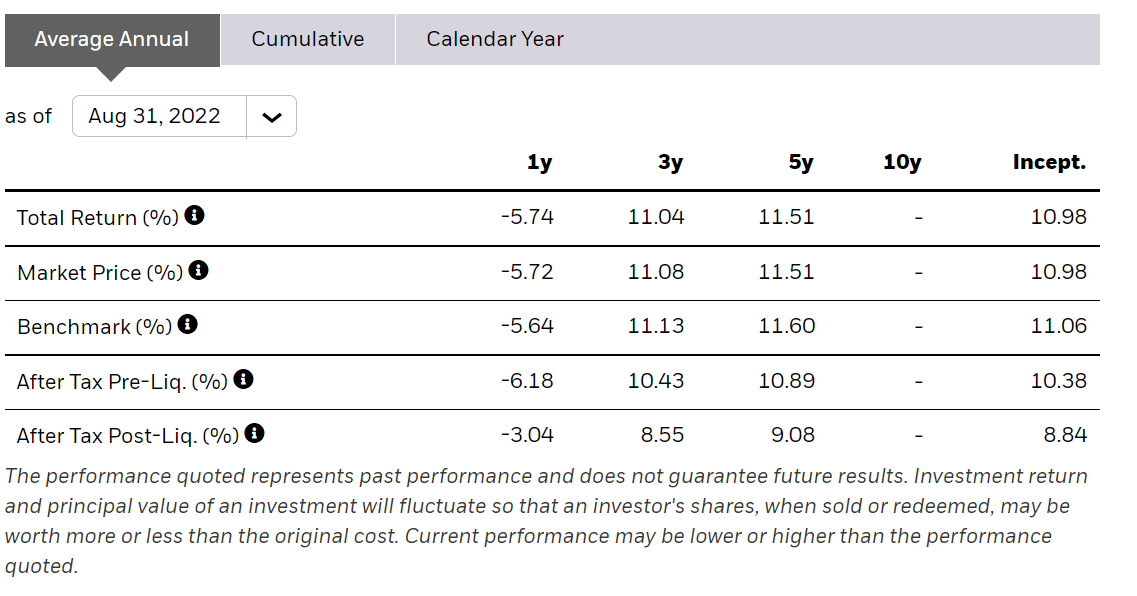
Figure 4 – DGRO Historical Returns (ishares.com)
Distribution & Yield
The DGRO ETF pays a moderate distribution yield, currently at 2.6%. The fund’s distribution has grown at a 5Yr CAGR of 11.4% (Figure 5).
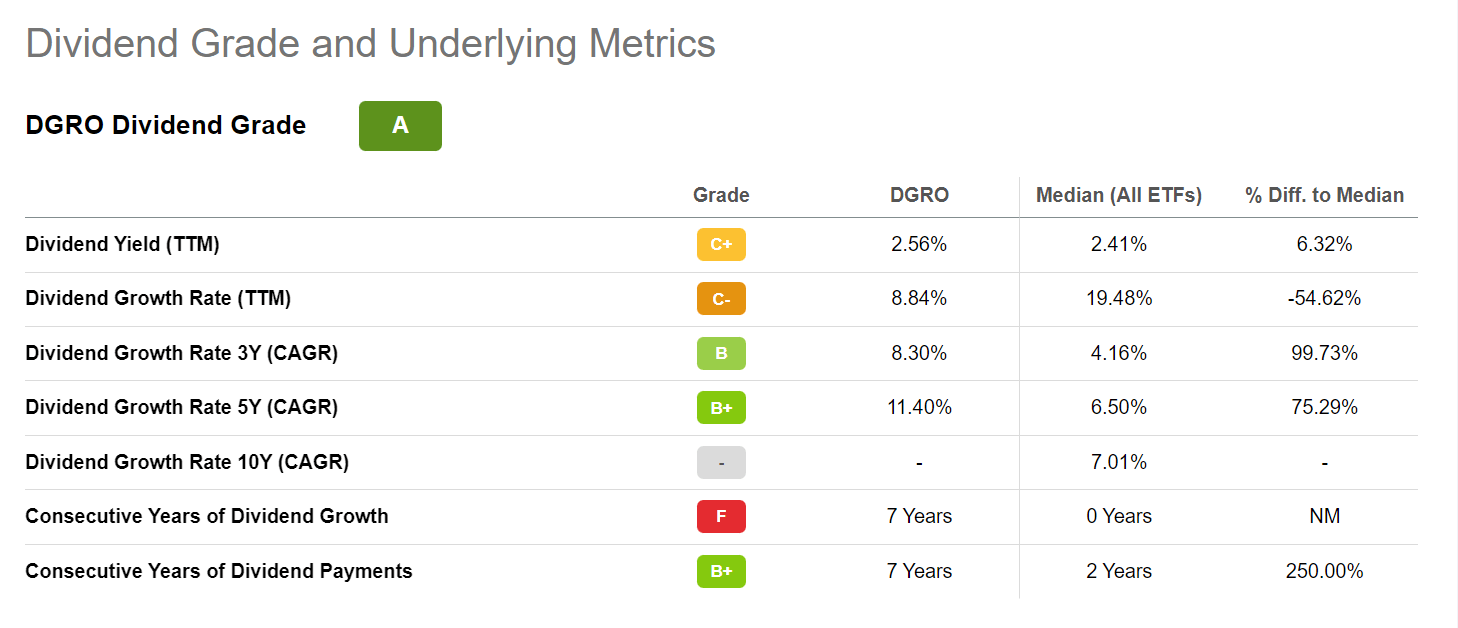
Figure 5 – DGRO Dividend Growth (Seeking Alpha)
DGRO’s distribution is paid quarterly and is variable. It’s latest distribution of $0.3423 / share was paid on September 30.
Fees
The DGRO ETF charges a low expense ratio of 0.08%. When deciding between comparable funds, investors should be mindful of investment expenses. Even a relatively small 0.25% difference in expense ratio compounded over a decade can turn into thousands of dollars of difference in account value.
DGRO vs. SCHD And Other Dividend Growth Funds
Figure 6 summarizes some key metrics between the DGRO ETF and some of the dividend growth funds I have reviewed recently. The returns and risk metrics were computed using Portfolio Visualizer using the time period November 2015 to September 2022, to make returns comparable. Distribution and fund details were obtained from Seeking Alpha.
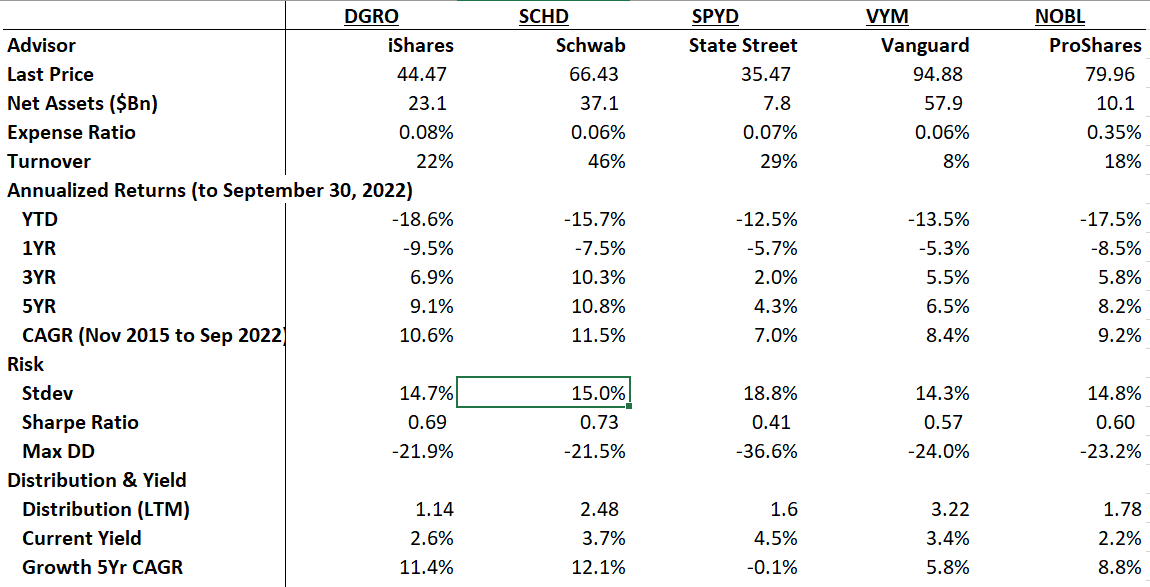
Figure 6 – DGRO vs. Dividend Fund Peers (Author created with returns and risk metrics from Portfolio Visualizer and distribution and fund details from Seeking Alpha)
In terms of returns, we see that DGRO has achieved strong historical returns, with CAGR returns of 10.6%, second only to SCHD’s 11.5%.
However, YTD, DGRO has the worst performance of the group, at -18.6%. Looking at the portfolio exposures, we find that the two YTD outperformers, SPYD and VYM, have relative overweights in energy stocks (9.5% and 10.2% of the funds respectively) that have outperformed due to the ongoing global energy crisis. Meanwhile, DGRO has the lowest energy weight at 1.3% of the fund, which explains the underperformance.
In terms of risk, we find DGRO is also attractive, with inline volatility (four of the funds have Stdev between 14-15%), and the 2nd highest Sharpe ratio of 0.69 vs. 0.73 for SCHD. It also has the 2nd lowest max drawdown of 21.9%.
Finally, in terms of distribution yield, it’s current distribution is relatively low compared to the other 4 funds. However, DGRO has been growing its distribution at a rapid pace of 11.4% CAGR in the past 5 years, the second highest in the group after SCHD.
Conclusion
I think the DGRO ETF is a fine challenger to SCHD, with strong historical returns and risk metrics that are only slightly behind that of SCHD. However, it does have a materially lower distribution yield vs. SCHD. YTD, it has underperformed peer funds due to its underweight in energy stocks. Overall, I would still prefer SCHD given its higher historical returns and better risk metrics.
Be the first to comment