

Key Talking Points:
- Global equities’ pullback resumes despite dovish Fed
- DAX 30 picks up momentum to break out from triangle pattern
- FTSE 100 risks falling below 7,000 as it tests key support
It’s been a bit of a rollercoaster week so far for equities as falling commodity prices and bruised sentiment take a hold of the market. With earning’s season looming in the background, investors are likely wondering how long stock prices can keep up at current levels given how they are running on high multiples which are likely to be unsustainable as wages creep up. Persistent strong inflation also remains a concern as Central Banks around the globe are becoming more lenient with what the upper bound should be.
The Asian session kicked off with strong losses led by the Hang Seng, which is down more than 3% and marks its 8th day of losses out of the last 9 trading sessions. The moves so far seem to be a corrective pullback given how US equities were once again at all-time highs yesterday after the Federal Reserve confirmed its bearish tone saying that conditions of substantial further progress toward its full employment and price stability goals have not been met to warrant scaling back its monthly asset purchases.
It’s a sea of red in Europe this morning as all major indices are falling over 1.2% at the time of writing, with the Italian FTSE Mib taking the biggest beating, down around 2.2% so far. Most of the majors have wiped out yesterday’s gains and it seems to be a situation where individual risks are weighed, poor economic data, rising prices, and a resurgence in Covid cases at the forefront.
A generalized drop in bond yields continues to fuel record highs for indices but after months of extreme valuations many may be thinking it is time for a change in direction, and the question remains as to whether now is the time for that to happen.
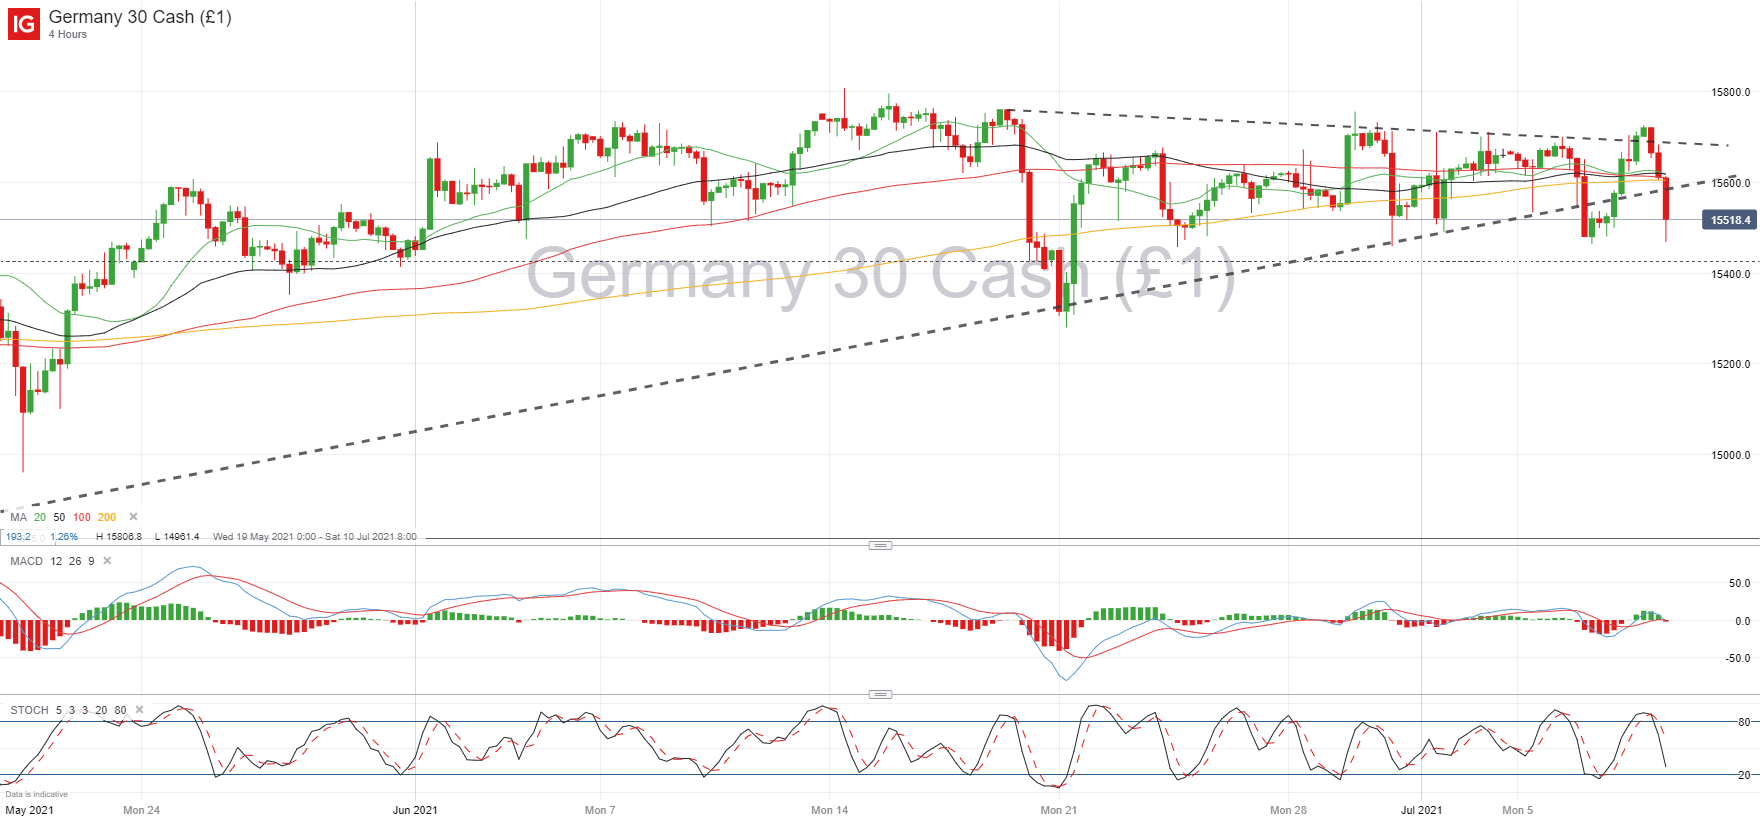
DAX 30 4-hour chart
As expected, the DAX 30 is picking up momentum as it nears the end of its triangle pattern, but the direction is still uncertain. The German index has broken below its trendline support for three sessions in a row, which is a sign of weakness in the lower bound, meaning that we could see a decisive move lower in the next few days. I’d look out for a break below 15,420 to confirm a bearish breakout. Alternatively, the index has also tested the upper bound of the triangle so a break above 15,725 could be a sign of further bullish momentum in an attempt to break its all-time high of 15,806.
FTSE 100 Daily Chart
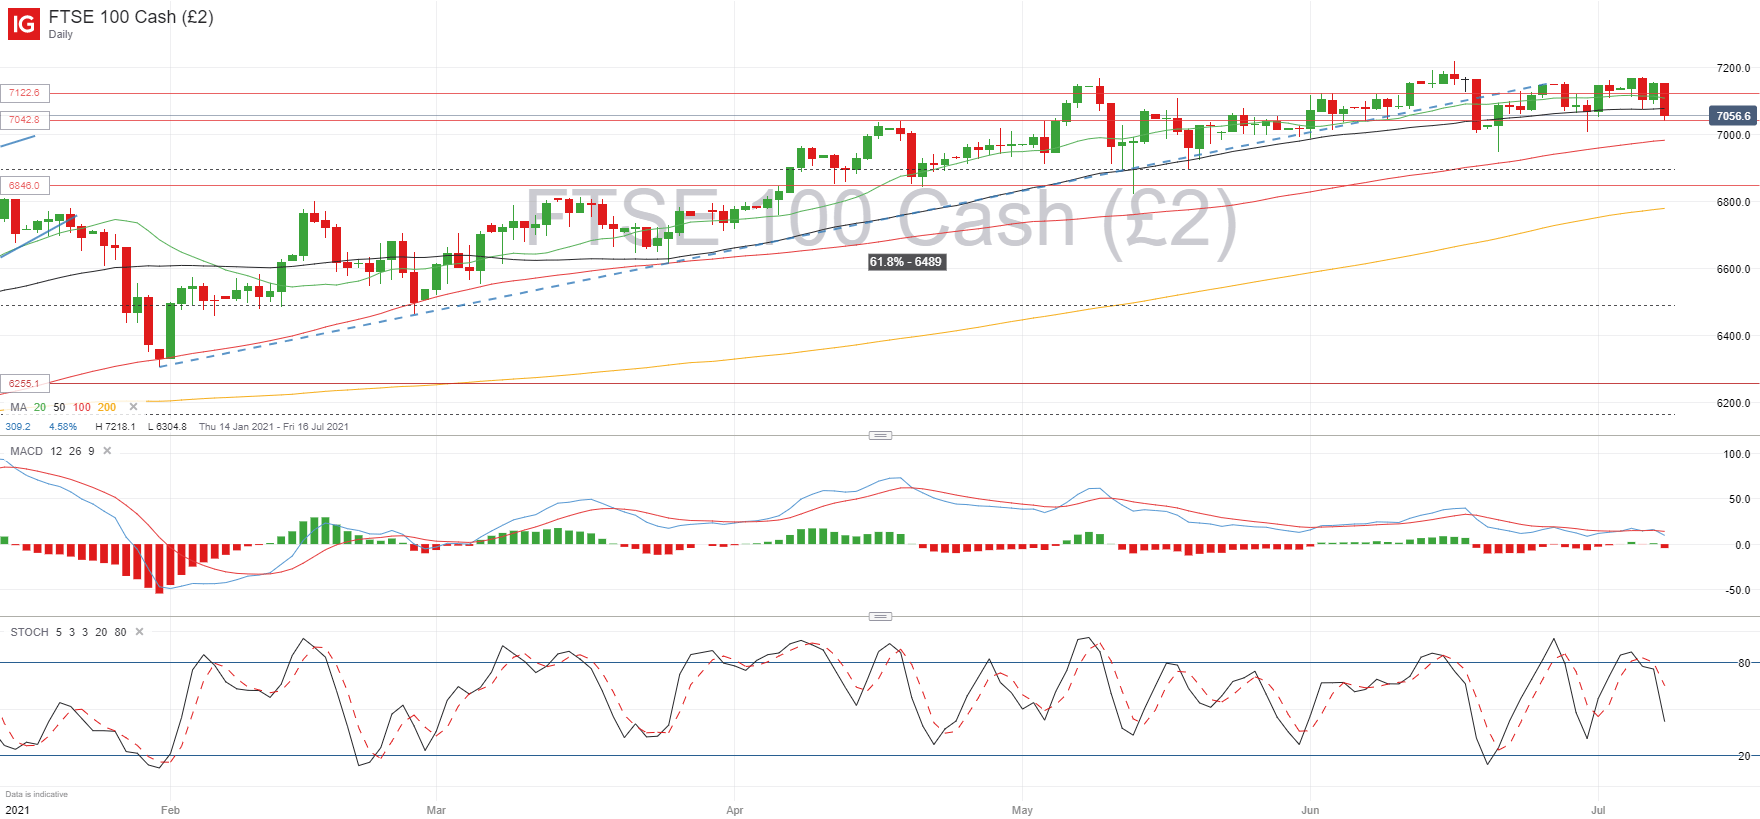
The FTSE 100 has never really managed to settle above the 7,000 mark since it broke it back in April, and the UK index might be about to find itself below this key level once again. The bullish bias of the last few months has started to fade and the FTSE 100 has been consolidating in a horizontal range for the last few weeks. So far the support at 1,042 has held up pretty well but an increased bearish bias could see this level invalidated in the next few days, which means the 7,000 mark is the next key area to watch out for. Alternatively, watch out for a break above 7,200 for a return to bullish momentum.
Learn more about the stock market basics here or download our free trading guides.
— Written by Daniela Sabin Hathorn, Market Analyst
Follow Daniela on Twitter @HathornSabin
Be the first to comment