

jetcityimage/iStock Editorial via Getty Images
I last wrote you about CVS Health stock (NYSE:CVS) in late December 2020. At the time, investment thesis remained valid. The stock was trading a little under $70 a share. This represented an approximate 10 percent gain versus September 2019, when I first identified CVS as a potential opportunity.
More recently, the stock rose to as high as $111, on the heels of good earnings and cash flows.
However, over several trading sessions, CVS has been trading down. On April 4, shares dipped below $100, but closed right at the century mark.
This may develop into an opportunity for investors to accumulate more shares or open a new position.
Worries About Forward EPS and Cash Flow Grip the Street
The Street’s angst (and rating downgrades) appears to be related to two issues.
This first is company’s exposure to opioid-related settlements. In late 2021, a federal jury in Cleveland found that CVS, Walgreens and Walmart were liable for contributing to the opioid epidemic in two Ohio counties. This marked the first time the retail segment of the drug industry has been held accountable in the decades long opioid epidemic. The ruling is being appealed. Notably, the plaintiff’s arguments were rejected twice by judges in California and Oklahoma in cases against opioid manufacturers. In any event, fears the case will set a precedent for other U.S. cities and counties looking to take legal action against corporations remain.
In March, CVS added fuel to the fire when it reached a settlement with the State of Florida for $484 million: without admission of liability or wrongdoing. Payments are to be made over a period of 18 years. Some investors believe this is the first in a long list of settlements that will crimp cash flow over the next two years.
The second issue revolves around what’s called the 340B program. The program requires drug manufacturers to sell certain medications at significant discounts to contracted pharmacies of hospitals and clinics on behalf of low-income and uninsured patients. At least 16 large drug manufacturers announced elimination or curtailment of the participation in the program. This has the propensity to reduce the number of highly profitable 340B prescriptions filled by pharmacy majors like CVS.
My Take on Matters
I acknowledge both issues may affect CVS Health’s financials. However, I do not believe the magnitude of these items will be great enough to change the company’s general earnings / cash flow trajectories. One Street analyst suggested the opioid issue could trim 2024 EPS by 1 percent to 2.5 percent. I could not find a forecast for how the 340B program curtailment may affect CVS’ bottom line.
However, I do not believe either of these issues surprised CVS management. Both these concerns have been long in the making.
As recently as February, management reaffirmed their previous 2022 EPS forecast: $8.10 to $8.30 per share. Operating cash flow is projected to range between $12 billion and $13 billion; indicating this years’ cash flow will (again) be greater than profits.
Meanwhile, other major business goals remain on track:
-
grow the Health Care (Aetna) and Pharmacy Services segments by high-single-digits
-
close unprofitable / duplicative retail locations
-
expand HealthHubs and MinuteClinics to provide access to more Americans
-
continue to reduce debt leverage, and
-
continue to increase the dividend and repurchase shares
Cash Is King!
One of CVS Health’s strongest attributes is the company’s ability to generate prodigious cash flows.
When analyzing CVS’ cash flow, I like to dig deeper than the OCF figures. I prefer to do a levered free cash flow workup. It looks like this:
CVS Health – Levered Free Cash Flow ($B)
|
2021 |
2020 |
|
|
Operating Cash Flow |
18.3 |
15.9 |
|
X Working Capital Movement |
-0.94 |
-0.29 |
|
Less Capex |
-2.52 |
-2.44 |
|
Subtotal |
14.8 |
13.2 |
|
Net Debt Proceeds / Repaid |
-9.31 |
-5.64 |
|
Total LFCF |
5.53 |
7.53 |
In both 2021 and 2020, operating cash flow per share exceeded adjusted EPS. One of the hallmarks of a solid stock is the company’s ability to earn its profits in cash.
CVS does it one better: the business generates more free cash flow than profits.
Debt Is Under Control
When CVS closed on its Aetna Health acquisition, the $69 billion deal added a vertical component to an already healthcare giant. However, the tab was steep: long-term debt increased by $49.2 billion to total $71.4 billion. The 2018 net-debt-to-equity ratio rose to 116 percent from 58 percent pre-acquisition. Wall Street gave the balance sheet the fish-eye. Management promised to get the debt down.
And so they have.
By year-end 2021, CVS Health recorded a net-debt-to-equity ratio of 58 percent. This is the same level it was prior to acquiring Aetna Health.
Dividend Growth Is Back
In addition, management promised to raise the dividend (frozen at $0.50 quarterly since the Aetna acquisition) once the debt load was in order.
They made good on that, too.
On February 1, 2022 the company paid its shareholders a $0.55 cash dividend, a 10 percent increase. Along with the increase, the board of directors also authorized a $10 billion share repurchase plan. That represents about 7.5% of the total diluted shares outstanding.
Is The Stock A Good Investment?
For long-term investors, I perceive recent Street hand-wringing may become more of an opportunity than a threat.
Prior to the recent slide, as CVS stock rose above $100, I began to become less sanguine on the shares: not due to the business and fundamentals, but on valuation concerns. Valuation matters.
However, if the stock slips below $100, the valuation concerns begin to fade.
I offer several valuation methodologies supporting an appropriate FVE (Fair Value Estimate) for CVS stock.
Price-and-Multiple Metrics
FAST Graphs provides a good pictorial view depicting current and historical P/E, P/OCF, and P/FCF.
fastgraphs.com fastgraphs.com fastgraphs.com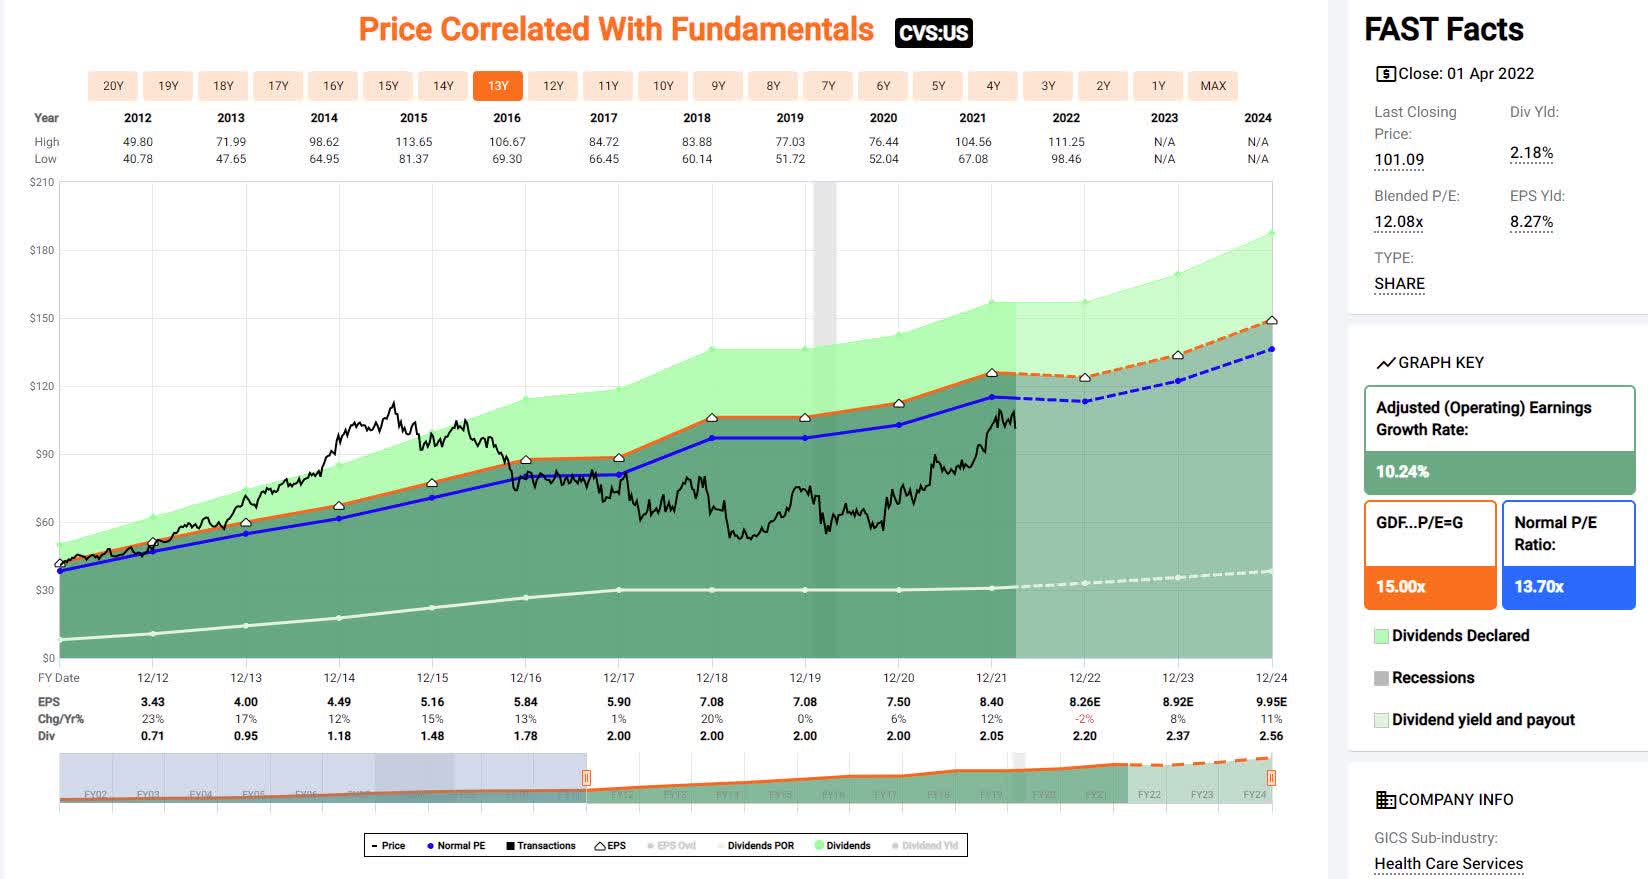


I selected 13-year charts for my valuation work. I picked this time frame because, 1) it reflects post-Great Recession performance, and 2) extending the time frame increases the valuation multiples. I elected to take a more conservative approach.
Furthermore, the increased valuation multiples using a longer-dated chart are justified, since the underlying EPS and cash flow growth rates are higher when including those years when CVS was a smaller and faster-growing company.
Investors may also be aware that if we contrast the valuation multiples after the Aetna acquisition, we find CVS stock experienced multiple compression. Here’s a recap table:
CVS Health Valuation Multiples – Post-Great Recession and Post-Aetna
|
Post Great Recession |
Post Aetna |
|
|
P / E (Operating) |
13.7x |
10.3x |
|
P / OCF |
9.6x |
7.1x |
|
P / FCF |
12.1x |
8.7x |
I contend the Street pressured valuation due to concerns about:
-
the ability of CVS management to integrate Aetna successfully
-
the debt incurred by the acquisition, and
-
the suspended dividend.
Now that these issues have been effectively removed, it seems reasonable the stock should once again enjoy historical long-term valuation multiples. We must recognize an important caveat: a re-rate on valuation should be accompanied by comparable EPS and cash flow growth rates. Not to worry: current CVS forward earnings and cash flow growth rate estimates are expected to meet or exceed those recorded post-Great Recession through year-end 2021.
Therefore, using long-term valuation ratios and 2023 earnings / cash flow estimates, we find CVS’ stock Fair Value may be calculated to be $122, $104, and $113 per share, respectively.
EV-to-EBITDA Ratio
Another common valuation metric is EV-to-EBITDA. Unlike price-and-multiple ratios, this measure considers Enterprise Value. EV includes market capitalization (price) and debt less cash-on-hand. It’s an approximation of the total value of a business.
Here’s a long-term FAST Graph chart highlighting CVS Health EV-to-EBITDA:
CVS Health EV-to-EBITDA (fastgraphs.com)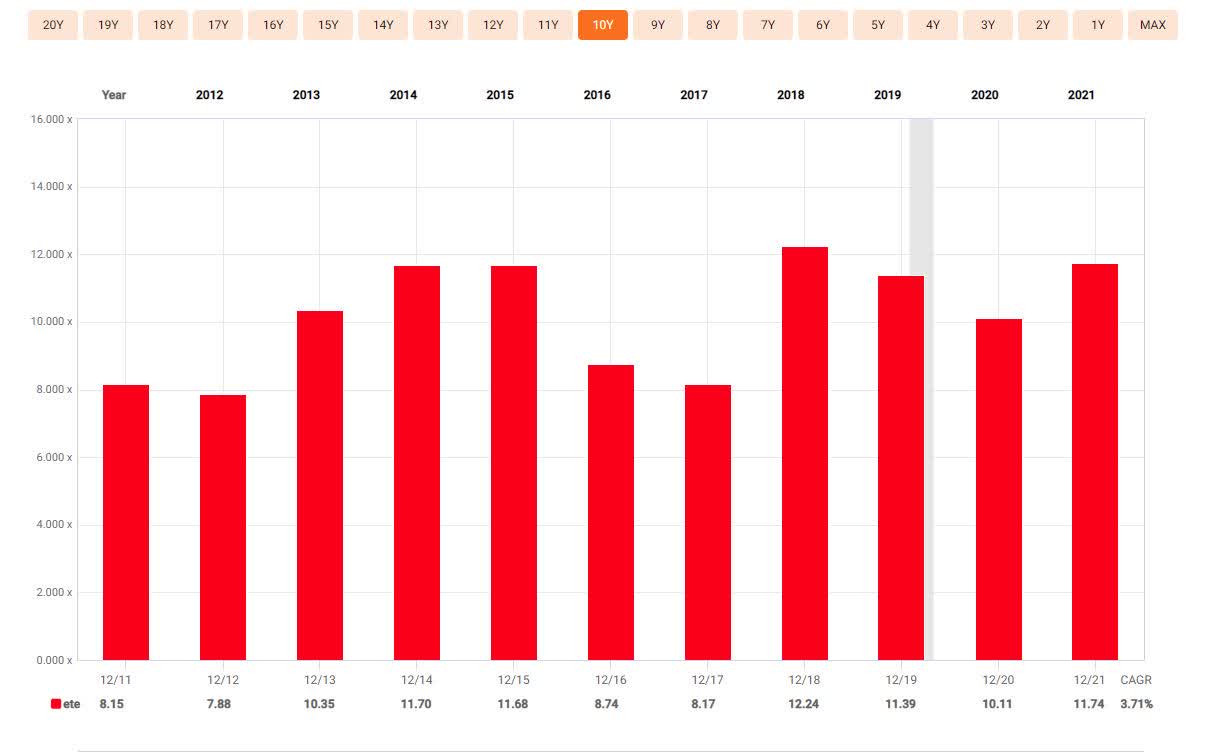
We find the most of the annual results lie between 10x and 12x. At the end of 2021, CVS recorded an 11.7x EV-to-EBITDA ratio. At the time, the stock was trading ~$103 per share.
Since that time, the stock price appears to be easing, and management continues to pay down debt. In 2021, total debt was reduced by $8.8 billion. To achieve their debt leverage targets, management plans to continue to reduce debt aggressively in 2022. Lower share prices and reduced debt will lower the EV.
In addition, EBITDA is expected to increase. Current forecasts indicate EBITDA will be flat this year, before resuming to rise mid-single-digits in 2023 and 2024.
Lower enterprise value and higher EBITDA translate into a lower EV-TO-EBITDA ratio; thereby making owning a part of the business more attractive. Indeed, CVS was not overvalued in the first place.
Comps With Walgreens
Performing a valuation check versus peer Walgreens Boots Alliance Inc (WBA) upholds the valuation thesis. Here’s the same three price-and-multiple FAST Graphs for WBA.
fastgraphs.com fastgraphs.com fastgraphs.com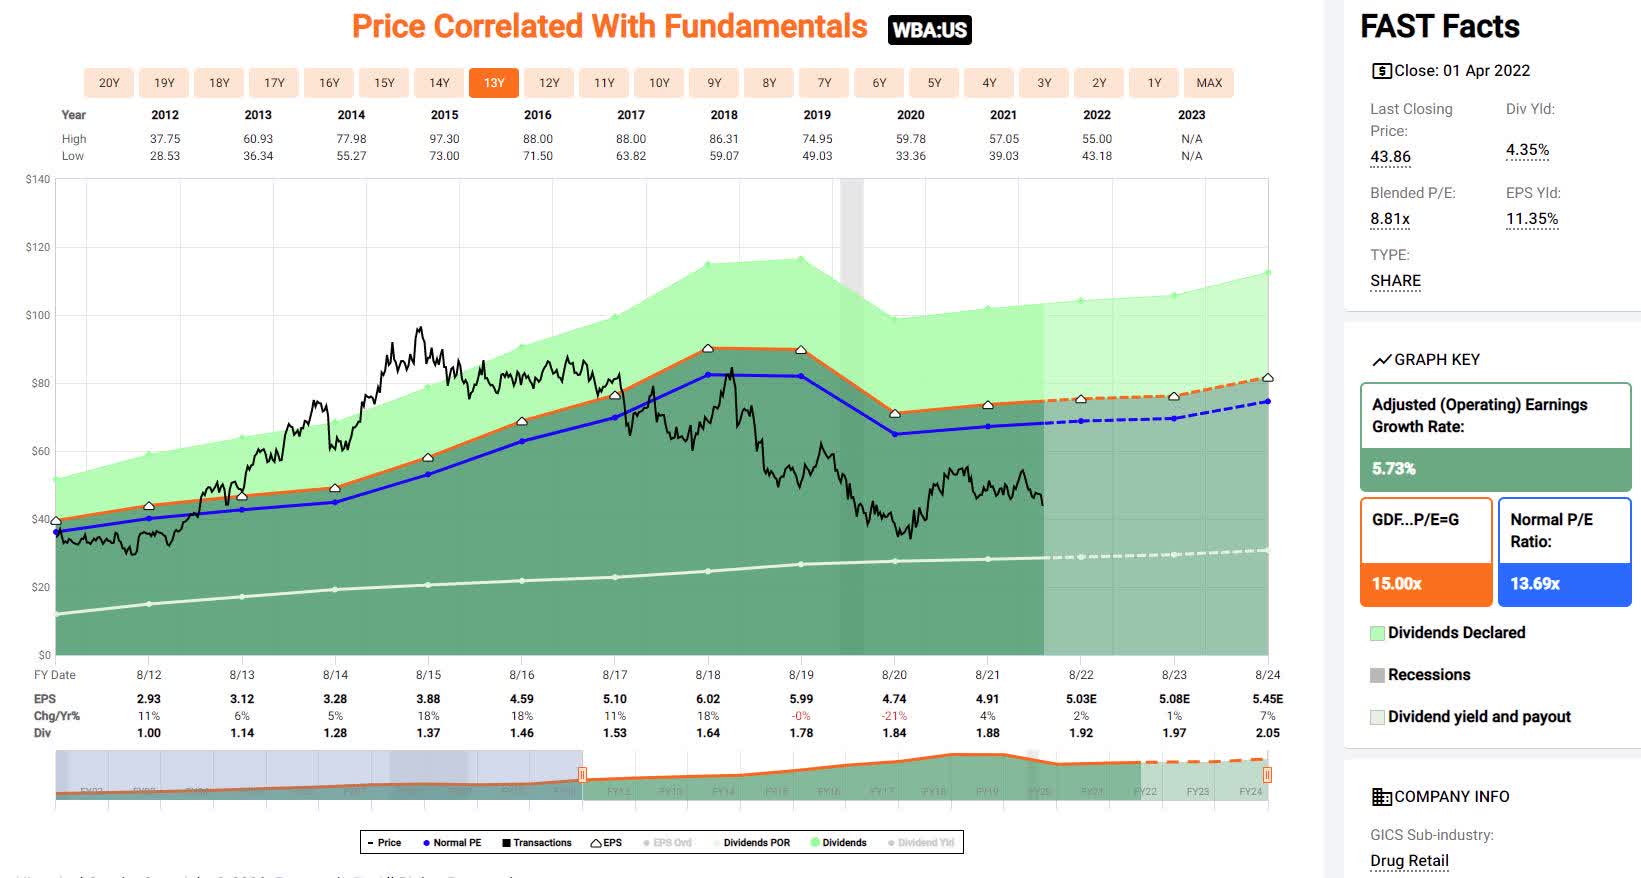


In order to save you time, the following table provides a quick summary of the foregoing:
CVS Health v Walgreens – Long-Term Valuation Multiple Comparison
|
CVS |
Walgreens |
|
|
P / E (Operating) |
13.7x |
13.7x |
|
P / OCF |
9.6x |
10.0x |
|
P / FCF |
12.1x |
13.4x |
The market has awarded comparable long-term trimmed valuation multiples; Walgreens earning somewhat higher cash flow ratios.
Nonetheless, one can make a decent case WBA offers a less-compelling business model and forward outlook. Indeed, Walgreens has the same set of risks facing CVS, but with a less-diversified business scope. CVS appears to be a better operator, too. In 2021, CVS recorded higher EBIT and EBITDA margins than Walgreens.
Turning to current TTM current stock valuations, Walgreens is cheaper on price-and-earnings. CVS is cheaper on price-and-free cash flow. The two stocks are approximately equivalent on price-and-operating cash flow.
Investors may also note in 2020 and 2021, Walgreens’ EV-to-EBITDA ratio was about one or two turns higher than CVS Health.
When compared to Walgreens, CVS does not appears overvalued. If the stock gets more inexpensive, it looks better.
Bottom Line
If one concurs CVS deserves a FVE ~$110, shares start to look attractive below $95. It’s possible Mr. Market may oblige. Given that starting point, one could make a case there’s a good probability shares may see mid-teens capital appreciation. Toss in another two or three percent via a growing dividend.
Not a bad return for a large, safe, well-managed, and cash-rich American business.
Please do your own careful due diligence before making any investment decision. This article is not a recommendation to buy or sell any stock. Good luck with all your 2022 investments.
Be the first to comment